
- This topic has 27,547 replies, 54 voices, and was last updated 13 hours, 59 minutes ago by GVI Forex 2.
-
AuthorPosts
-
April 22, 2024 at 8:28 pm #5024
S&P 500 climbs nearly 1% to end the six-day losing streak
Closing changes on the day:
· S&P 500 up 0.8%
· DJIA +0.7%
· Russell 2000 +1.1%
· Nasdaq Comp +1.0%
· Toronto TSX Comp +0.3%
I had to take a look – such a hysteria that started probably with Bloomberg and then whole net took it over.
It is all in the title, isn’t it ?? Well NO !
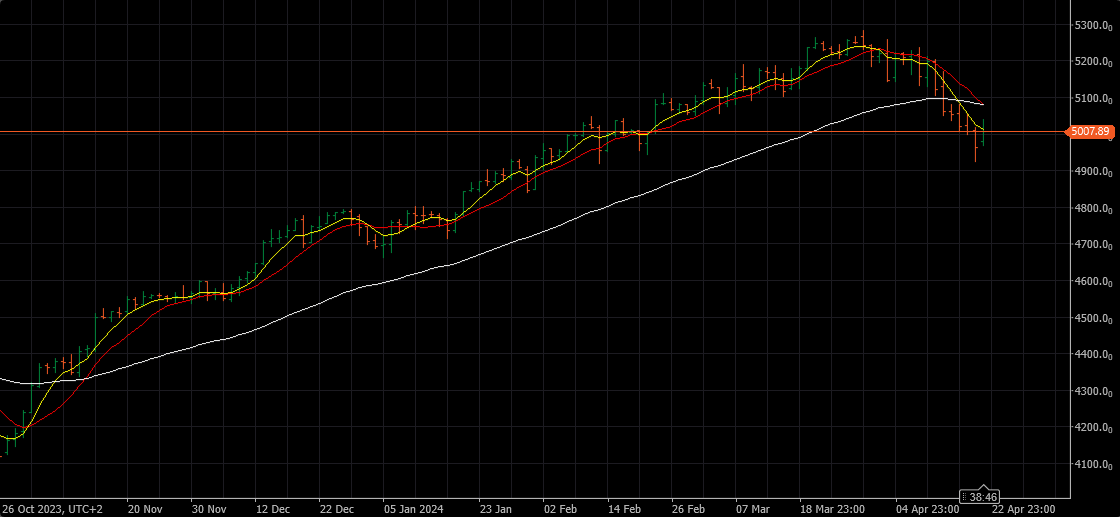
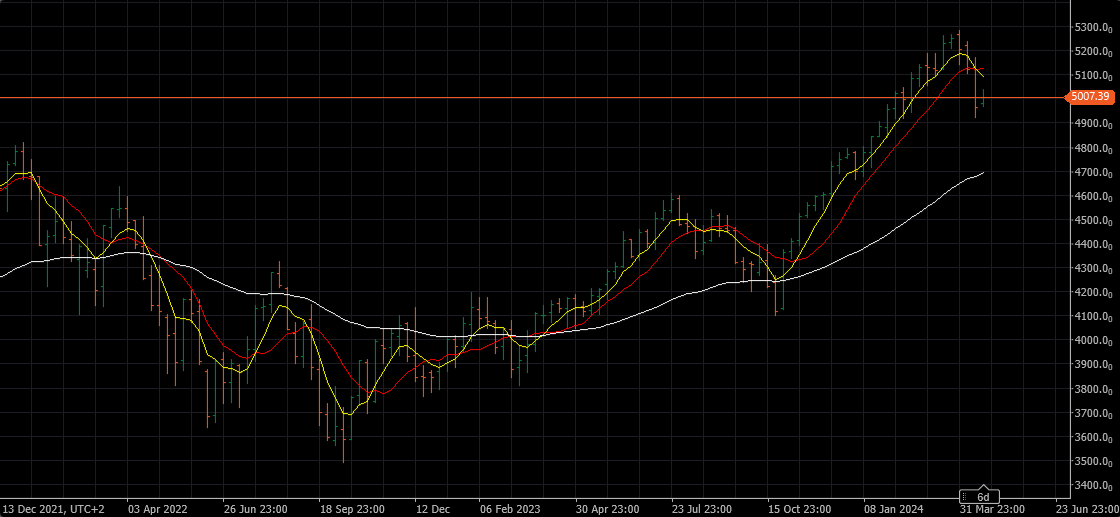
I would use some nice words to explain this , but I am warned to stay away from profanity , so I’ll just show you Daily and Weekly chart of S&P 500.
Does this look Bullish to any of you ??? Honestly….don’t be shy…
I can see the possibility to try for the double top …maybe 5.200, and then 4.600 here we come.
So much fake news, false information and paid advertisements ….
 April 22, 2024 at 7:13 pm #5023April 22, 2024 at 5:59 pm #5018April 22, 2024 at 5:52 pm #5017
AUDJPY 4 HOUR CHART —
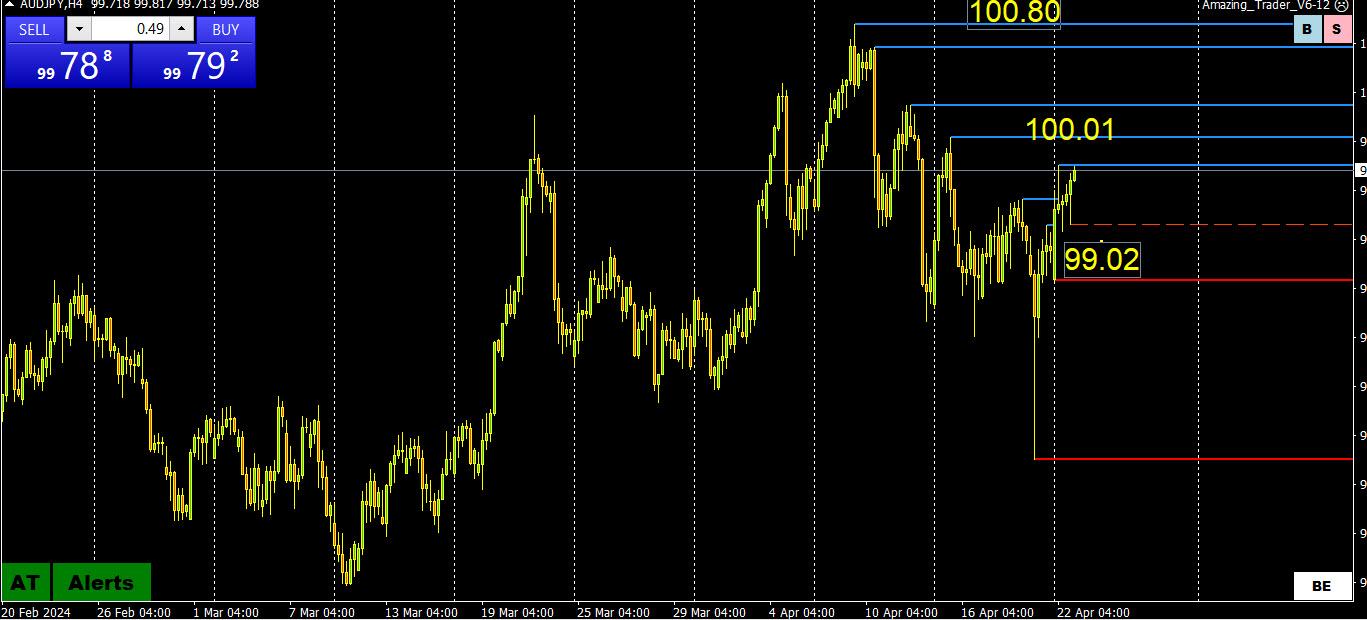
AUDJOY is back in familiar territory after last week’s phantom spike to the downside.
On this chart, expect support as long as it trades above .99.00 but would need to clear 100.01 to put the key 100.80 resistance in play.
Note AUDJPY has moved up mainly on the bounce in AUDUSD while USDJPY has barely moved.
This is an e3xmaple pof using crosses to trade spot and following the path of least resistance with USDJOY still reluctant to challenge 155.
April 22, 2024 at 5:21 pm #5016April 22, 2024 at 4:58 pm #5015Bonds are experiencing a bit of moderate pushback on the attempt to catch wind that has been in play since 4/16 (US). The bid has held since but with this pullback I am paying special attention to the 20yr Index currently at 90.21 and looking like it might test sub-90 and in my view if 89.70 holds we would see yields drop and the Euro as well. I like to pay attention to a group of things because sometimes you get a little “heads up.” A bit of an inflection point starting this week. Just some added input. You know what my position is on Usd.
April 22, 2024 at 4:43 pm #5014April 22, 2024 at 4:09 pm #5013April 22, 2024 at 3:43 pm #5012April 22, 2024 at 3:28 pm #5011April 22, 2024 at 3:23 pm #5010April 22, 2024 at 2:35 pm #5009April 22, 2024 at 2:34 pm #5008JP – Regarding your:
April 22, 2024 at 9:37 am
Trading THEME , week of april 22
–
Correctly identify the degree of difference in the messaging on interest rates from ECB and the Fed AND how much traction that theme has with players and you ll have your “go with” or “go against” trade bias———————————————————————————-
JP it seems to me that ECB wants to start cutting but is apprehensive and waiting for the FED to work in unison. They are communist after all so they like herd mentality.
April 22, 2024 at 2:23 pm #5007April 22, 2024 at 2:21 pm #5006April 22, 2024 at 1:32 pm #4999April 22, 2024 at 12:11 pm #4997April 22, 2024 at 10:48 am #4995AI Replace a Human Trader ?
your morning chuckle:
–
Frm WSJ:
Move Aside, Banks: Giant Funds Now Rule Wall Street
Asset managers are growing into huge and complex financial supermarkets that mint billionaires by the dozen.Big Tech Faces Earnings Test After Market Rout
The Magnificent Seven stocks lost nearly $1 trillion in combined market value last week, increasing pressure on the group to deliverBusiness Tripping: The Professionals Trying Drugs to Get Better at Work
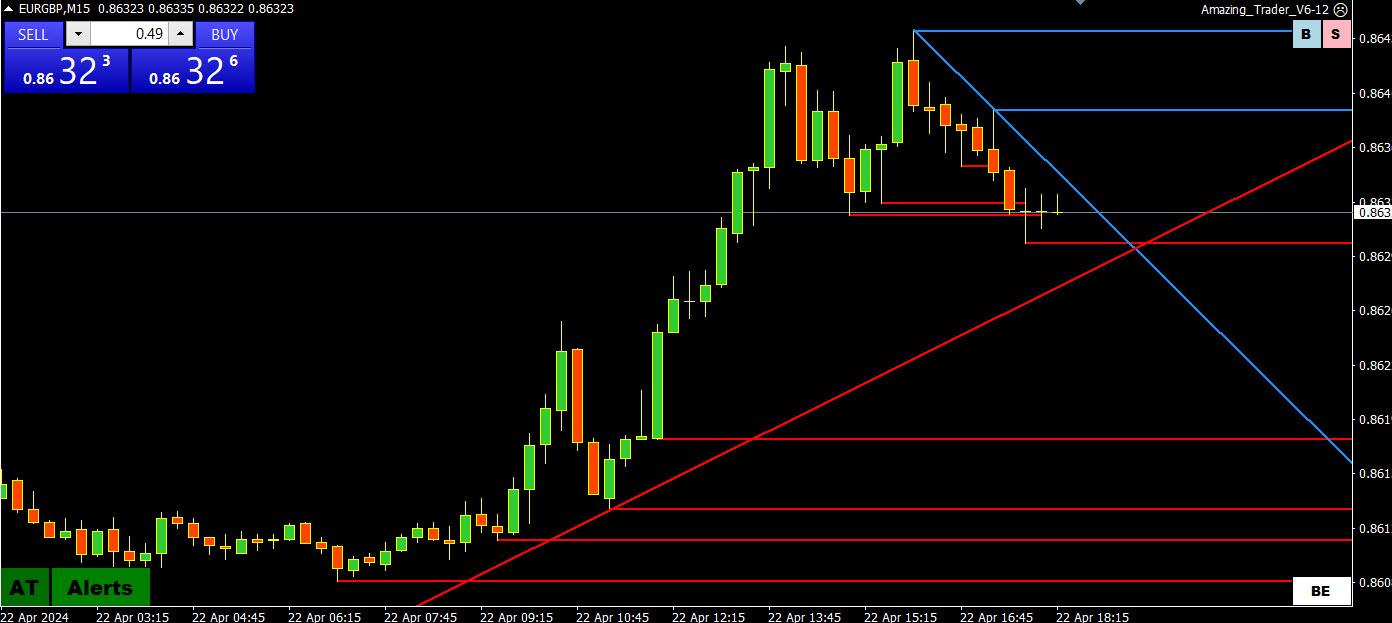
April 22, 2024 at 9:55 am #4994April 22, 2024 at 9:47 am #4993EURGBP DAILY CHART – BREAKOUT MODE
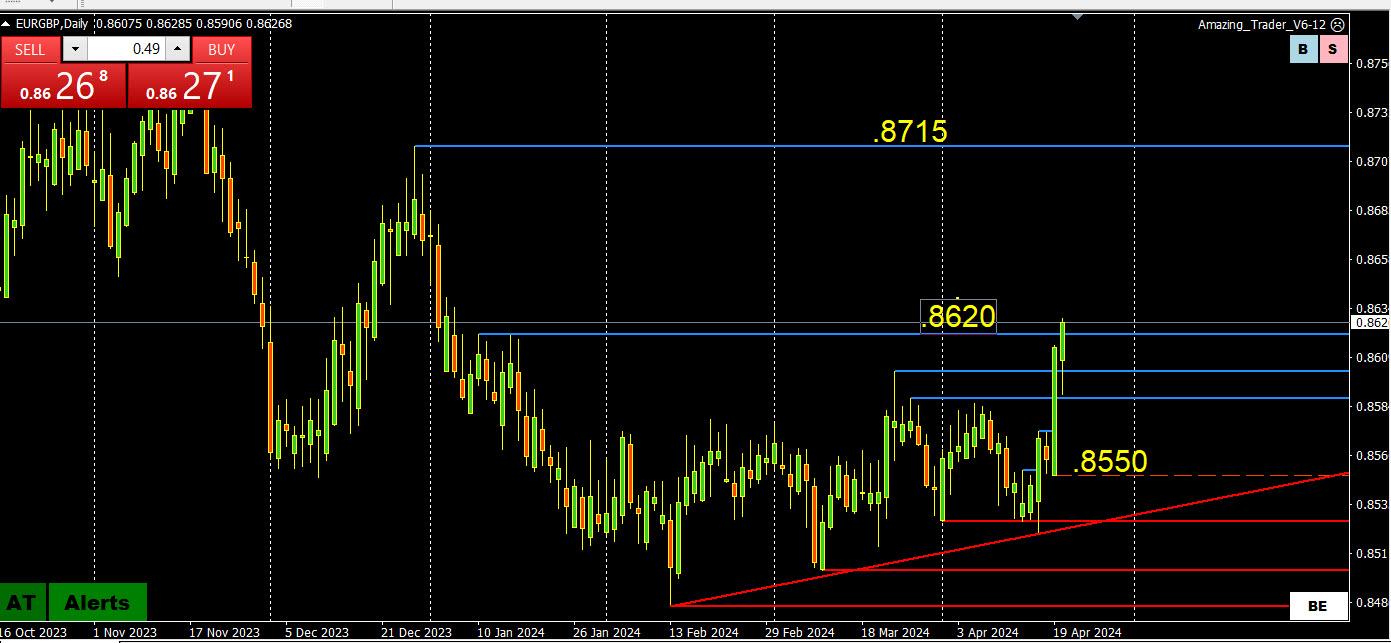
The key level on this chart is .8715, now needing to hold the,8620 break to expose it.
On the downside, it keeps a risk on the upside as long as it stays above .8550, stronger while above the.8585 breakout level.
Even if you don’t trade EURGBP you can use it as a clue to trade GBPUSD and EURUSD as I explain in
‘
‘How you Can Use Currency Crosses to Trade Spot ForexApril 22, 2024 at 9:47 am #4992Knez Belgrade
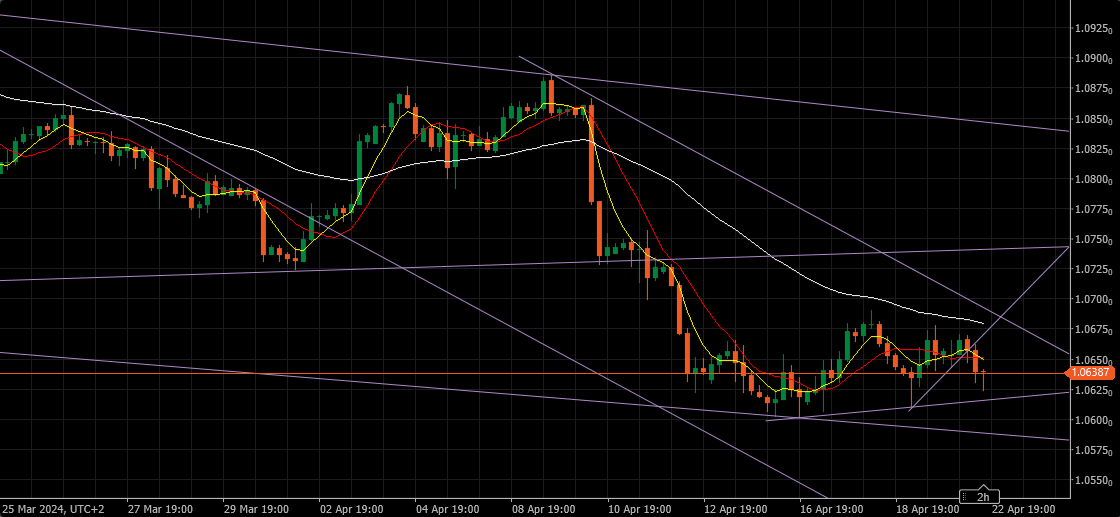
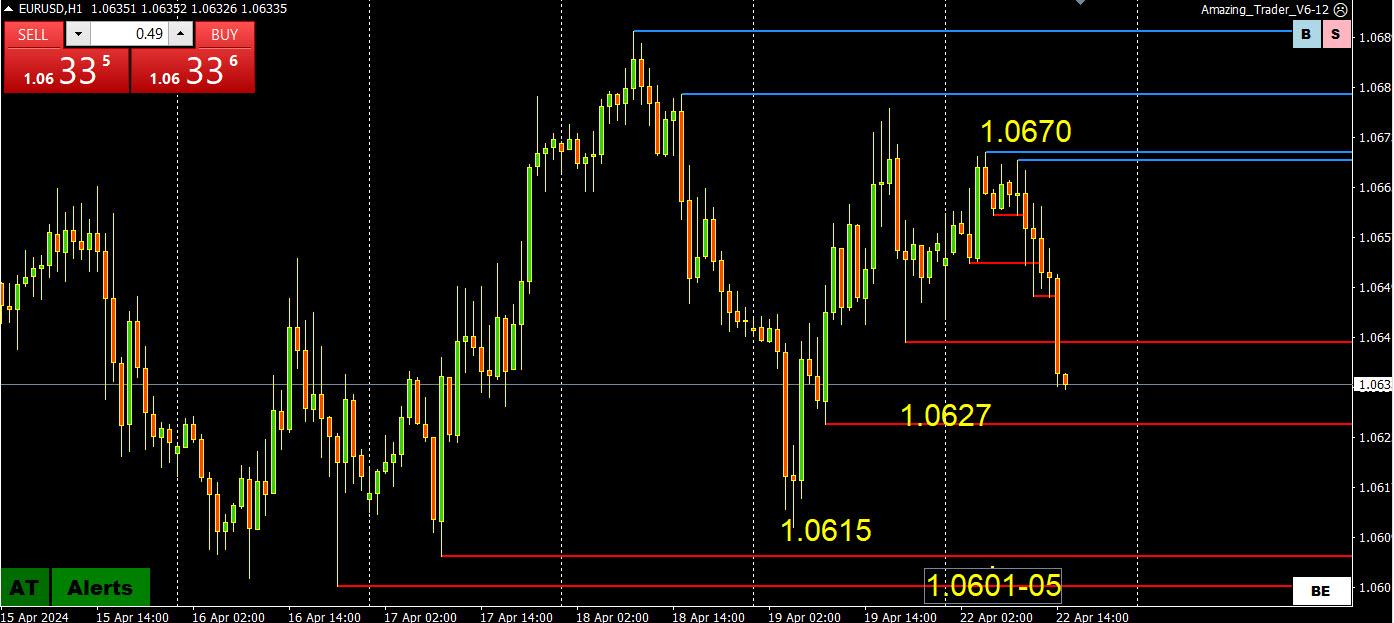
Amman, on the 3rd of April you wrote that the price would go to 1.0666 if stays below 1.0760……after you wrote it, the price went up to 1.0885 …..so how is this a good call please?
Just for your information, the price did not close below 10760 before rising to 10885 so where is the problem?
April 22, 2024 at 9:40 am #4991GBPUSD WEEKLY – HOW LOW CAN IT GO?
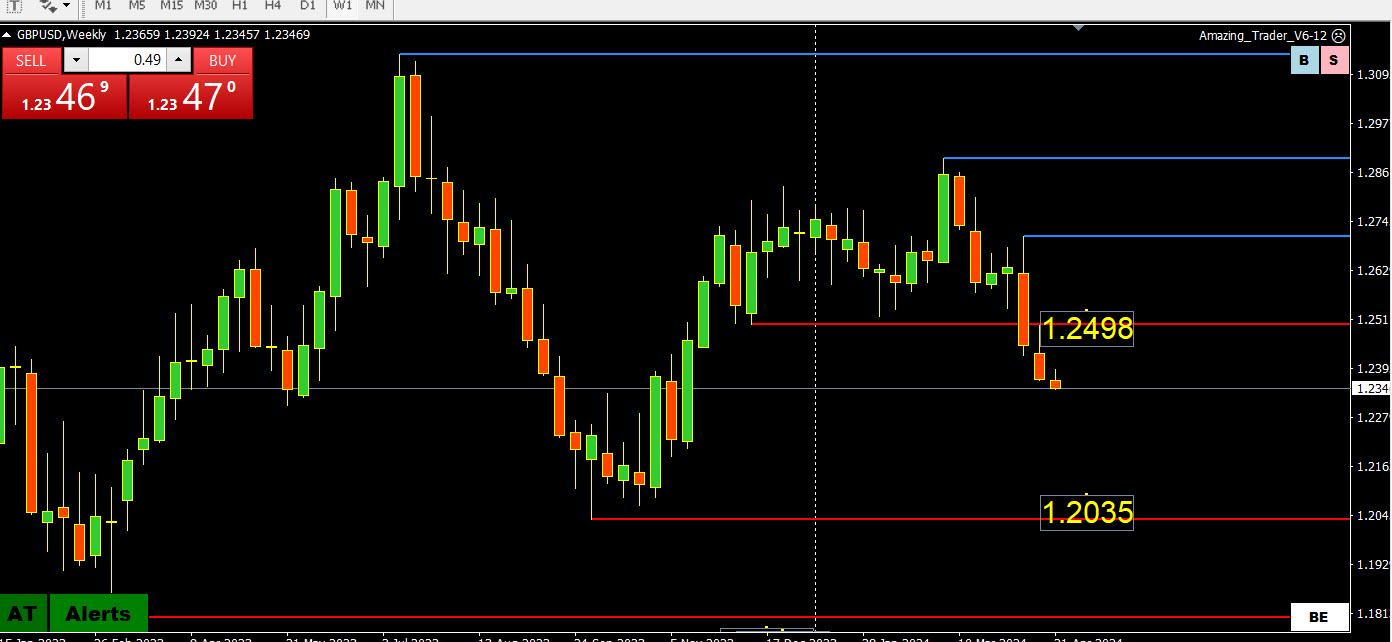
I had to go to the weekly chart to find the next key level that is not until 1.2035.
That may be a reach as it would imply a much stronger dollar but that is what this chart shows following the break of 1.2499
If trading the GBPUSD, keep an eye on EURGBO as this was the flow that sent it lower on Friday.
‘
.April 22, 2024 at 9:40 am #4990April 22, 2024 at 9:37 am #4989April 22, 2024 at 8:43 am #4984AS TRADERS, SHOULD WE WORRIED THAT WE WILL BE REPLACED BY AI AND BOTS?
THIS QUESTION IS DEALT WITH IN THIS INSIGHTFUL BLOG ARTICLE POSTED OVER THE WEEKEND.
 April 22, 2024 at 8:39 am #4982April 22, 2024 at 8:37 am #4981
XAUUSD 4 HIUR CHART — CONSOLIDATION OR CORRECTION?
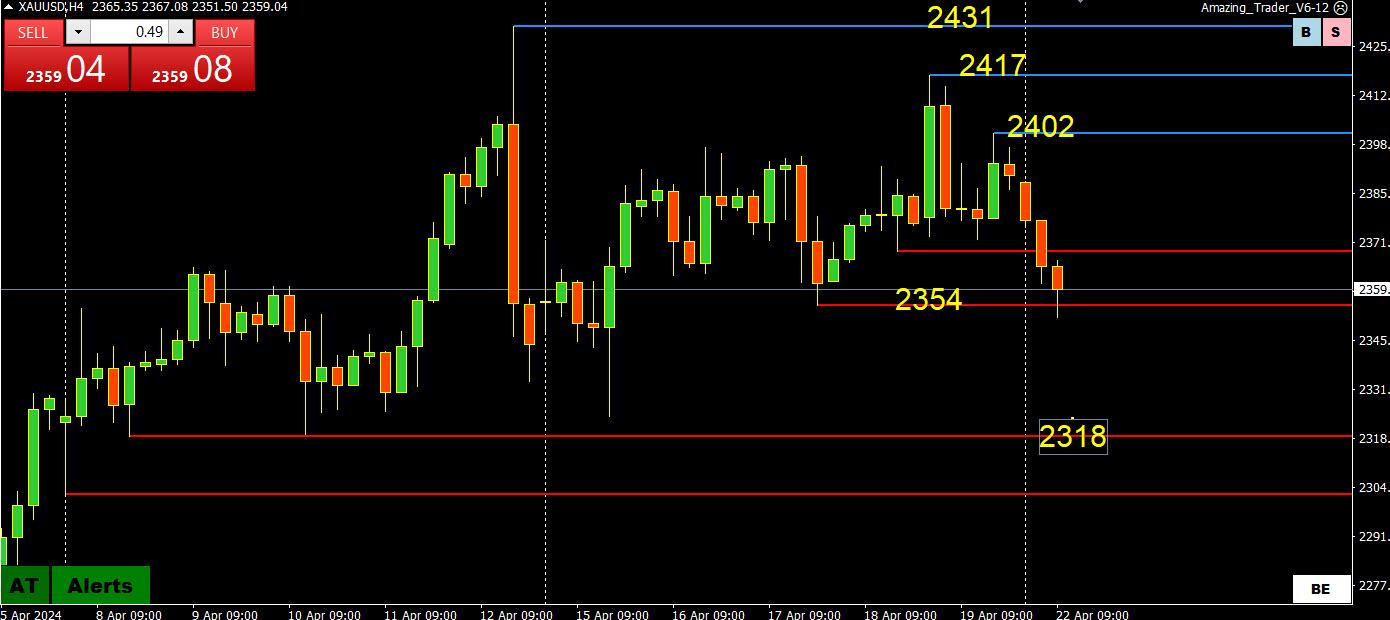
I have asked this question before and the jury is still out although technicals are tiled towards correction as long as it stays below 2402.
With that said, the key level remains untouched at 2318. To put it at risk, a move below 2350 would be needed (the low of the day so far is at 2351).
April 22, 2024 at 8:28 am #4980April 22, 2024 at 7:33 am
wfakhoury AmmanApril 3, 2024 at 8:21 am
wfakhoury AmmanEURUSD
NOW 10766
10757 confirmed will be reached
10760 is the consolidation level; buy below it, sell above it, and tp at it.
10666 confirmed will be reached if it keeps below 10760.
_____________________
Proved——————————————————————
Amman, on 3rd of April you wrote that price will go to 1.0666 if stays below 1.0760……after you wrote it, price went up to 1.0885 …..so how is this good call, please?
also you always say your signal are valid for about 48 hours …. this is like 20 days later!!!!!!
April 22, 2024 at 8:22 am #4978April 22, 2024 at 8:15 am #4976 -
AuthorPosts
- You must be logged in to reply to this topic.
Search
© 2024 Global View