
- This topic has 27,546 replies, 54 voices, and was last updated 8 hours, 24 minutes ago by GVI Forex 2.
-
AuthorPosts
-
April 23, 2024 at 1:50 pm #5070April 23, 2024 at 1:49 pm #5069April 23, 2024 at 1:25 pm #5068
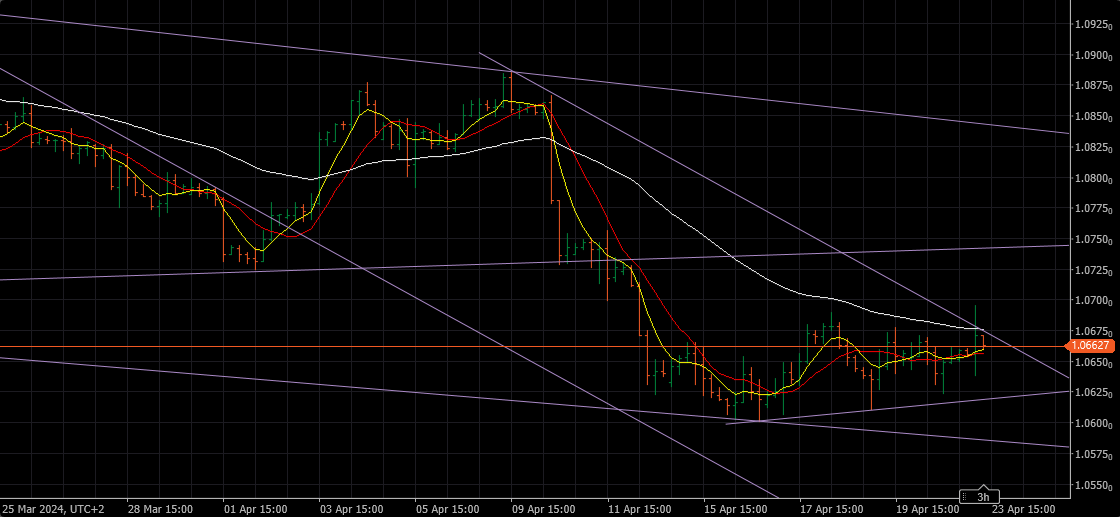
EURUSD 1 HOUR CHART – DATA/NEWS DRIVEN MARKET
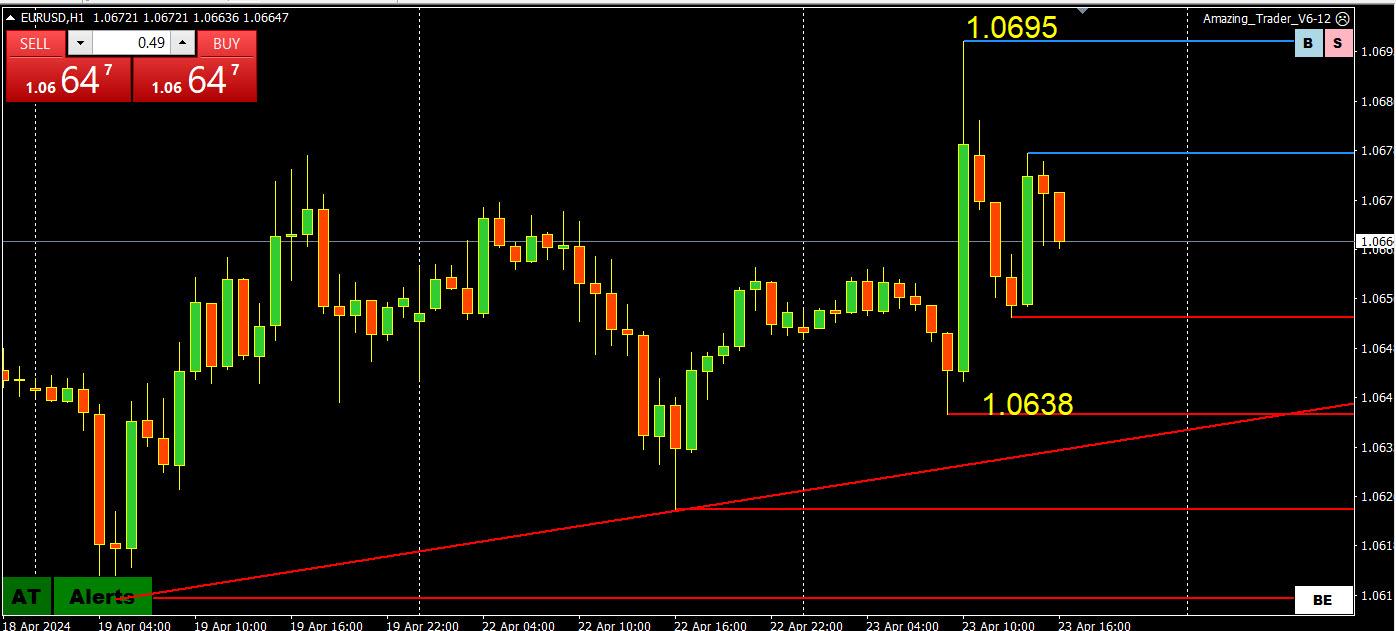
I am posting this chart to illustrate how hyper-sensitive the market is to any data that might change interest rate cut expectations.
The spike up on this chart came after the flash Ez PMI earlier.
This is why you need to be in touch with what news is coming out and the consensus forecasts.
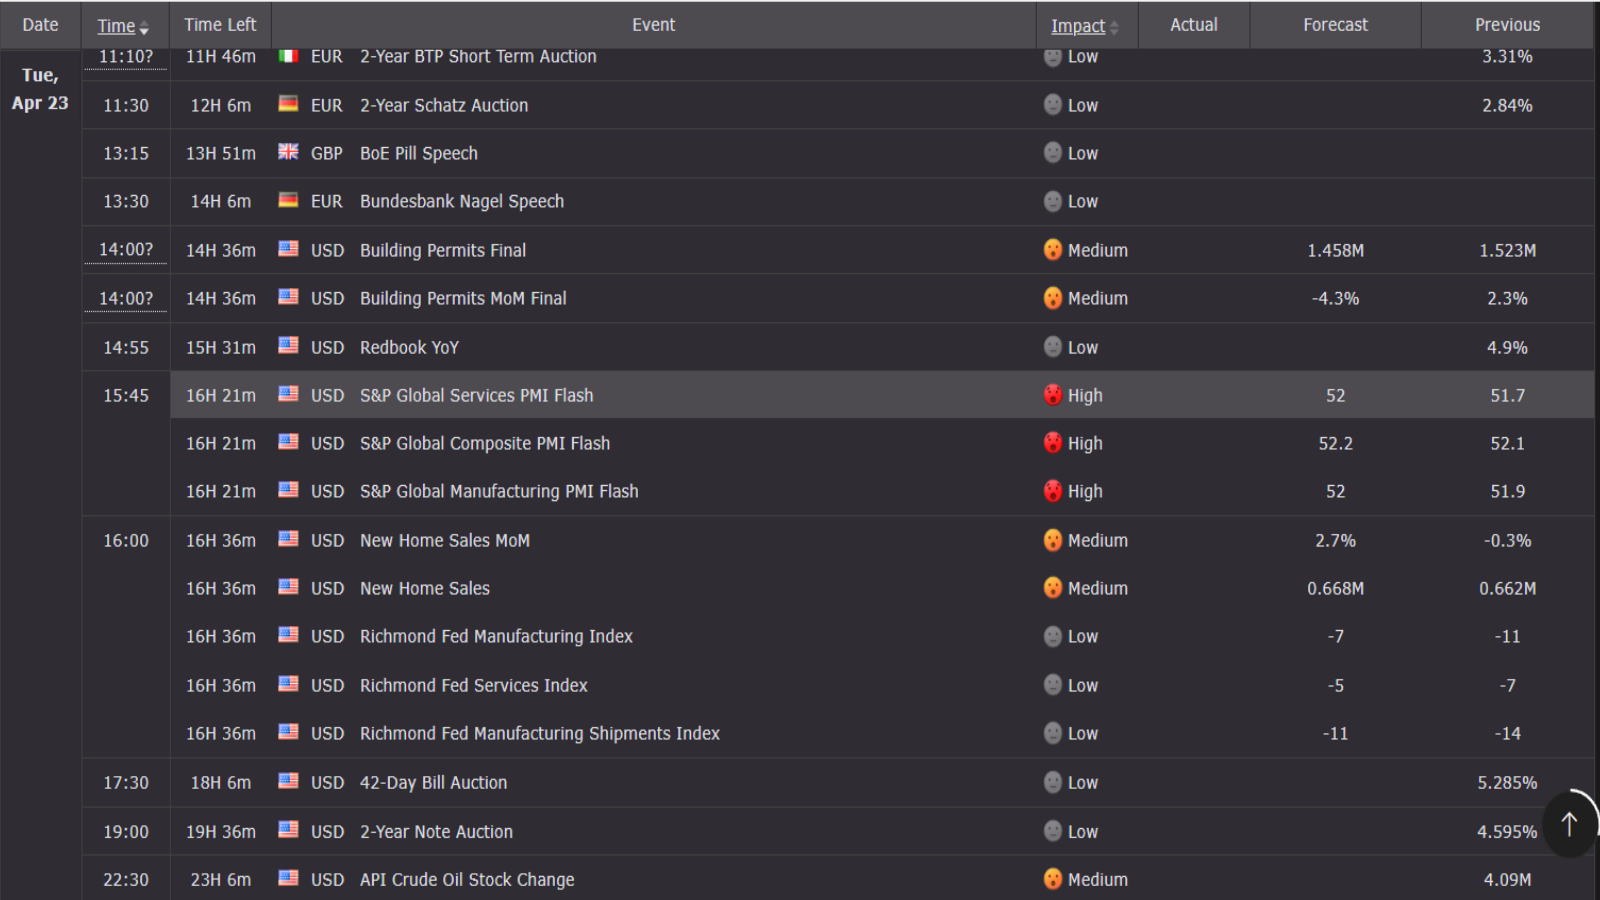
April 23, 2024 at 1:24 pm #5067April 23, 2024 at 1:10 pm #5061Next up is the US S&P Global Services PMI Flash
In this highly sensitive data-driven world this can have an inpact although the iSM PMI is considered more important.
April 23, 2024 at 12:28 pm #5059I WAS JUST ASKED HOW TO IDENTIFY THE PATH OF LEAST RESISTANCE. IT IS ALL EXPLAINED IN THIS BLOG ARTICLE
Jay Meisler’s Common Sense Trading: How You Can Identify the Path of Least Resistance?
April 23, 2024 at 12:07 pm #5058Thanks to Newsquawk.com for broadcasting the comments from BOE’s Pill that sent GBP higher.
As you can see it was worth sharing it on the forum.
April 23, 2024 at 12:02 pm #5057EURJPY 4 HOUR CHART – PATH OF LEAST RESISTANCE
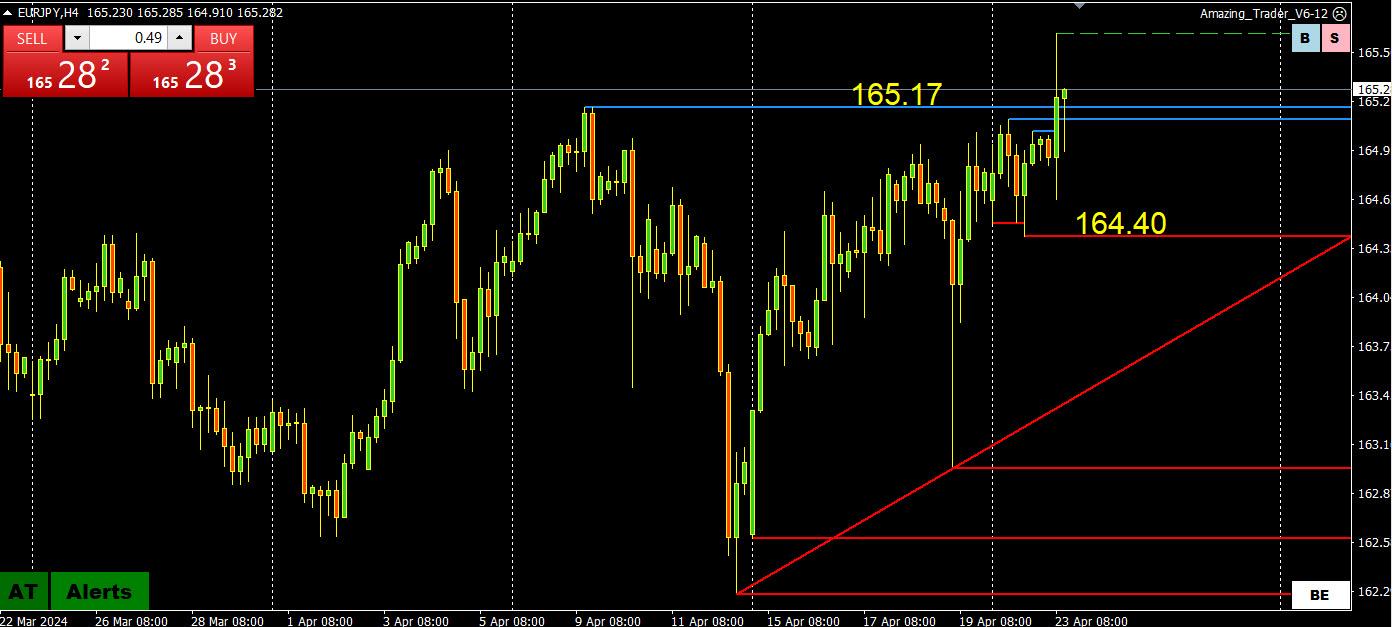
If you want to be short JPY but are worried about intervention (i.e. USDJPY 155), one way to do so is via the crosses, such as buying EURJPY.
Why?
The answer is simple. There is less likely to see intervention in a cross than in USDJPY and why I call it the path of least resistance. .
April 23, 2024 at 11:17 am #5056April 23, 2024 at 11:08 am #5055You have seen me post one of my favorite blog articles. The Power of 50. Look at current rates
GBPUSD 1.2350
EURUSD 1.0655
AUDUSD .6450 April 23, 2024 at 10:58 am #5054April 23, 2024 at 10:50 am #5053April 23, 2024 at 10:32 am #5052
A look at the day ahead in U.S. and global markets from Mike Dolan
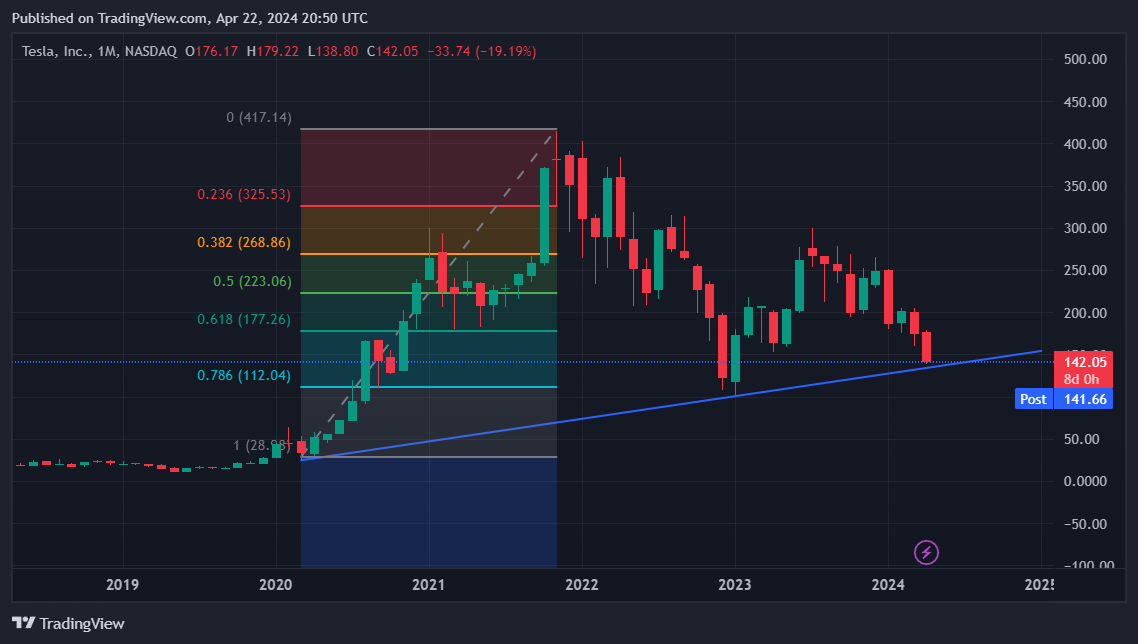
World markets have cheered up a bit this week, but ailing Tesla’s (TSLA.O), opens new tab tanking stock price faces a critical earnings test later on Tuesday and this month’s European business pulse proved surprisingly racy.
Relief at cooling Middle East tensions helped steady the ship on Monday after the worst week on Wall Street since 2022 – with bellwether chip giant Nvidia (NVDA.O), opens new tab recouping some of Friday’s 10% lunge as Big Tech megacaps get set to report first quarter updates over three days of a heavy earnings diary.
April 23, 2024 at 10:24 am #5051GBPUSD 30 MINUTE CHART -1.23-1.24
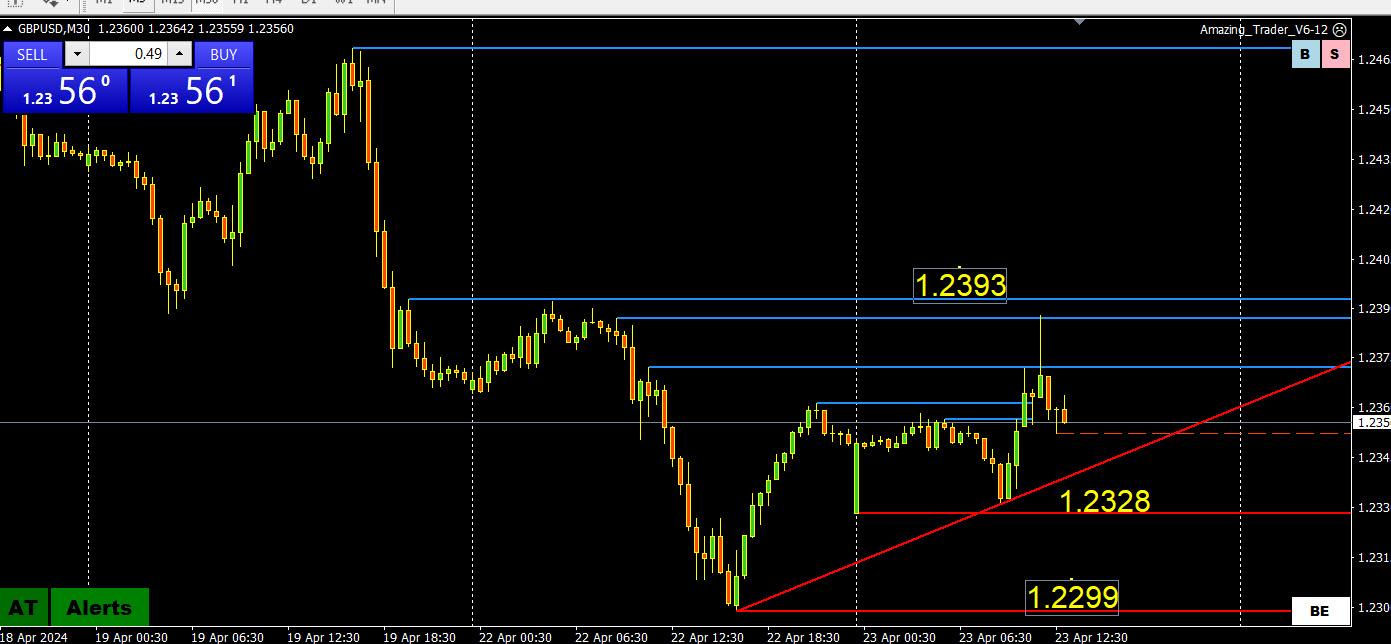
GBPUSD getting a pop from its flash PMI but not enough to take out 1.2399
This leaves GBPUSD consolidating within 1.23-1.24
Expect a mgnetic 1.2350 to be pivotal and set its intra-day boas.
What has taken some pressure off the downside is EURGBP buying pressures easing.
April 23, 2024 at 10:16 am #5050now that congress is sending more billions worth to various parts of the world, blinken who yesterday tried to bully china’s foreign policy with respect towards russia, is heading to china on wednesday (for three days) wsj reports: “U.S. Takes Aim at China Banks Aiding Russia War Effort
Washington says Beijing’s dual-use trade has helped Moscow rebuild its war machine.”do “smart traders ignore politics” ?
April 23, 2024 at 10:05 am #5049April 23, 2024 at 9:43 am #5048April 23, 2024 at 9:07 am #5037April 23, 2024 at 1:36 am #5035April 22, 2024 at 9:48 pm #5034April 22, 2024 at 9:44 pm #5033BTW Monedge, guess you have checked out the Trading pit
Anything you would like to see there…some add ons ??? I can arange many things…know people that know people 😀
April 22, 2024 at 9:42 pm #5032April 22, 2024 at 9:40 pm #5031April 22, 2024 at 9:33 pm #5030It put a smile on my face Bobby. I can’t stand that clown Johnathan Ferro on Bloomberg, it went South as soon as he became lead in the morning, all I can stand is the Asian session in Bloomberg anymore just because of him lol. Until Chenali comes on in NY proper then its great, she is former Goldman and strong. The biggest loss I ever took was following the advice of the treasuries guy on Cnbc years ago lol. Might it be advisable to listen to them but factor in imperfection?
April 22, 2024 at 9:26 pm #5029April 22, 2024 at 9:10 pm #5028April 22, 2024 at 9:07 pm #5027Bobby – as I mentioned earlier covered calls fell off of a cliff this morning. That either amounts to everyone getting out or letting them go naked on an uphill run. If you look as the relation with spot in simple technical terms that anyone can understand, Dxy is holding with rates which supports the idea stocks are not as happy as they seem. We had a strong close on 4/11 that turned into a pump and dump lasting six days. Also S/P options did not clear Fridays high mark so not sold on the hoopla at this point.
April 22, 2024 at 8:52 pm #5026April 22, 2024 at 8:43 pm #5025April 22, 2024 at 8:28 pm #5024S&P 500 climbs nearly 1% to end the six-day losing streak
Closing changes on the day:
· S&P 500 up 0.8%
· DJIA +0.7%
· Russell 2000 +1.1%
· Nasdaq Comp +1.0%
· Toronto TSX Comp +0.3%
I had to take a look – such a hysteria that started probably with Bloomberg and then whole net took it over.
It is all in the title, isn’t it ?? Well NO !
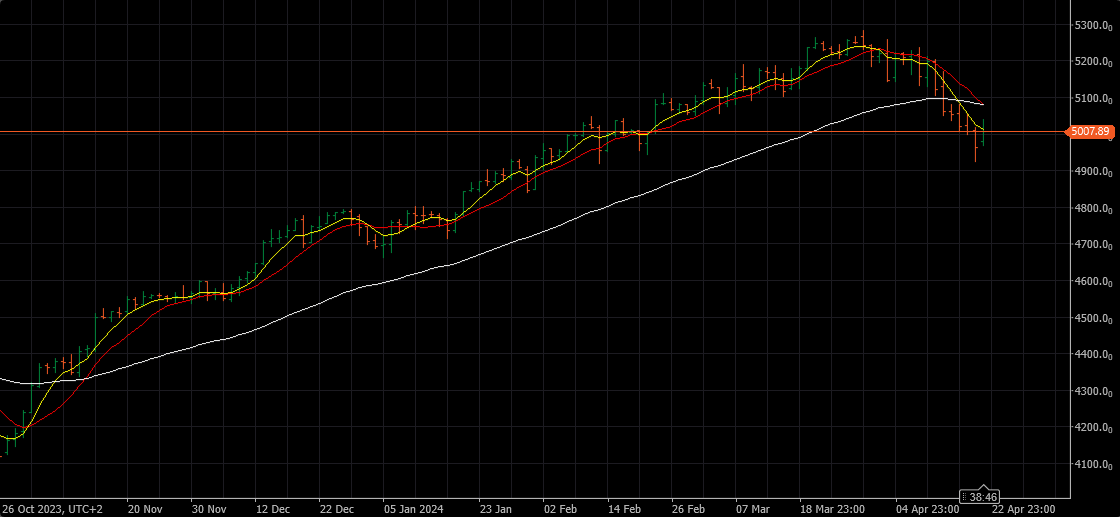
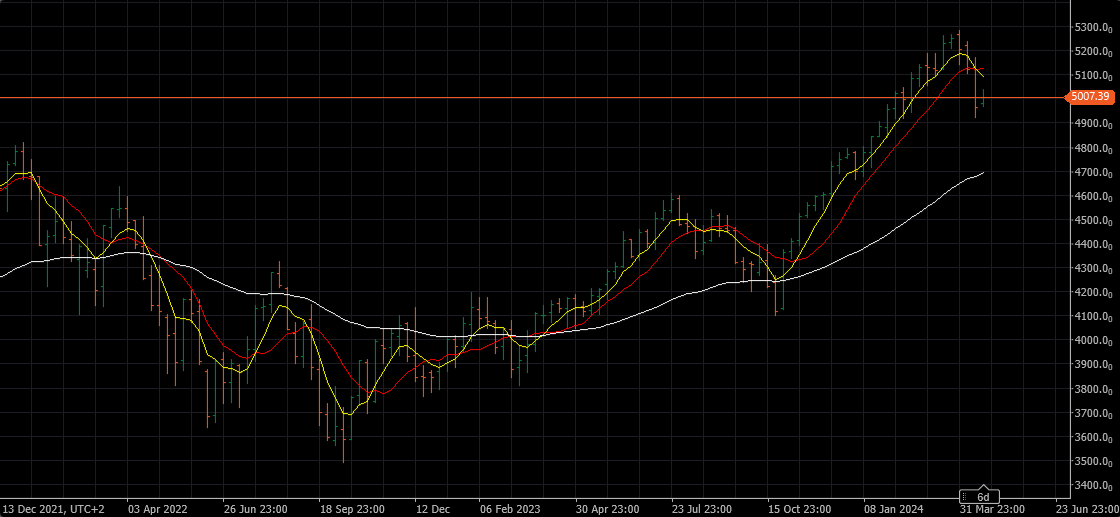
I would use some nice words to explain this , but I am warned to stay away from profanity , so I’ll just show you Daily and Weekly chart of S&P 500.
Does this look Bullish to any of you ??? Honestly….don’t be shy…
I can see the possibility to try for the double top …maybe 5.200, and then 4.600 here we come.
So much fake news, false information and paid advertisements ….
-
AuthorPosts
- You must be logged in to reply to this topic.
Search
© 2024 Global View