
- This topic has 28,112 replies, 54 voices, and was last updated 21 minutes ago by GVI Forex 2.
-
AuthorPosts
-
May 22, 2024 at 9:20 am #6619
USDX 4 HOUR CHART – PROXY FOR THE EURUSD?
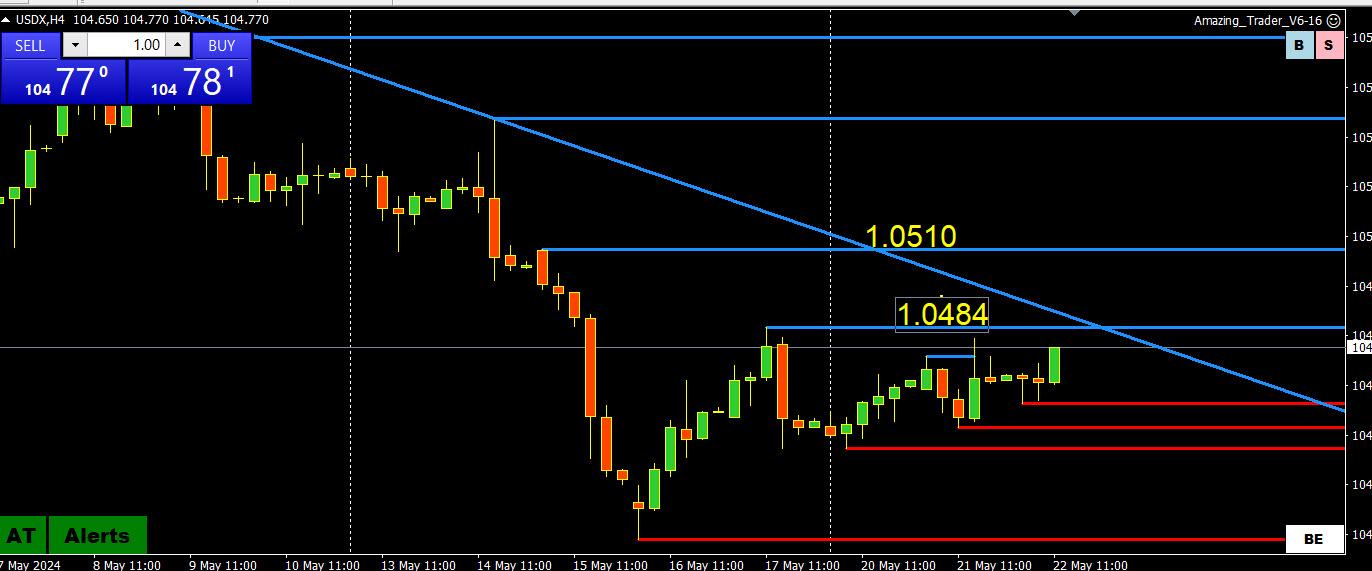
With the EURUSD representing 57.6% of the US Dollar Index (USDX), this index can at times be used as a proxy for what is seen on a EURUSD chart.
In this USDX chart, momentum is trying to build to the upside that needs to take out 105.10 to indicate an end to this latest leg to the downside.
Re EURUSD, this was posted by Michael Caif yesterday
May 21, 2024 at 8:17 pm|
michael CalifOption Profile now BEARISH Euro futures – any rallies should be sold
May 22, 2024 at 8:31 am #6618GVI 8:13
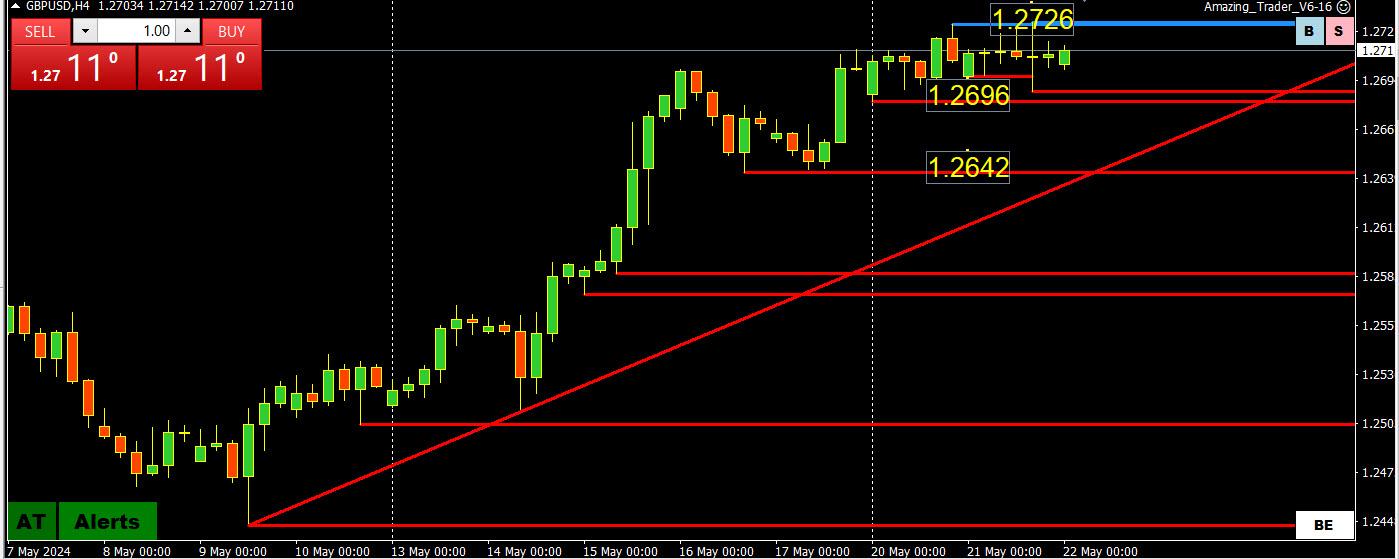
At 1.2728 GBP is now backed off 50% of reaction to earlier inflation stickiness.
—IF u d like chuckle:
IMF says BOE should cut bank rate by 50-75 bps this year
Traders are currently seeing two rate cuts for the BOE, with the first one currently baked in for August. But a move in June might be…
22 hours agoBoE will consider IMF’s call for more press conferences, Bailey says
Bank of England Governor Andrew Bailey said on Tuesday that the central bank would consider a proposal by the International Monetary Fund…
14 hours agoBoE’s Bailey: Thinks Next Move on Rates Will Be a Cut
BoE’s Bailey: Thinks Next Move on Rates Will Be a Cut BANK OF ENGLAND’S BAILEY SAYS HE WILL CONSIDER IMF RECOMMENDATION OF MORE MPC PRESS…
14 hours agoLONDON, May 21 (Reuters) – Britain’s once towering inflation rate looks set to fall close to the Bank of England’s 2% target on Wednesday,…
10 hours agoBOE Urges Markets to Prepare for Big Rise in Repo Operations
6 hours agoMay 22, 2024 at 8:24 am #6617USDCHF 4 HOUR CHART – Underperformer but resistance looms
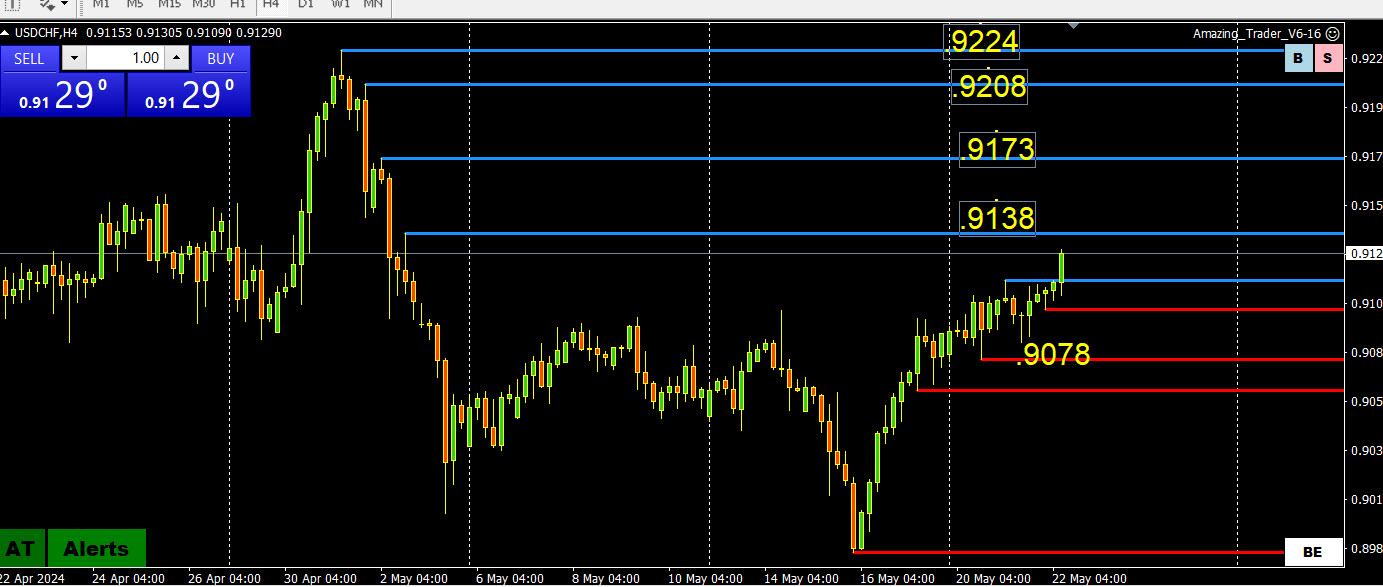
A tight range so far this week but USDCHF momentum is pointed up but faces layers of resistance until the .9224 high.
The significance of this level is it is a 4-week high, a break of which would be significant.
Expect support on dips as long as it stays above 9078
May 22, 2024 at 8:22 am #6616May 22, 2024 at 8:13 am #6615May 22, 2024 at 7:46 am #6614UK inflation falls less than expected, dashing June rate cut hopes
GBPUSD needs to hold above 1.2726 to maintain the breakout.
May 22, 2024 at 7:14 am #6613May 22, 2024 at 3:35 am #6612May 22, 2024 at 3:29 am #6611May 22, 2024 at 1:01 am #6609May 21, 2024 at 11:50 pm #6608she is back … janet is back and looking for a good old brawl
–
U.S. Seeks to Join Forces With Europe to Combat Excess Chinese Goods
Treasury Secretary Janet L. Yellen warned that China’s industrial strategy posed a global threat that requires a united response.to NYT piece
By ALAN RAPPEPORT and LIZ ALDERMANMay 21, 2024 at 10:33 pm #6601The key event overnight will be the release of UK CPI. It comes out before UK markets open and will be a test for GBPUSD’s recent strength.
Click below for a detailed preview.
 May 21, 2024 at 9:50 pm #6599May 21, 2024 at 8:17 pm #6598May 21, 2024 at 8:04 pm #6596May 21, 2024 at 7:53 pm #6595May 21, 2024 at 7:41 pm #6594
XAUUSD 4 HOUR CHART – 2400-2450 BUT FOR HOW LONG?
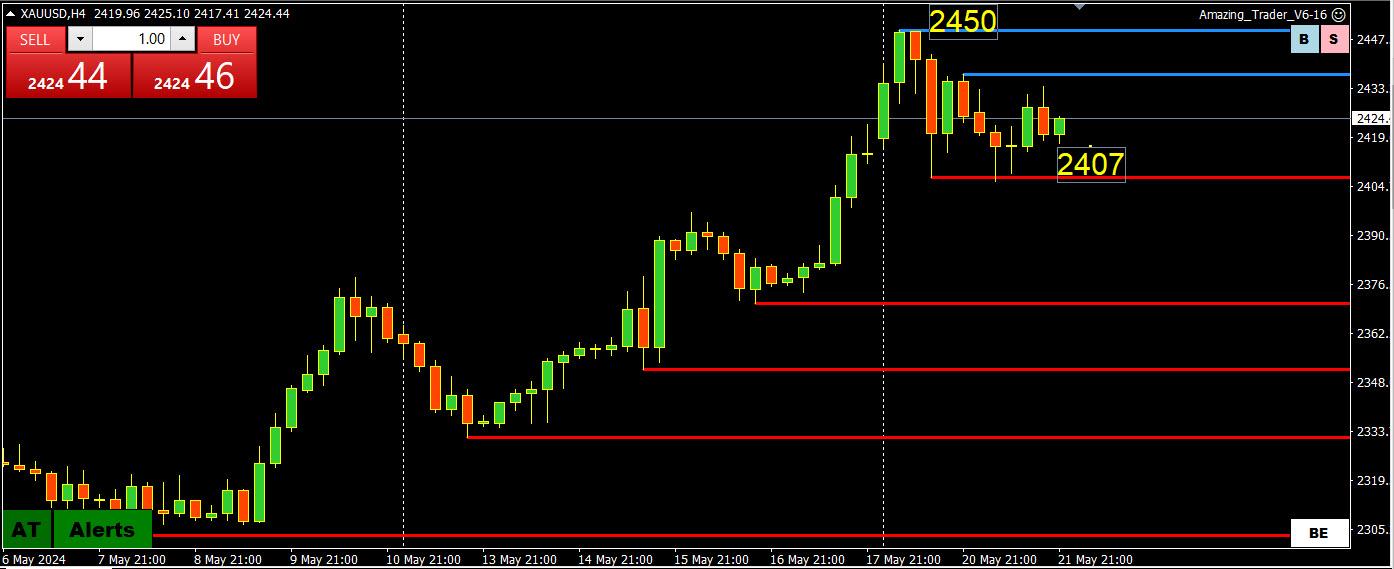
tHIS CHART IS VERY CLEAR —
2450 IS THE NEW RECORD HIGH (pOWER OF 50)
2407 IS KEY SUPPORT, IF BROKEN THE 2 BLUE AT LINES WOULD INDICATE A CHANGE IN DIRECTIONAL RISK ALTHOUGH i WOULD LOOK FOR CONFIRMATION FROM A 2400 BREAK.
OTHERWISE, XAUUSD IS JUST TAKING A BREATHER AS LONG AS IT TRADES IN 2400-2450
May 21, 2024 at 7:35 pm #6593BTC WEEKLY CHART – 11 Weeks and counting
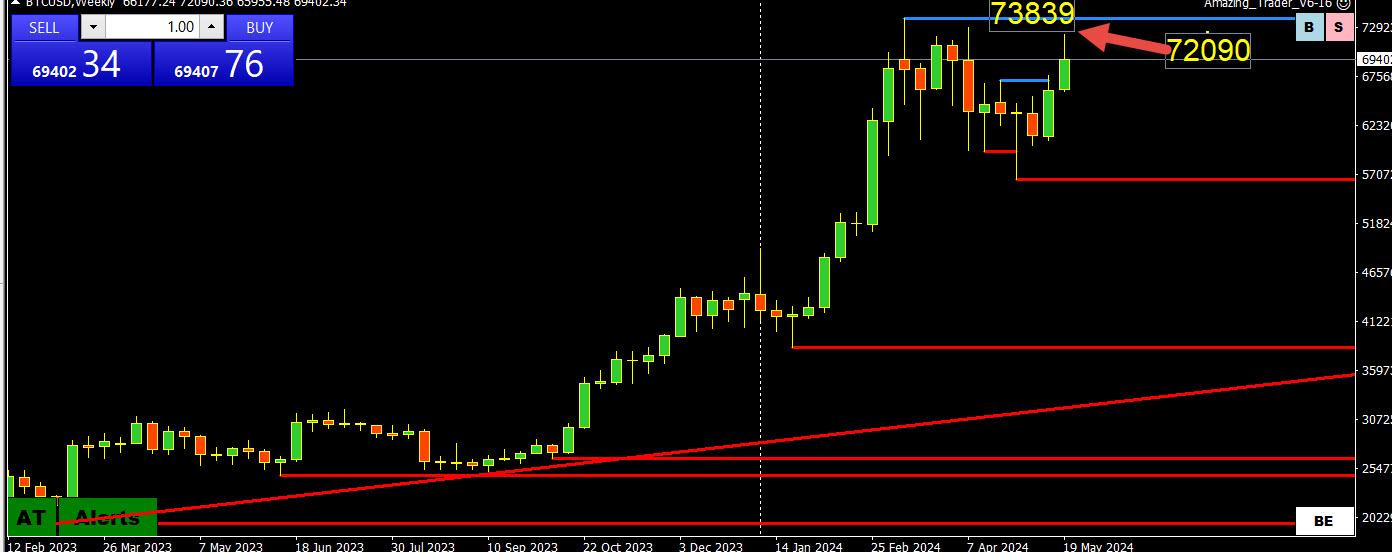
BTC made a run at its 73839 record high but stalled around 72000 and has so far been unable to sustain a move above 70000.
As I have been noting, besides the record high I prefer to look at pivotal levels like 60K, 65K, 70K/
To make a serious run at the record high 70k+ would need to become support.
Otherwise, as the chart shows, it is 11 weeks since the high was set.
May 21, 2024 at 7:07 pm #6592May 21, 2024 at 4:39 pm #6591Monedge views a lot of “internals” including those pertaining to stocks, not only in the US, to find a consensus of market flows. This morning one thing catching our attention is the Nasdaq 50 index rejecting 3 months highs. It would arguably require something strong to move Nasdaq up further this week and stick. This translates to currencies like Euro which are quite largely risk on/off motivated.
May 21, 2024 at 4:05 pm #6590May 21, 2024 at 3:47 pm #6589May 21, 2024 at 3:40 pm #6588May 21, 2024 at 3:31 pm #6587May 21, 2024 at 3:16 pm #6583May 21, 2024 at 3:00 pm #6573May 21, 2024 at 2:57 pm #6572Canada’s consumer price index
–
* cooled to 2.7 per cent in April, down from 2.9 per cent in March, led by the slower growth of food prices, Statistics Canada said Tuesday.CBC – basically a gov’t mouthpiece – says abaout the CPI:
– “The Bank of Canada’s preferred measures of core inflation also eased — a happy sign for the central bank, which will make its next interest rate decision on June 5.Many economists expect that the bank will start cutting rates at that meeting.”
May 21, 2024 at 2:52 pm #6571GVI 01:27 / illogical eh ?
BUT that is where the retail trader can game theme of what the CB suits wish to instill into player psychie and the degeree of resistance by player collective to “assimilate” or resist assimilation.
the degree of ease (or not) of assimilation to CB gang’s theme can be reflected by a few indicators such as the name of the CB interloculator, his/her clarity of insistent communication, and flow and frequency of the messaging peddlers. Reading and interpreting the FED yakkers is science of psychology and english language communication skill. That is why “they” have some alleged whisperes around like cox or kashkari or timiraos. (who, incidentally, are not perfect as messaging interpretters)
May 21, 2024 at 2:39 pm #6570The monthly average of US holdings of US Treasuries by the Federal Reserve have dropped from roughly $5.7 trillion to roughly $4.6 trillion from roughly a year on year basis. In January 2020 the holdings were roughly $2.5 trillion. There has also been significant decrease over time of foreign buyers of bonds, especially Japan and China, with Japan having been the largest foreign buyer for some time. It is a risk management approach, with the bonds being a guaranteed asset.
If I were a CTA with a long term portfolio I would be keenly watching the 4.5% mark if/when that becomes present. It would be a significant area to either shift agendas or load up depending on which side of the fence you are on.
May 21, 2024 at 2:15 pm #6569EURGBP 4 HOUR CHART – FACING KEY SUPPORT
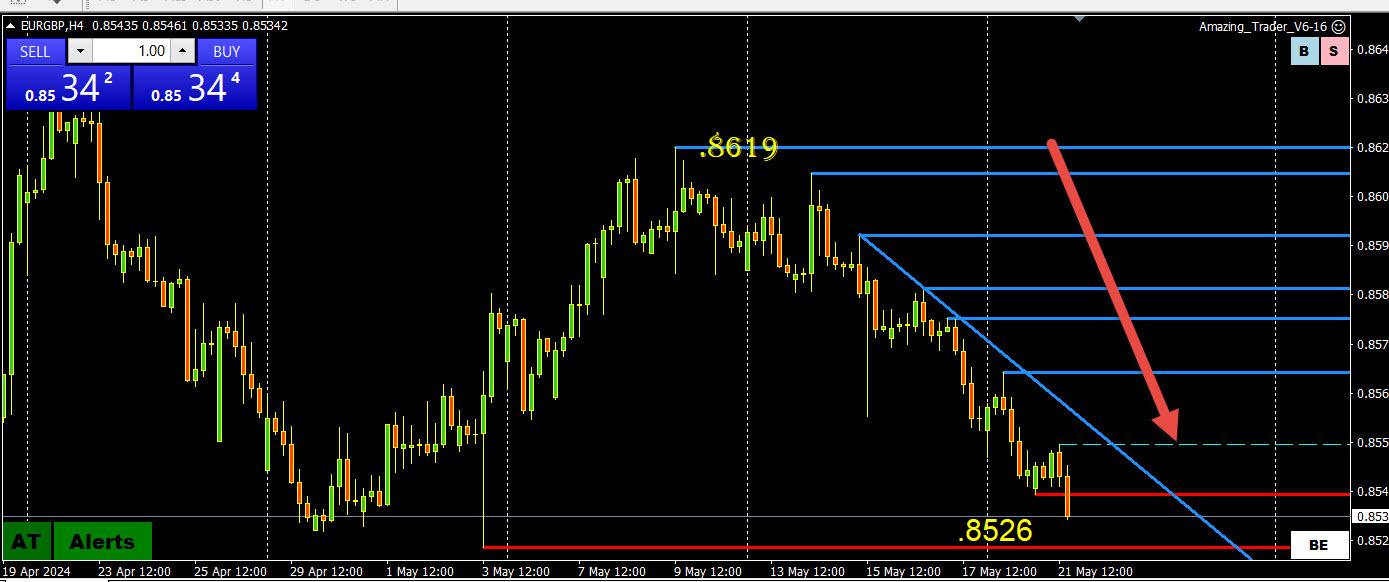
If the market was concerned about an expected sharp drop in headline UK inflation tomorrow it is showing no signs of it.
You can see by the blue AT laffer lines pointing down that EURGBP is coming in range of key support at .8526.
Key support is at .8484-.8502 below it.
Note one reason why EURUSD has been trading soft and GBPUSD bid are flows in this cross.
-
AuthorPosts
- You must be logged in to reply to this topic.
Search
© 2024 Global View