
- This topic has 27,676 replies, 54 voices, and was last updated 11 minutes ago by GVI Forex 2.
-
AuthorPosts
-
May 9, 2024 at 1:19 am #5980
GBPUSD 4-HOUR CHART – WAITING FOR BOE
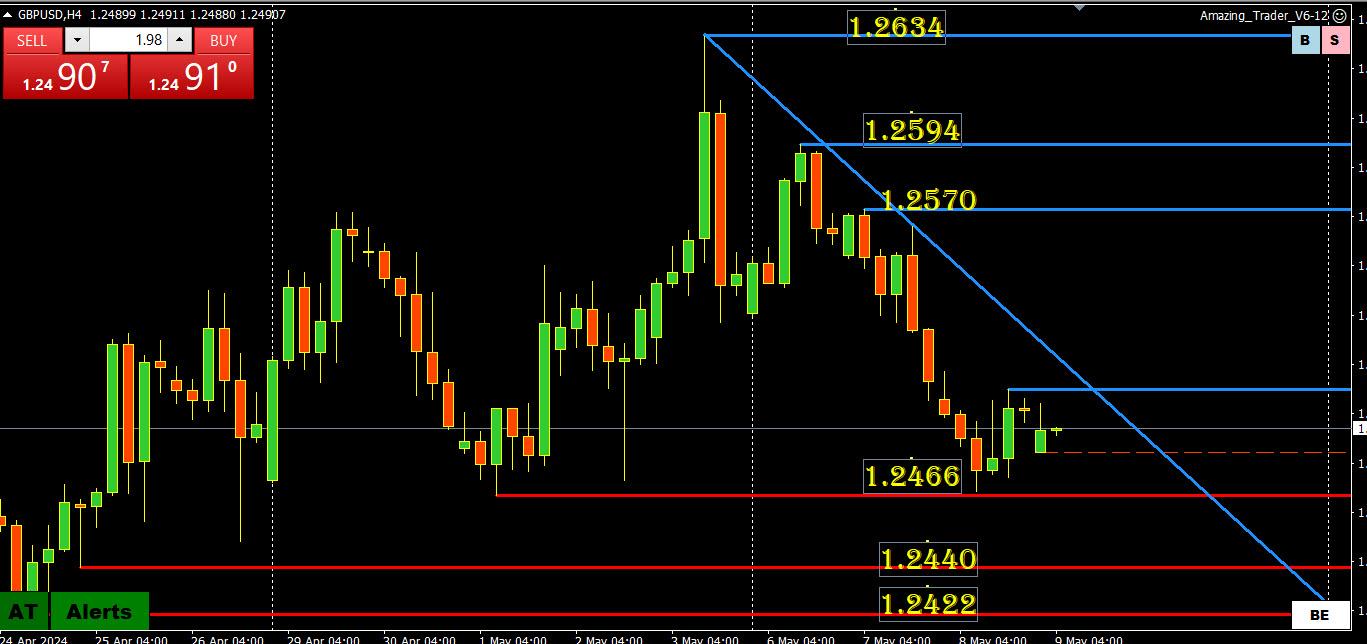
The market is expecting a dovish tilt so the surprise would be if the BOE is less dovish.
On this chart 1.2466 on the downside, the trendline and 1.2594 on the upside are levels to watch (major support is not until 1.2298.
But toss technical levels out the door and focus on 1.25 as that will dictate the tone post-BOE
May 8, 2024 at 10:27 pm #5979THE NEXT KEY EVENT IS THE BOE MEETING ON THURSDAY. BE PREPARED BY SEEING THE FULL PREVIEW AND ANALYSIS.
 May 8, 2024 at 10:20 pm #5978May 8, 2024 at 8:16 pm #5971May 8, 2024 at 8:09 pm #5970May 8, 2024 at 7:58 pm #5969May 8, 2024 at 6:47 pm #5965
Jay – 10yr is at 4.46+ with a flat curve (mis-typed, working fast), curve is at 3.51 a year ago,, it means the curve is a higher but bit flat right now. 2yr curve is declining at 4.84 from 3.99 a year ago. So near term yields (especially monthly) are declining, the 10 is flat, the 15-20-30 are all moving up. So the market is pricing in higher yields further out, with a stagnant mid-term, and a declining near term. If I got it right.
May 8, 2024 at 6:22 pm #5964May 8, 2024 at 6:20 pm #5963May 8, 2024 at 5:54 pm #5962Since its slow:
Just a note – The 6month yield is essentially flat at 5.06% and the 10yr is essentially flat at 3.51 on the yield curves. The only ones with a positive curve are the 15yr, the 20 yr, and the 30yr if I am reading the numbers correctly. I would love to hear from some of the viewers out there who never comment about what they think of that.
May 8, 2024 at 5:28 pm #5961May 8, 2024 at 5:25 pm #5960May 8, 2024 at 5:12 pm #5959May 8, 2024 at 4:35 pm #5958May 8, 2024 at 4:27 pm #5957USDCHF 5-MINUTE CHART – CHOICE OF TIME FRAMES
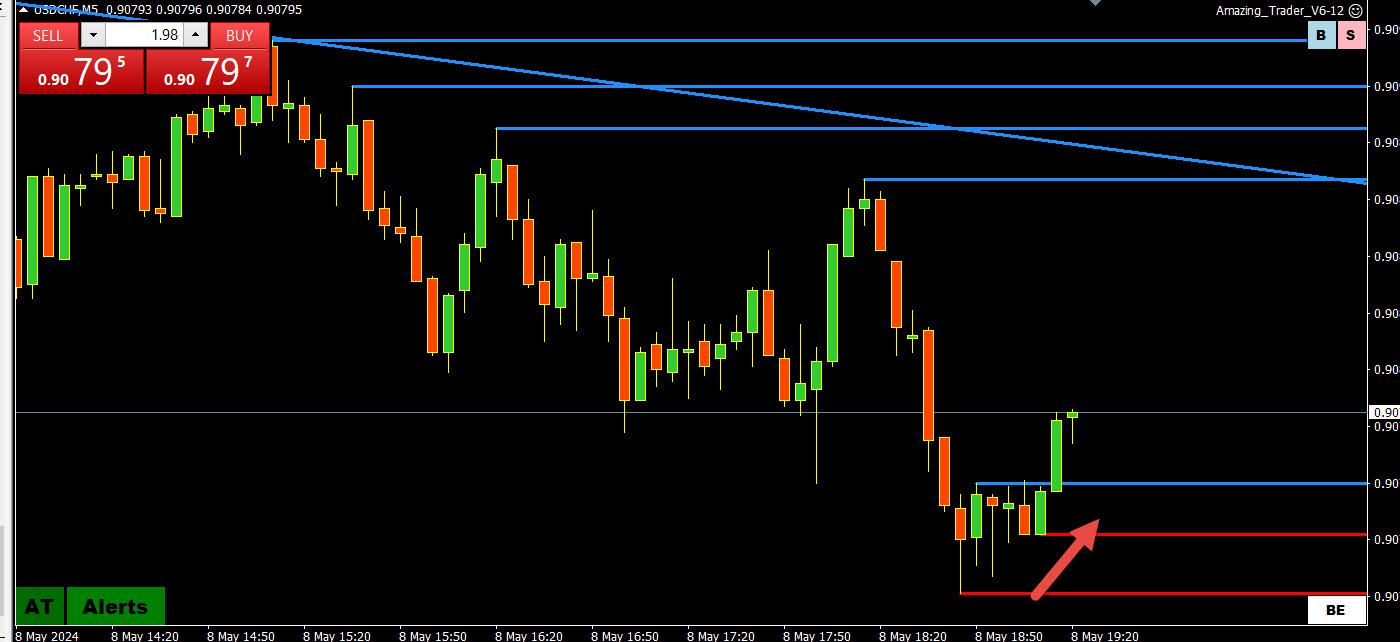
I like to look at whatever time frame chart is tracking a market the best, especially when there is a trend.
Today I have found using 5-minute AT charts to identify changes in direction in what has been a range day since I came in
So here is one for you JP, which indicates a potential directional shift with the target at ..9088.
Reminder this is a 5 minute chart and directional shift patterns are better seen on 15 and 30-minute charts. but 5 minute has been working today.
May 8, 2024 at 3:52 pm #5956May 8, 2024 at 3:44 pm #5955This is a very timely article as USDJPY trades higher and the BoJ lurks
A Warning for Forex Traders; Don’t Count on a Central Bank to Protect Your Trade
A Warning for Forex Traders; Don’t Count on a Central Bank to Protect Your Trade
May 8, 2024 at 3:42 pm #5954May 8, 2024 at 3:41 pm #5953May 8, 2024 at 3:39 pm #5952May 8, 2024 at 3:17 pm #5951May 8, 2024 at 3:02 pm #5950May 8, 2024 at 3:02 pm #5949May 8, 2024 at 2:54 pm #5948XAUUSD 5 MINUTE CHART – MID RANGE?

I was just asked if XAUUSD was a sell. First, I do not trade it so I can only speak from what I see on charts.
‘
If you scroLL down to my post on XAUUSD, I cited the range at 2300-2332. ‘So ask yourself whether you want to sell mid-range with the low likely in for the day unless it is just a scalp short against the blue AT lines. ..
May 8, 2024 at 2:47 pm #5947AUDUSD 5 MINUTE CHART – AT LADDER PATTERN

AUDUSD bouncing off its low as commodity currencies get a lift.
I am using this 5-minute chart to show how The Amazing Trader works with all instruments in all time frames.
We prefer using 15 or 30-minute charts for directional indicator patterns but in a quiet day like today, the 5-minute gave an early sign of a potential change in direction (as long as the low stayed intact).
Note the rising red lines are called an AT Ladder pattern.
May 8, 2024 at 2:42 pm #5946DLRx 105.40
right on Resistancepuppy seems to be trading selectively amongst its components but as a whole instrument currently has little steam in the vatt to push it higher.
altho the grander scheme of things it is the euro that will – when it happens – see a cut first . In the meantime it ll probably need see a move up in yields to get some live.
three fed yakkers on deck still to yak and janet’s dept at
13:00 peddles off 42 billion of 10-yr paperMay 8, 2024 at 2:26 pm #5943May 8, 2024 at 2:25 pm #5942May 8, 2024 at 2:08 pm #5941XAUUSD 1 HOUR CHART – OFFERED OR OFFERED IN A BID MARKET]

One hour chart showing a downside risk but failure to test 2300, which guards key levels at 2291 and 2277, raises the question of whether XAUUSD is offered or just a case of trading offered in a bid market.
The jury is out on this while it trades between 2300-32.
May 8, 2024 at 1:14 pm #5940THIS IS A GOOD TEST FOR ANY DAY TRADER.
LOOK AT THE EURUSD AND SEE HOW YOUR EMOTIONAL BIAS CHANGES WHEN IT IS TRADING ABOVE AND BELOW THE 50 LEVEL (1.0750).
FOR THOSE WHO HAVE NOT READ THIS POPULAR BLOG ARTICLE OR WANT TO TAKE A LOOK AGAIN
MY FAVORITE TRADING SECRET: THE POWER OF THE “50” LEVEL

-
AuthorPosts
- You must be logged in to reply to this topic.
Search
© 2024 Global View