
- This topic has 28,429 replies, 54 voices, and was last updated 3 minutes ago by GVI Forex 2.
-
AuthorPosts
-
September 19, 2024 at 9:49 am #11841September 19, 2024 at 9:15 am #11840September 19, 2024 at 9:02 am #11839
XAUUSD 4 HOUR CHART –
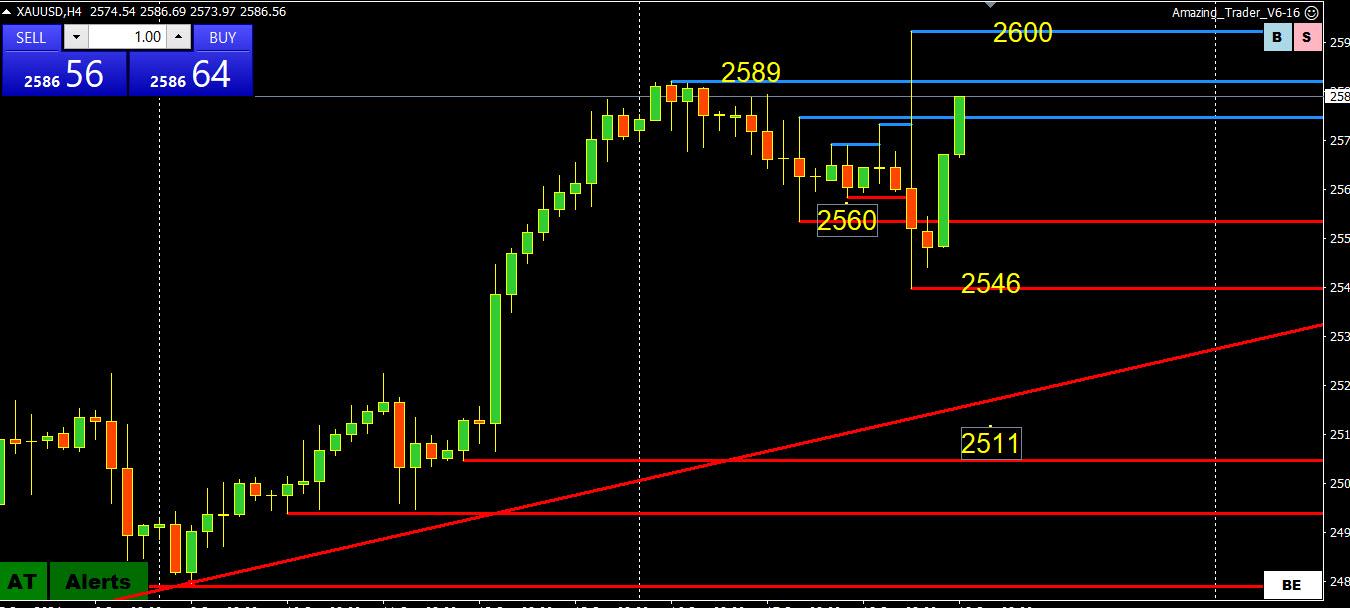
Looking at this chart, clear out the broken lines and it is 2500-2600 (record high), upside exposed as long as it stays above 2550.
To repeat what I posted yesterday:
XAUUSD extended its record high BUT THEN HIT A WALL AT 2600.
Look for support as long it trades above 2500-11 but unlike recent days, there are no stops to go for on the upside unless 2600 is taken out.
If it trades between 2500-2600, then 2550 will set its intra-day bias.
September 19, 2024 at 8:47 am #11838September 19, 2024 at 12:57 am #11837September 19, 2024 at 12:26 am #11836September 19, 2024 at 12:09 am #11835It may be different this time, of course, but the average one-year stock market return after the first Fed rate cut is almost 5% even when a recession occurs. And it’s more than 16% when the cuts come without a recession materialising at all – the most likely scenario now facing investors.(From Reutets article linked to earlier)
September 18, 2024 at 9:05 pm #11834September 18, 2024 at 8:55 pm #11833September 18, 2024 at 8:42 pm #11832September 18, 2024 at 8:41 pm #11831XAUUSD 4 HOUR CHART- Post FOMC Whipsaw
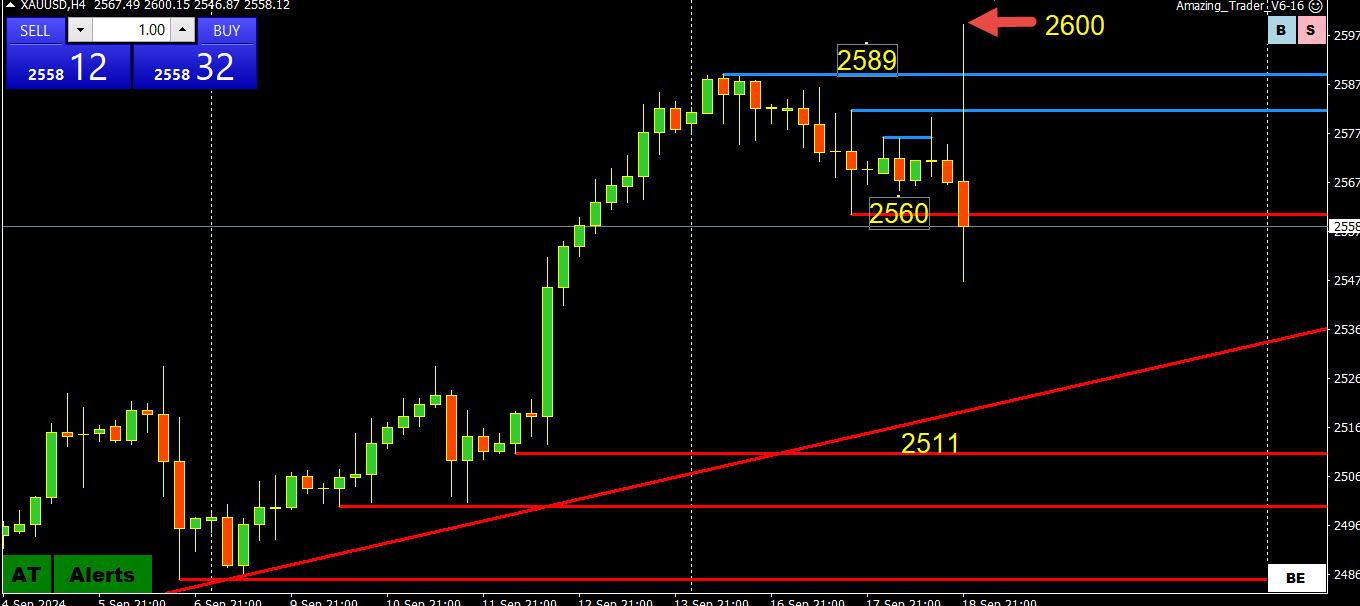
XAUUSD extended its record high BUT THEN HIT A WALL AT 2600.
Look for support as long it trades above 2500-11 but unlike recent days, there are no stops to go for on the upside unless 2600 is taken out.
If it trades between 2500-2600, then 2550 will set its intra-day bias.
September 18, 2024 at 8:35 pm #11830NAS100 DAILY CHART – 20k OR BUST?
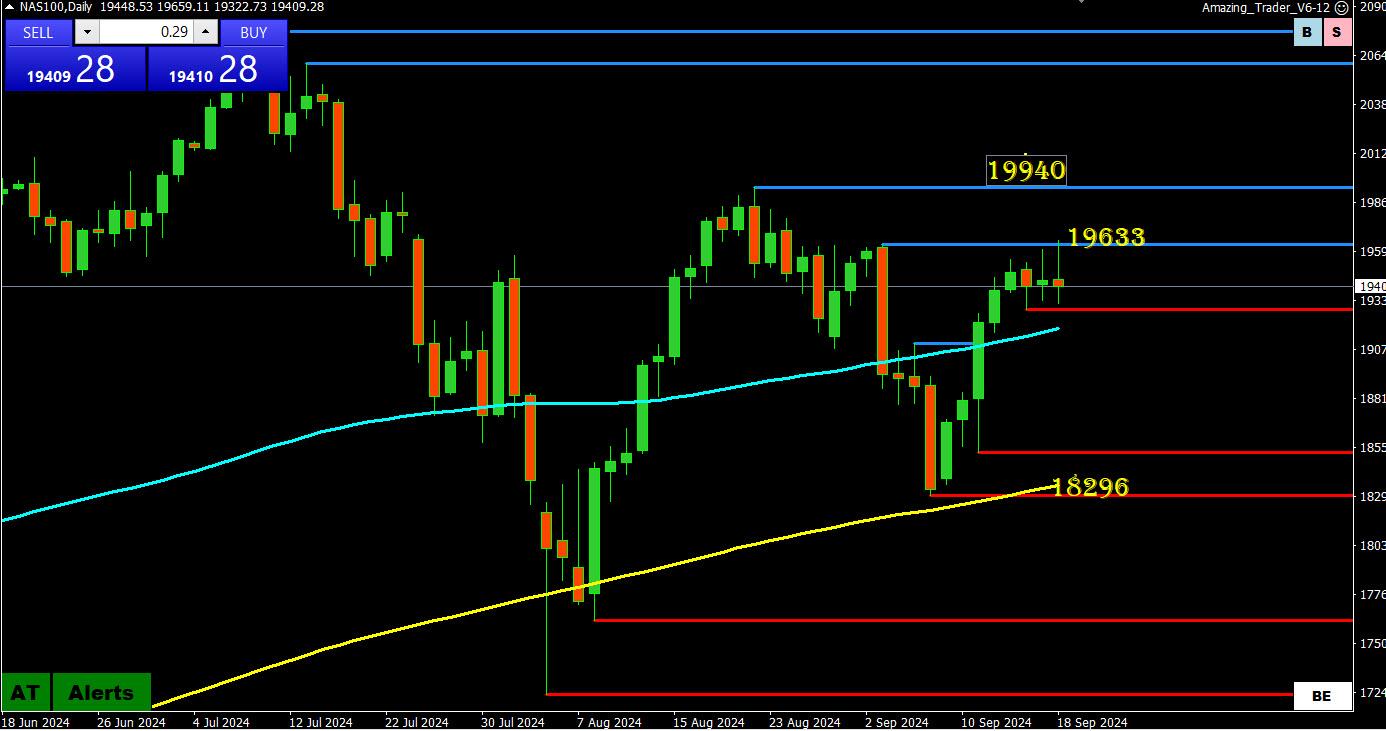
NAS100 finding support by holding above its 200 day mva (yellow) and moving back above its 100 day mva (blue).
On the upside, key resistance is close enough to 20,000 to use this as the level that would need to be taken out to suggest the record high is in play again.
September 18, 2024 at 8:30 pm #11829September 18, 2024 at 8:00 pm #11828September 18, 2024 at 7:51 pm #11827September 18, 2024 at 7:24 pm #11826September 18, 2024 at 7:14 pm #11825September 18, 2024 at 7:06 pm #11824September 18, 2024 at 7:00 pm #11823September 18, 2024 at 6:41 pm #11822September 18, 2024 at 6:23 pm #11821September 18, 2024 at 6:06 pm #11820September 18, 2024 at 6:04 pm #11819September 18, 2024 at 6:01 pm #11818September 18, 2024 at 6:00 pm #11817September 18, 2024 at 5:58 pm #11816AnonymousSeptember 18, 2024 at 5:52 pm #11815September 18, 2024 at 5:48 pm #11814AnonymousSeptember 18, 2024 at 5:39 pm #11813Technically the strongest way to approach days like this is with option contracts but you really need to know what you are doing and not even think for a second some guru on youtube or tiktok thinks they know what they are doing. That includes the various “signal service” sites on the net. I have met some of them in my travels and they are cast offs, some who worked in a bank for a while, who could not even sniff what it really means to know what you are doing or match the professionals I have dealt with. Use your heads people.
September 18, 2024 at 5:36 pm #11812 -
AuthorPosts
- You must be logged in to reply to this topic.
Search
© 2024 Global View