
- This topic has 28,109 replies, 54 voices, and was last updated 2 hours, 17 minutes ago by GVI Forex 2.
-
AuthorPosts
-
September 18, 2024 at 6:41 pm #11822September 18, 2024 at 6:23 pm #11821September 18, 2024 at 6:06 pm #11820September 18, 2024 at 6:04 pm #11819September 18, 2024 at 6:01 pm #11818September 18, 2024 at 6:00 pm #11817September 18, 2024 at 5:58 pm #11816AnonymousSeptember 18, 2024 at 5:52 pm #11815September 18, 2024 at 5:48 pm #11814AnonymousSeptember 18, 2024 at 5:39 pm #11813
Technically the strongest way to approach days like this is with option contracts but you really need to know what you are doing and not even think for a second some guru on youtube or tiktok thinks they know what they are doing. That includes the various “signal service” sites on the net. I have met some of them in my travels and they are cast offs, some who worked in a bank for a while, who could not even sniff what it really means to know what you are doing or match the professionals I have dealt with. Use your heads people.
September 18, 2024 at 5:36 pm #11812September 18, 2024 at 5:25 pm #11811Frankly I don’t care what the FED does because I am not running a billion dollar portfolio at present. I just want them to sneeze and provide actionable participation opportunity without getting scorched. Therefore, I have multiple orders, very light on leverage, at various points way outside of current market. If none are reached then I pounce on the momentum. That is how I approached days like this as a CTA.
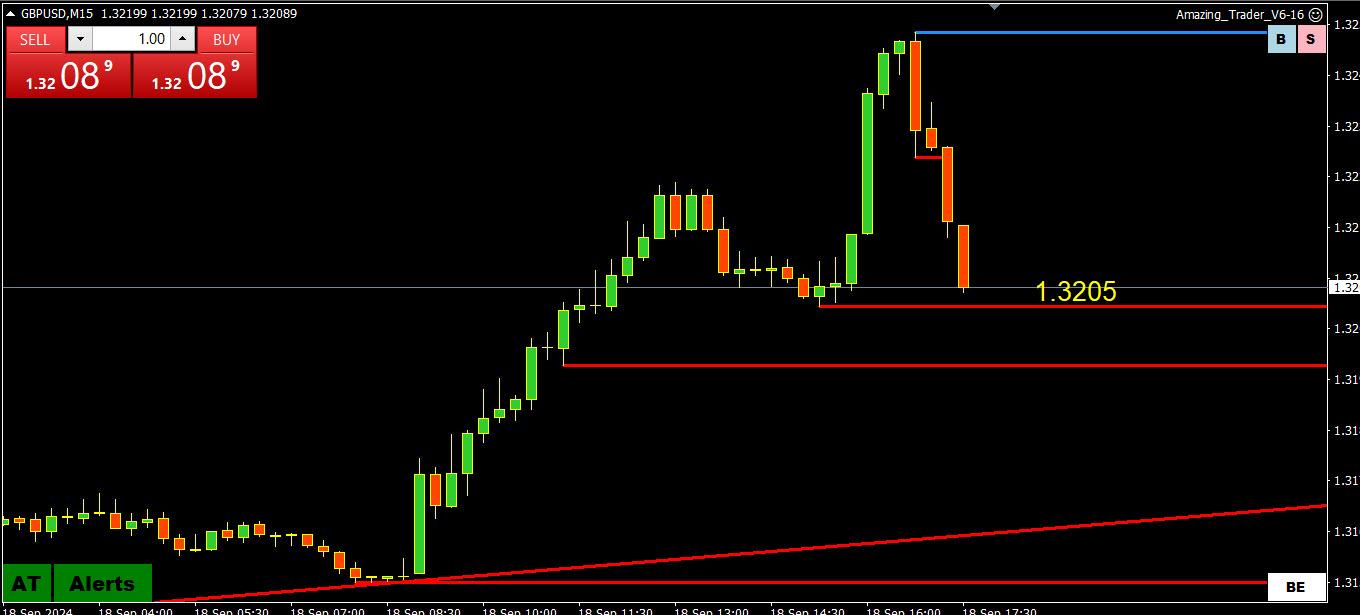
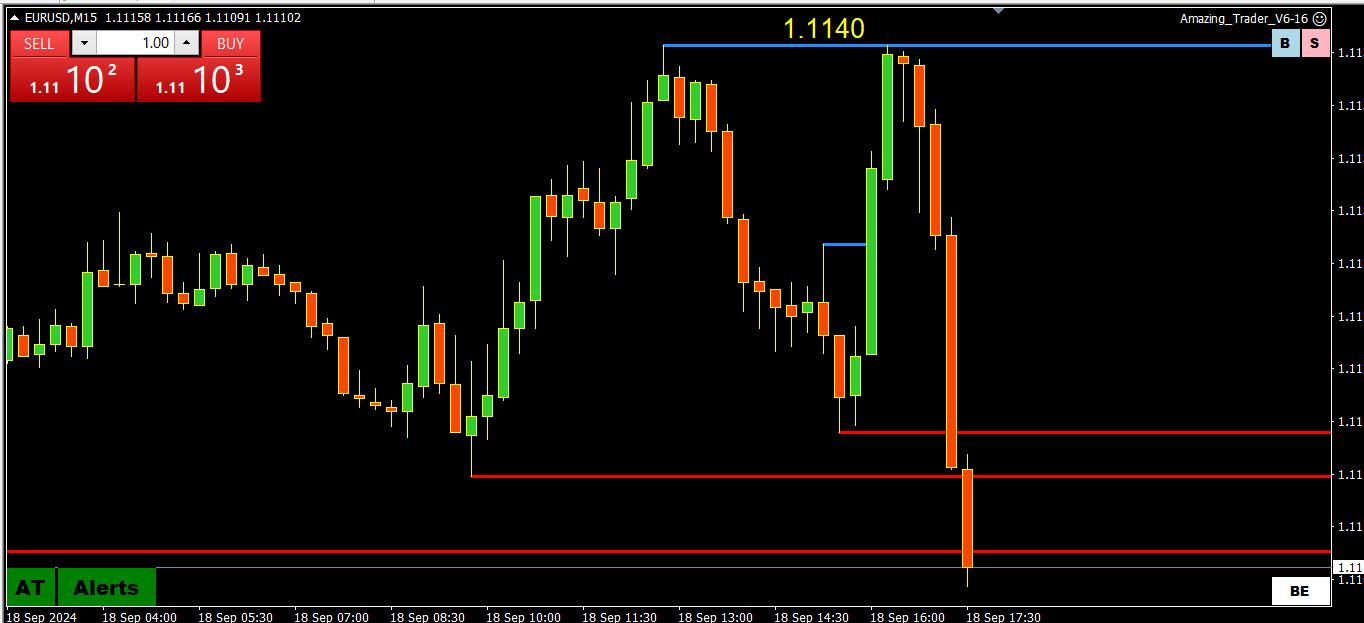
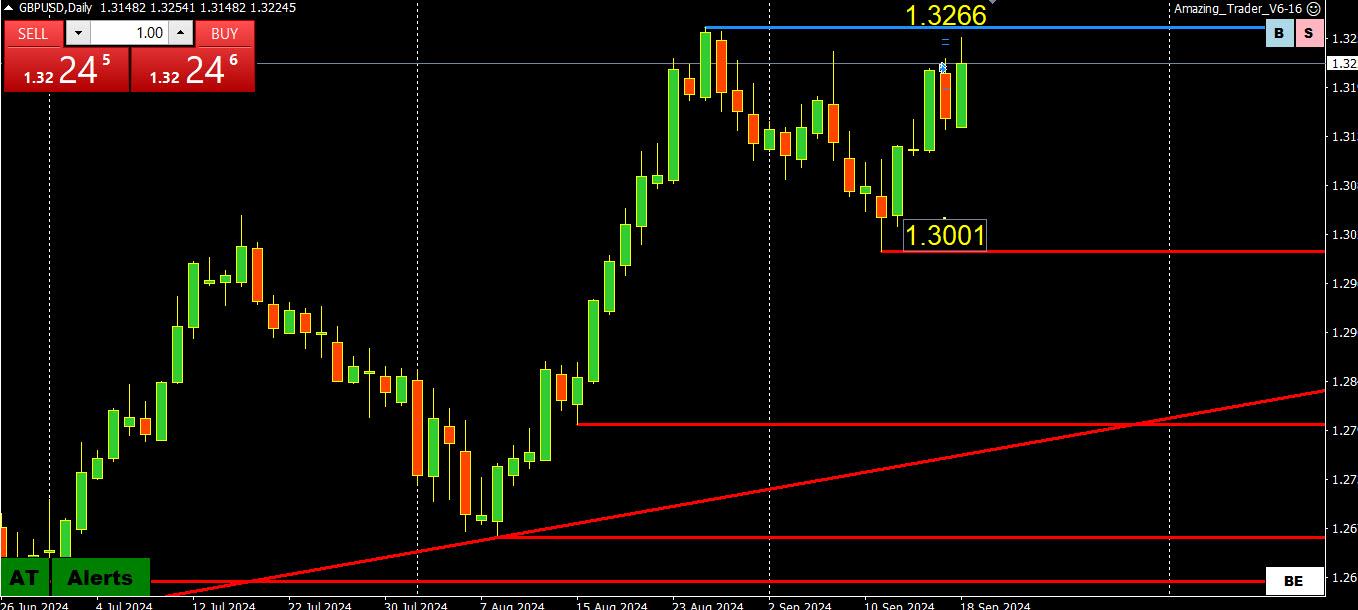
September 18, 2024 at 5:10 pm #11810Thus week’s ranges so far… stops are generaly placed outside the low/high for the week but not sure why anyone would place a stop after a key event kike the fOMC… look at your charts to see key levels outside of these levels
EURUSD 1.1072-1.1146
USDJPY 139.57-1.4246
GBPUSD 1.3111-1.3254
USDCAD 1.3565-1.3515
AUDUSD .6694-.6789
September 18, 2024 at 4:46 pm #11809September 18, 2024 at 4:22 pm #11805AnonymousSeptember 18, 2024 at 4:12 pm #11799AnonymousSeptember 18, 2024 at 4:05 pm #11798It is fun to remember that our comments in GVI are being watched. I found a comment I made here from about a week ago regarding market conditions in the comment section (verbatim cut and paste) by someone in the forum of an online media source in the UK last night just while entertaining the mind reading peoples perspectives. I left it alone of course, why chastise someone for no good reason. Good job GVI. The content here holds value.
September 18, 2024 at 2:45 pm #11797September 18, 2024 at 2:43 pm #11796September 18, 2024 at 2:27 pm #11795Part of what is keeping Dx buoyed is apprehension in stocks ahead of the FED. The conviction is lukewarm in dollar though, hence a bit of two-way motion including other markets-wide components. It is important to remember a lot of pricing in has already transpired but there are also ongoing global transactions taking place in import/export and the like so this is fluid.
September 18, 2024 at 2:03 pm #11794September 18, 2024 at 1:54 pm #11793Wsj’s timiraos is trying a last pro – kick at 50 pt cut in this morn’s edition claiming that 50 bps is not reserved for “severe” condition
only at 2pm will we be able to see the strenght of his “whispering”
with market significantly pricing odds of 50 pointer, I got me some popcorn to see if the FED plies to these plaeyrs
September 18, 2024 at 1:31 pm #11792September 18, 2024 at 1:07 pm #11791Worth noting USDJPY touched 142 but went no farther (last 141.72)
GBP getting some flows after inflation data… EURGBP extending its low (last .8409)
Otherwise it is a wait and see until Fed time, USD is a touch softer
Bond yields a touch higher
Stocks holding up
But a new ball game after the Fed decision
Until then, market bets are still for a 50bps rate cut, not sure if it is based on hope, prayer or a stronger conviction.
September 18, 2024 at 10:54 am #11790FOMC
Besides the size of the rate cut and accompanying statement, keep an eye on the dot plot.
What is the dot plot?
The Federal Reserve’s (Fed) dot plot is a chart that shows the projections of the Federal Open Market Committee (FOMC) members for the federal funds rate. The dot plot is published quarterly, and is a tool used to help the public understand the Fed’s thinking on interest rates and the economy.(AI Overview)
September 18, 2024 at 10:47 am #11789A look at the day ahead in U.S. and global markets from Mike Dolan
There’s little left to say about the dominant event of the day – other than how to game markets’ reaction to the size of the Federal Reserve’s interest rate cut later and what Fed policymakers project over the horizon.
Few, if any, doubt the first Fed easing of the cycle is now at hand. Wall Street’s S&P500 (.SPX), opens new tab hit a new intra-day record on Tuesday ahead of the decision – lapping up the prospect of lower borrowing costs even as the economy picks up some steam. Stock futures held firm overnight into the big decision.
Morning Bid: Flirting with records as Fed rates finally fade
September 18, 2024 at 10:38 am #11788September 18, 2024 at 10:08 am #11787September 18, 2024 at 9:58 am #11786September 18, 2024 at 9:52 am #11785 -
AuthorPosts
- You must be logged in to reply to this topic.
Search
© 2024 Global View