
- This topic has 28,558 replies, 54 voices, and was last updated 6 hours, 15 minutes ago by GVI Forex 2.
-
AuthorPosts
-
February 27, 2025 at 10:27 pm #20225February 27, 2025 at 9:10 pm #20212
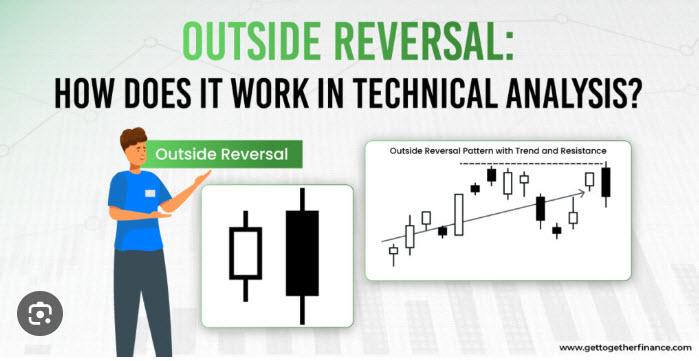
An Outside Month Key Reversal is a technical analysis pattern that signals a potential trend reversal in financial markets, often seen in stocks, commodities, or forex.
What is it?
It happens when the price action of the current month:
1. Trades both higher and lower than the previous month’s range (making an outside bar).
2.Closes above the previous month’s high (for a bullish reversal) or closes below the previous month’s low (for a bearish reversal).
Bullish Outside Month Key Reversal
• Current month low is lower than the previous month’s low.
• Current month high is higher than the previous month’s high.
• Close is above the previous month’s high.
• This signals a possible uptrend reversal.
Bearish Outside Month Key Reversal
• Current month high is higher than the previous month’s high.
• Current month low is lower than the previous month’s low.
• Close is below the previous month’s low.
• This signals a possible downtrend reversal.
Key Points:
• The larger the volume, the stronger the signal.
• It works better after a prolonged trend.
• Monthly charts provide stronger signals than daily or weekly charts.
(From the internet)
February 27, 2025 at 8:57 pm #20211NAS100 DAILY CHART – Outside month still on the table

As I have been noting, the failure to regain 21376 keeps an outside month risk on the table. For this to occur, 20471 would need to be broken with a risk to 19887 -21300 below it.
So, 20471 will be the focus on Friday as it needs to hold and 20836 regained to ease the risk.
February 27, 2025 at 8:55 pm #20210US500 DAILY CHART –Outside month
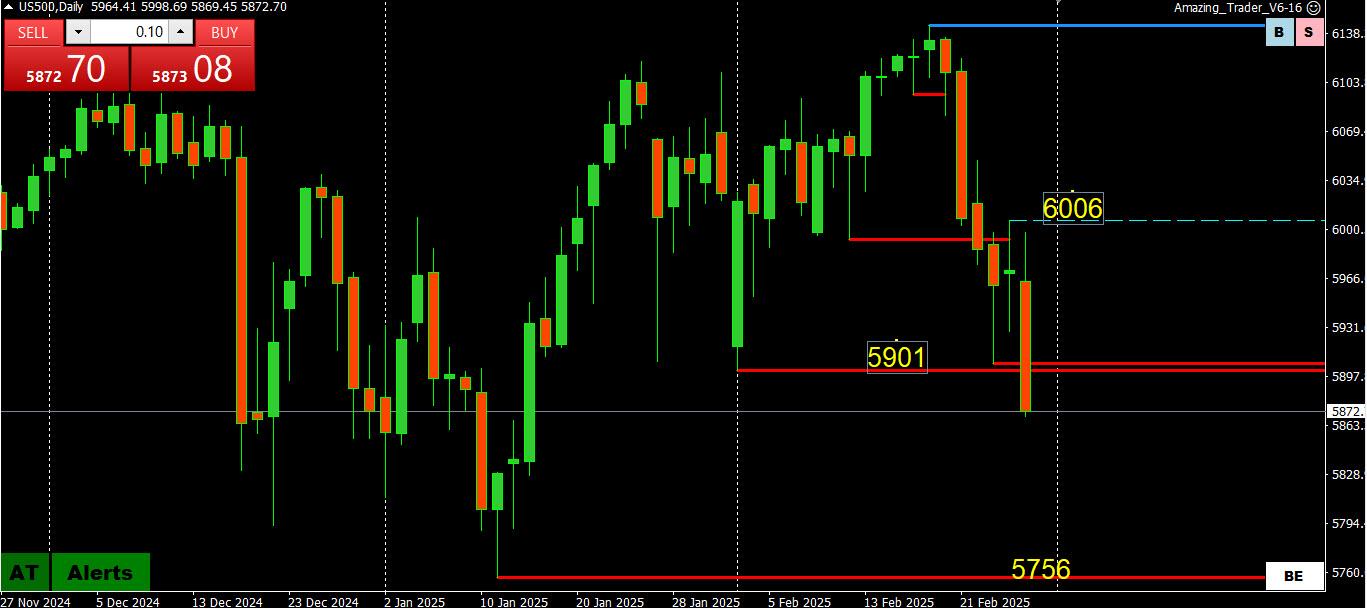
I may have sounded like a broken record noting the risk of an outside month.
The break of 5901 (low 5893) produced an outside month (new low for the year), which makes the Friday close the focus. A finish to the month below 5901 would produce an outside month key reversal with a void on charts until 5756.
This suggests 5900+ is needed to slow the risk. .
February 27, 2025 at 8:47 pm #20209February 27, 2025 at 8:32 pm #20208February 27, 2025 at 7:56 pm #20205February 27, 2025 at 7:55 pm #20204XAUUSD DAILY CHART – Weekly Pattern Broken
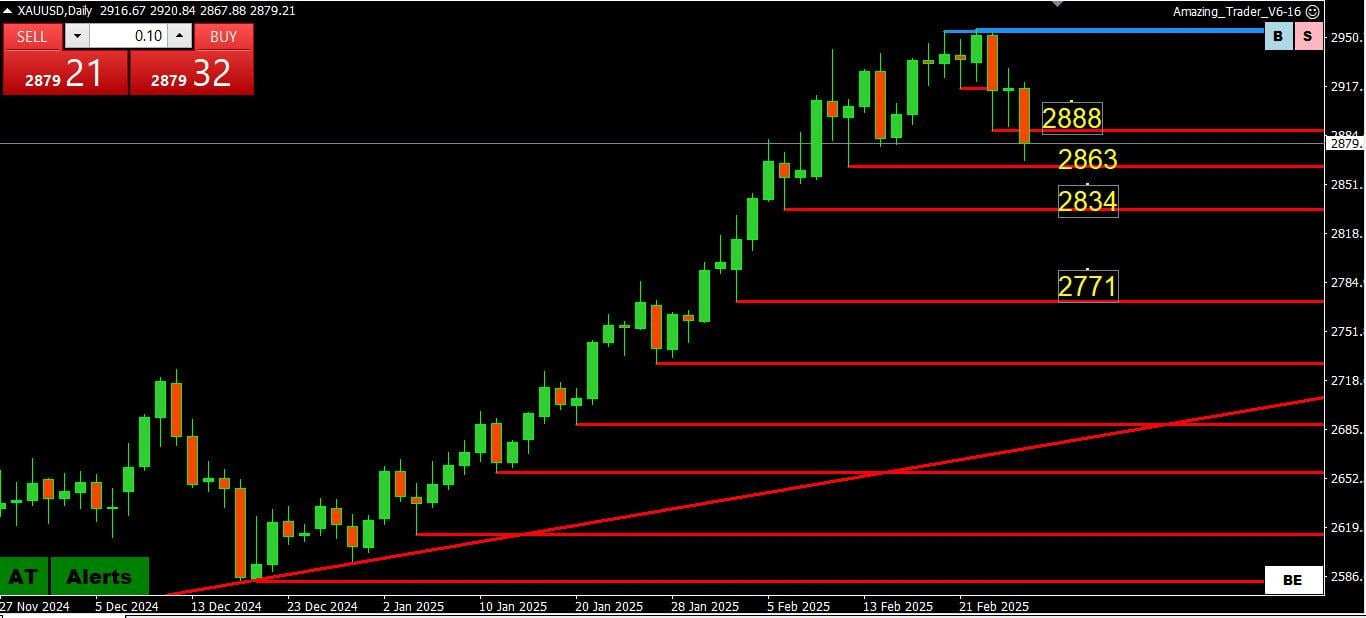
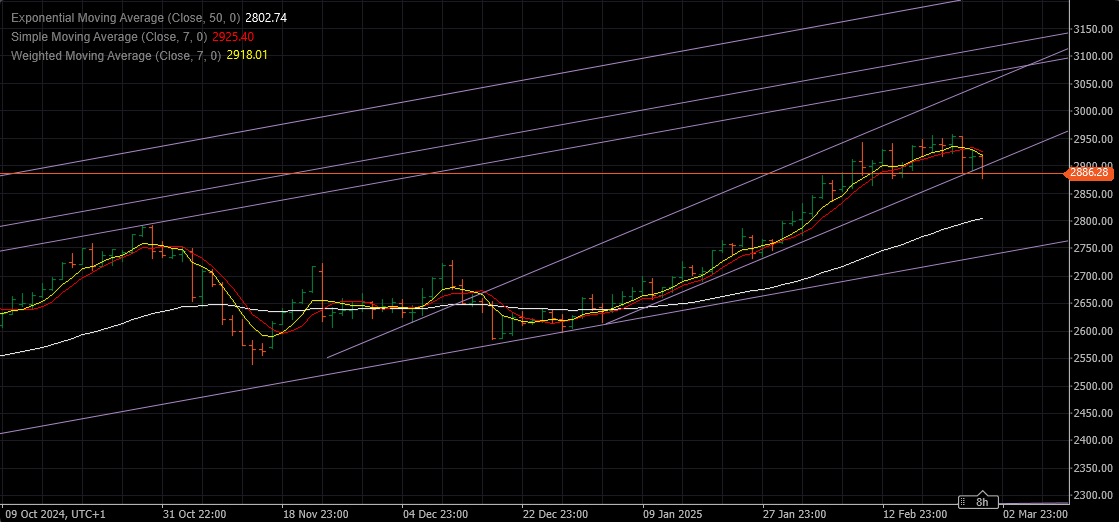
Now that the 8 week up pattern has been broken with a move below 2877, the focus is on Friday’s close to see it finishes below this level for an outside week key reversal.
In any case, while the high is in for now, note there are layers of supports (red AT lines) below the market.
To slow the risk, it needs to trade above 2877-88, about 2920 to negate it.
February 27, 2025 at 7:49 pm #20203February 27, 2025 at 7:45 pm #20202February 27, 2025 at 7:44 pm #20201February 27, 2025 at 7:39 pm #20199February 27, 2025 at 4:15 pm #20185Time to revisit this article as XAUUSD price action is a classic Monday Effect
Another Trading Secret Revealed: The Monday Effect
 February 27, 2025 at 4:05 pm #20184February 27, 2025 at 3:57 pm #20183February 27, 2025 at 3:11 pm #20182
Quick recap
EURUSD break of 1.0450..highly suggests 5 day pattern around 1.05 will be broken … 1.0400 is key support, then 1.0372
JPY getting safe haven flows… USDJPY brief move above 150 smacked back below it
GBPUSDF follows EURUSD with a lag (EURGBP lower)… UK so far escaping the tariff wrath of Trump
Stocks hit, boind yields off early highs
February 27, 2025 at 3:02 pm #20181February 27, 2025 at 2:55 pm #20180February 27, 2025 at 2:52 pm #20178February 27, 2025 at 2:24 pm #20176i alerted to be wary of headlines today and Trump did not disappooint.
Now post headline USD highs are key day resistance levelsa s only through there would trigger fredh stops.
EURUSD upside limited while below 1.0450-60
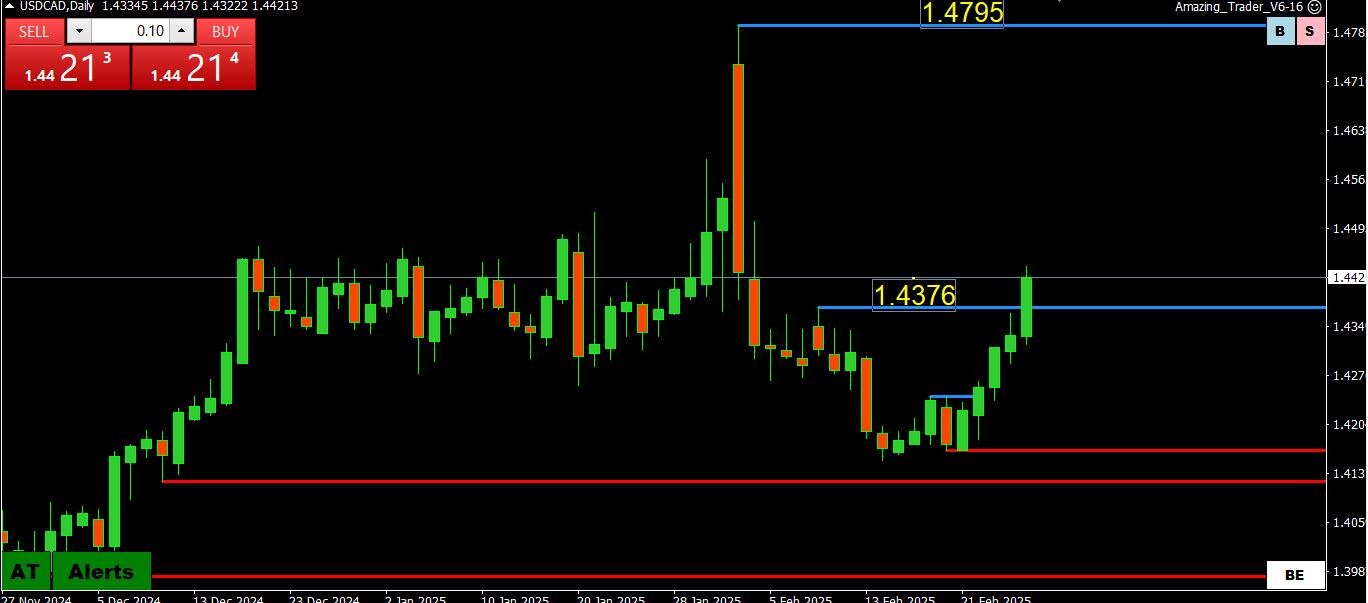
USDCAD stays bid while above the 1.4376 breakout level.
TrumP speaks again at the presser with the UK PM in the afternoon
February 27, 2025 at 1:51 pm #20174February 27, 2025 at 1:42 pm #20172February 27, 2025 at 1:36 pm #20171February 27, 2025 at 1:34 pm #20170Big miss in weekly jobless claims but offset by upward revision to inflation in the GBP revision. .
See our Economic Data Calendar
February 27, 2025 at 12:13 pm #20169February 27, 2025 at 11:44 am #20168
US OPEN
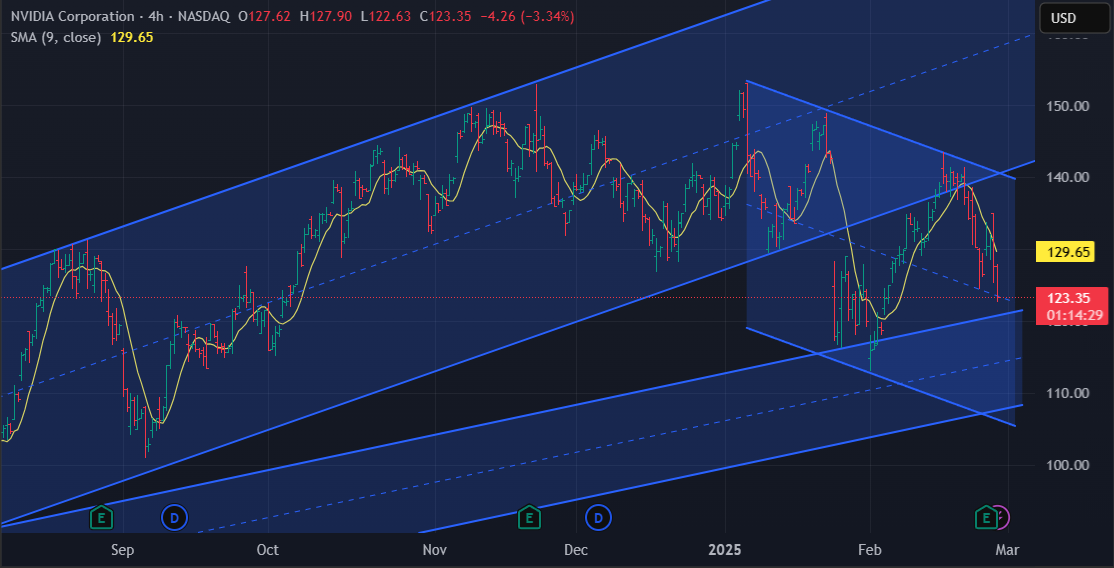
NVIDIA +1% in pre-market after Q4 results, a pick up in yields lift the Dollar ahead of US data
Good morning USA traders, hope your day is off to a great start!
Here are the top 4 things you need to know for today’s market.
4 Things You Need to KnowNVIDIA +1.1% in US pre-market after headline beats whilst Q1 gross margins are seen easing.
European bourses on the backfoot with sentiment hit in Europe amid Trump’s EU tariff threats; US futures gain.Pick-up in US yields provides reprieve for USD, USD/JPY eyes a test of 150.
Crude trims recent losses but metals pressured by a firmer Dollar.
<p style=”text-align: center;”><strong><a href=”https://newsquawk.com?fpr=c3imf”>Try Newsquawk for 7 Days Free</a></strong></p>
February 27, 2025 at 11:34 am #20167A look at the day ahead in U.S. and global markets from Mike Dolan
What appeared like a solid earnings beat from AI-bellwether Nvidia (NASDAQ:NVDA) failed to impress nervy tech investors, with anxiety about the wider U.S. economy persisting as trade tariff drums keep beating.
Morning Bid: Even Nvidia beat gets a shrug, tariff war looms
February 27, 2025 at 11:06 am #20166February 27, 2025 at 10:41 am #20165February 27, 2025 at 10:06 am #20164EURUSD 4 HOUR CHART – -FOCUS ON 1.05
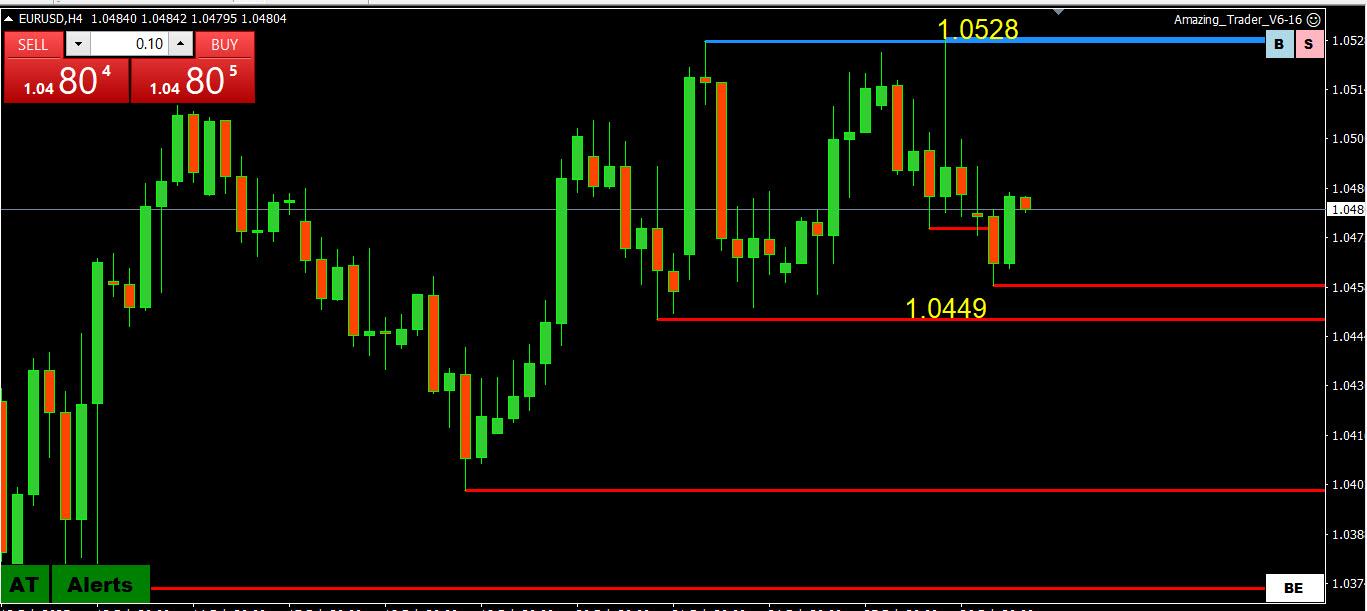
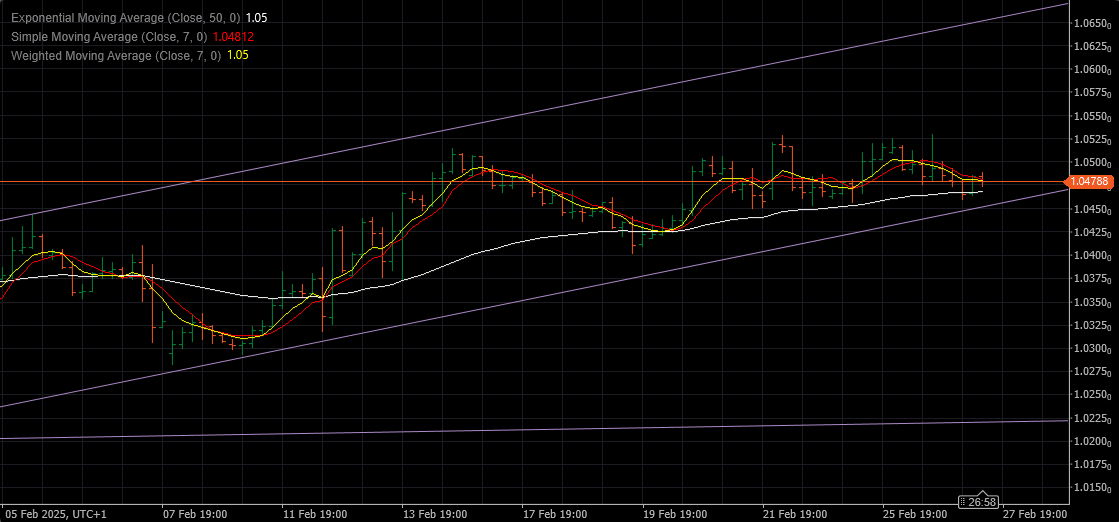
EURUSD is back below 1.05 following a double top at 1.0528 yesterday and yet to test 1.05, which has printed 5 days in a row.
While a break of this pattern would send a bearish signal it would only be confirmed if 1.0449=50 is firmly broken.
Meanwhile, there is a full day ahead for this pattern to be extended or fail.
Range so far today: 1.0459-92
-
AuthorPosts





- You must be logged in to reply to this topic.
Search
© 2024 Global View