
- This topic has 27,907 replies, 54 voices, and was last updated 15 hours, 15 minutes ago by Mtl JP.
-
AuthorPosts
-
June 1, 2025 at 3:17 pm #25677
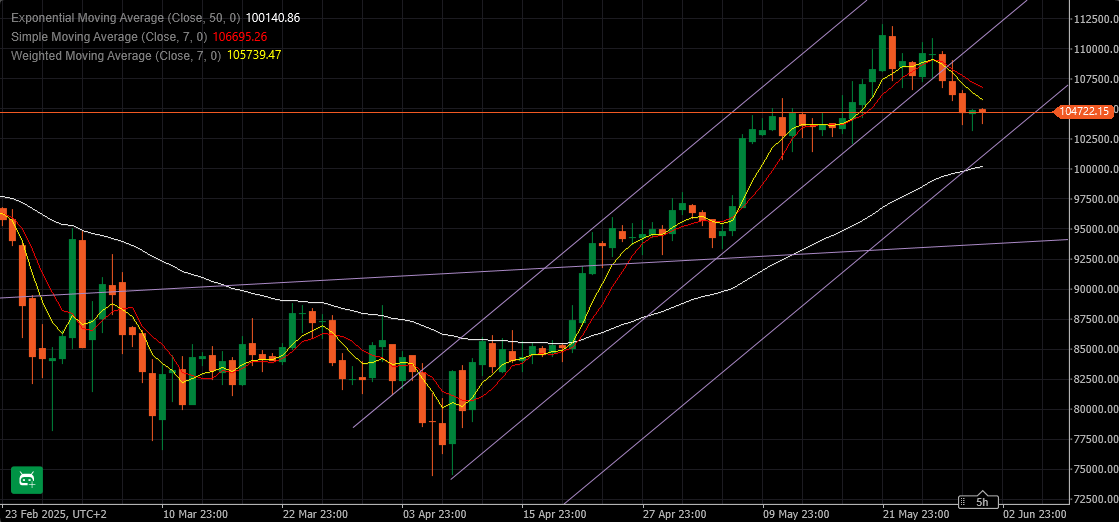
BTCUSD Daily
Question of a Trillion dollars is where this correction might end.
There are no proven methods that can determine exact point, but we can use some more speculative ones…
To start with, we have to assume that BTC is destined to continue Upwards for some foreseeable future
And as long as it stays above 90K that is about right.
Kind of dogma…I know 😀
Now when we have a stance about it, we can use Historical trend lines copied from BTC past – these lines are pretty exact, and based on the angle that any given pair is following once in a trend.
So here I did exactly that and placed it to have approximately the same width of the channel as previous one – and it is similar to the level of EMA 50.
It is at about 101.200
I expect to see some serious reaction there – so we’ll see 😀
BTC should reach it in a day or two and in that case it will be at 102.500
 June 1, 2025 at 3:15 pm #25676
BTCUSD (BITCOIN)
Trying to fine tune technical levels in a crypto that can move 5% in a blink of the eye seems pointless so let’s take a look at what an AT (The Amazing Trader) chart is showing going strictly by the book
Two blue AT lines drawn off the high indicated a potential change in direction that has played out.
Below 100659 would confirm a top and end of the last leg up with a target at 92783.
Otherwise, still just a retracement with support as long as it trades above 100659
BTCUSD DAILY CHART
 June 1, 2025 at 11:31 am #25673
OPEC+ oil producers stick to their guns with another big hike for July
Key points:
· Eight OPEC+ members met online
· OPEC+ cites steady economic outlook, healthy fundamentals
· Started unwinding output cuts in April
· The world’s largest group of oil producers, OPEC+, stuck to its guns on Saturday with another big increase of 411,000 barrels per day for July as it looks to wrestle back market share and punish over-producers.
· Having spent years curbing production – more than 5 million barrels a day (bpd) or 5% of world demand – eight OPEC+ countries made an modest output increase in April before tripling it for May, June and now July.
· They are spurring production despite the extra supply weighing on crude prices as group leaders Saudi Arabia and Russia seek to win back market share as well as punish over-producing allies such as Iraq and Kazakhstan.
· In a statement OPEC+ cited a “steady global economic outlook and current healthy market fundamentals, as reflected in the low oil inventories” as its reasoning for the July increase.
· OPEC+ pumps about half of the world’s oil and includes OPEC members and allies such as Russia.
· Its increased supply is weighing on crude prices, squeezing all producers, but some more than others, including a key group of rivals – U.S. shale producers, analysts say.
· Oil prices BRN1! fell to a four-year low in April, slipping below $60 per barrel after OPEC+ said it was tripling its output hike in May and as U.S. President Donald Trump’s tariffs raised concerns about global economic weakness. Prices closed just below $63 on Friday.
· Global oil demand is expected to grow by an average of 775,000 bpd in 2025, according to a Reuters poll of analysts published on Friday, while the International Energy Agency in its latest outlook saw an increase of 740,000 bpd.
· Besides the 2.2 million bpd cut that the eight members started to unwind in April, OPEC+ has two other layers of cuts that are expected to remain in place until the end of 2026.
“The oil market remains tight indicating it can absorb additional barrels, as the effective increase should be smaller as several of the eight countries are overproducing, and demand is seasonally rising,” said Giovanni Staunovo, analyst at UBS.
 June 1, 2025 at 11:23 am #25672
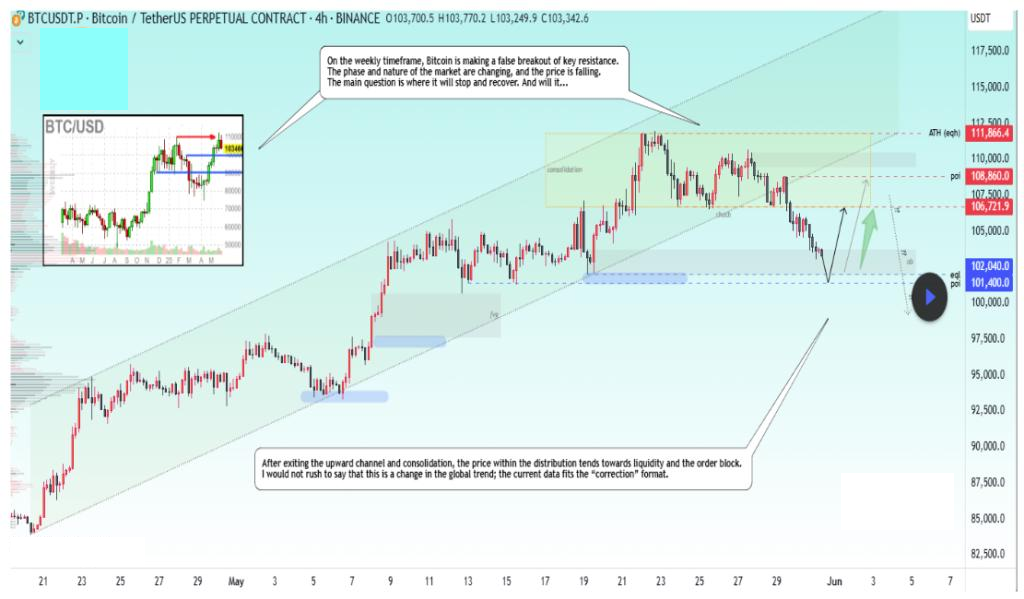
$202 Million In Long Liquidations Rock Bitcoin Market — What’s Next For BTC Price?
Over the weekend, Bitcoin’s price extended its disappointing performance, falling to around $103,000 in the early hours of Saturday, May 31st. While the premier cryptocurrency seems to have recovered fine in the past day, its price is still more than 6% away from the recently achieved all-time high of $111,814. Interestingly, the latest on-chain data suggests that the Bitcoin price could resume its upward trajectory anytime from now.
Mass Long Liquidations Could Mean Sustained Upward Trend For BTC
The latest event — involving $202 million worth of BTC long positions — is the third-largest in the past month, trailing only two larger liquidations in May: $211 million on May 12 and $277 million on May 23. This series of high-value liquidations reflects the increased speculative activity in the Bitcoin market over the past few weeks.
While the investors who suffered this liquidation may feel hard done by the market, these mass liquidations could be positive for the flagship cryptocurrency — a healthy reset for what is starting to feel like an overheated market. By removing excessive leverage, the Bitcoin market can re-establish a more stable foundation for price discovery and a continued upward trend.
Bitcoin Funding Rates Still Very Low
Bitcoin funding rates are still at extremely low levels. This trend signals the unwillingness and hesitation of traders to open new long positions
Typically, when Bitcoin breaks above its previous all-time high, we tend to see a surge in funding rates, signalling that euphoria and risk appetite are back. But that’s not what we’re seeing right now, investors need more clarity before jumping in with conviction.
This cautious stance of investors could be positive for the Bitcoin price and the upward trend. Moreover, the lack of euphoria reflects a market that is yet to be overheated, with room for further upside growth.
 May 31, 2025 at 7:32 pm #25670
EU ‘prepared to impose countermeasures’ after Trump doubles steel tariffs to 50%
and one breath later
Germany’s new chancellor to meet Trump in Washington on Thursday
May 31, 2025 at 1:57 pm #25666May 31, 2025 at 1:28 pm #25665huff n puff OR 23:55 ?
U.S. Defense Secretary Pete Hegseth urged Asian allies to strengthen military coordination, accusing Beijing of destabilizing the region.
The Pentagon chief urged political and defense leaders in the audience to ramp up defense spending.
The absence of China’s top military official has cast doubt over whether there will still be a bilateral meeting between Chinese and the U.S. defense officials.
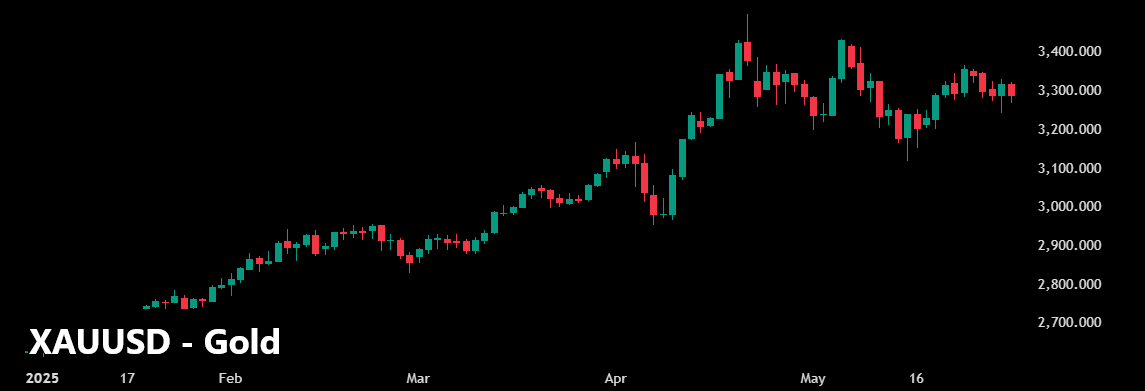
May 31, 2025 at 12:50 pm #25664Gold Saga continues – and here is an interesting approach to it: Options — The Striking Price: Miss the Gold Rally? Here’s a Safer Way In.
President Donald Trump loves gold. He uses it to adorn his properties. So it is perhaps fitting that gold is experiencing a tremendous bull run during his second term.
The SPDR Gold Shares exchange-traded fund GLD is up about 28% this year, compared with a 0.15% decline for the S&P 500 index. A day seldom passes without bullish news for the precious metal.
Unfortunately, gold is popular for reasons that likely annoy the president. As the preeminent feel-good asset in times of economic distress — and paranoia — its allure is stronger now as investors struggle to understand Trump’s master plan for remaking the U.S. and global economy.
Gold’s extraordinary price performance suggests that investors are undecided about Trump’s bold idea to use tariffs against trading partners to enrich the U.S. and liberate Americans from income taxes.
Much remains unsettled. Trump’s “big, beautiful bill” passed the House and now awaits the Senate. If approved, it would increase the deficit to about 125% of the economy’s output, which would, according to traditional thinking, hobble America with economic problems and financial risks if the tariff plan fails to produce.
To a real estate tycoon like Trump, who has often used debt as a tool to unlock asset values, deficits probably aren’t as concerning as to those who consider massive government debt to be the economic equivalent of the Covid virus.
If the president is right, the world will pay to access American consumers — perhaps the world’s greatest purchasing force — and the deficit and income taxes will cease to be problematic.
Trump’s approach is revolutionary, and potentially catastrophic, which should support gold’s continued advance. Goldman Sachs has told clients that it sees gold rising to $3,700 a troy ounce by the end of 2025, up from $3,326 on May 23.
In this case, gold’s price momentum can be harnessed with a so-called bull spread using call options, which limits money at risk while still allowing for potentially astronomical returns.
Aggressive investors who are intrigued could buy the gold ETF’s September $310 call and sell the September $330 call. This spread cost about $6.35 when GLD was at $304.50. One hundred shares of the ETF would cost about $30,450, much more than the options that control the same number of shares.
The spread’s maximum profit is $13.65 if GLD is at $330 at expiration. During the past 52 weeks, the ETF has ranged from $211.54 to $317.63.
The Fed is expected to lower interest rates in September. Until then, any hint of economic weakness should prompt more investors to buy gold and flee stocks — and maybe even bonds.
Though gold’s pre-eminence in chaotic times is assured, recent trading activity reveals increasingly volatile intraday price swings. This suggests investors are actively arguing about the sustainability of gold’s price.
 May 31, 2025 at 12:37 pm #25663
JPMorgan CEO: We shouldn’t be stockpiling bitcoin, we should be stockpiling bullets – most every msm
At the Reagan National Economic Forum, JPMorgan CEO Jamie Dimon warned the U.S. should stockpile military supplies—not Bitcoin.
May 31, 2025 at 10:58 am #25660Bitcoin bull run ‘might be delayed’ as $104.5K weekly close becomes key
Key points:
· Bitcoin is trading back below its recent all-time highs, grilling support at levels it first encountered in late 2024.
· A “deeper pullback” may result before bulls find the momentum to return to price discovery.
· Profit-taking lies at the heart of current resistance, analysis says
Bitcoin BTCUSD risks a “deeper correction” as the next phase of its bull market faces a temporary setback.
Bitcoin profit-taking causes bull run hiatus
Analysis is warning of sub-$100,000 prices as data from Cointelegraph Markets Pro and TradingView shows BTCUSD dropping 8%.
Bitcoin returned below its old all-time highs on May 31 as the latest correction nears $9,000 below its latest record peak.
After bulls encountered resistance from multiple sources, on chain indicators soon began to forecast a slowdown in bullish momentum.
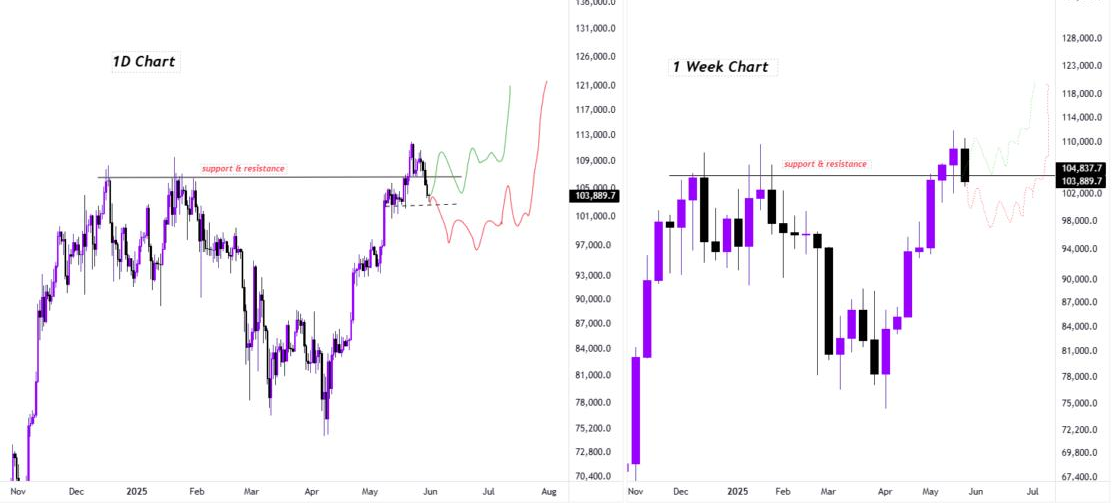
If BTC closes below the horizontal support and resistance line on the weekly, we could see a deeper pullback possibly forming an inverse Head and Shoulders before the next leg up
 May 31, 2025 at 10:51 am #25659
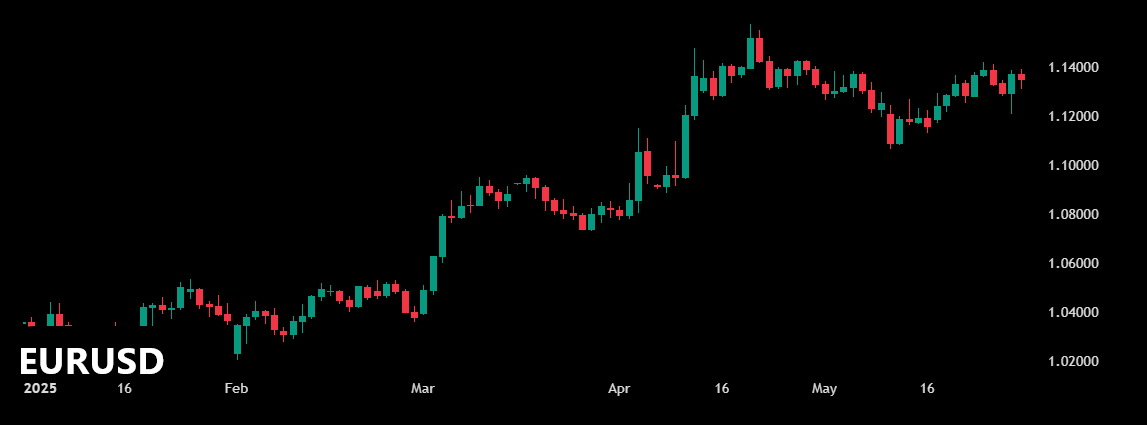
Euro Gains 0.15% to $1.1349
Euro/dollar: 1.1349 dollars per euro (0.8812 euro per dollar)
· This month the euro gained 0.15% vs. the dollar
· Up for five straight months
· Up 9.59% over the last five months
· Largest five-month percentage decline since Thursday, Aug. 31, 2017
· Largest five-month percentage gain since Friday, March 31, 2023
· Longest winning streak since Aug. 2017 when the market rose for six straight months
· This week the euro lost 0.14% vs. the dollar
· Down five of the past six weeks
· Today the euro lost 0.18% vs. the dollar
· Down three of the past four sessions
· Off 1.43% from its 52-week high of 1.1514 hit Monday, April 21, 2025
· Up 10.77% from its 52-week low of 1.0246 hit Monday, Jan. 13, 2025
· Rose 4.62% vs the dollar from 52 weeks ago
· Year-to-date the euro is up 9.59% vs the dollar
Data based on 5 p.m. ET values
 May 31, 2025 at 10:46 am #25658
Dollar Gains 0.69% to 144.05 Yen
Dollar/Japanese yen: 144.05 Japanese yen per dollar (0.0069 dollar per Japanese yen)
· This month the dollar gained 0.69% vs. the Japanese yen
· Largest one-month percentage gain since Tuesday, Dec. 31, 2024
· Snaps a four-month losing streak
· This week the dollar gained 1.04% vs. the Japanese yen
· Largest one-week percentage gain since Friday, April 25, 2025
· Up five of the past six weeks
· Today the dollar lost 0.09% vs. the Japanese yen
· Down for two straight sessions
· Down 0.56% over the last two sessions
· Largest two-day percentage decline since Monday, May 26, 2025
· Off 10.91% from its 52-week high of 161.697 hit Wednesday, July 10, 2024
· Up 2.45% from its 52-week low of 140.613 hit Monday, Sept 16, 2024
· Down 8.40% vs the Japanese yen from 52 weeks ago
· Year-to-date the dollar is down 8.37% vs the Japanese yen
Data based on 5 p.m. ET values
 May 31, 2025 at 8:38 am #25655May 31, 2025 at 12:57 am #25652
Alert
Trump says U.S. will double steel tariffs to 50%
“We are going to be imposing a 25% increase. We’re going to bring it from 25% to 50% – the tariffs on steel into the United States of America, which will even further secure the steel industry in the United States,” he said at a rally in Pennsylvania.
May 31, 2025 at 12:38 am #25651new trade opportunity
———————-
ABC News
May 30, 2025 – Trump admin live updates: Trump says he’s doubling steel tariff to 50%
President Donald Trump spoke at a rally in Pennsylvania.Trump makes announcement on US-Japan steel dealDuring a rally in Pennsylvania on Friday, President Donald Trump said he is doubling the tariff imposed on imports of steel from 25% to 50%.
May 30, 2025 at 10:05 pm #25650May 30, 2025 at 9:21 pm #25649EURUSD Daily
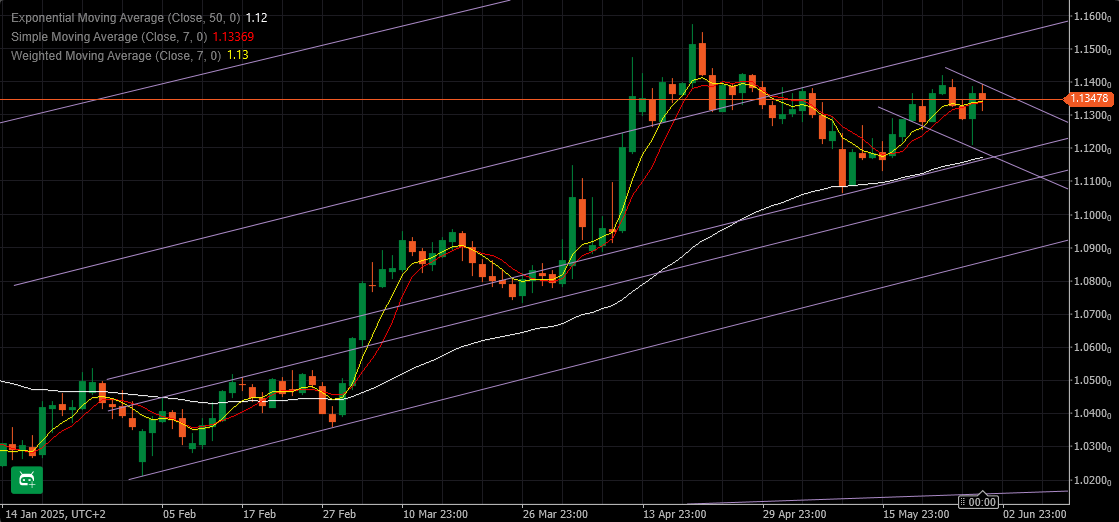
EUR closed the week pretty Bullish.
1.13900 is important level to take out if it is to continue Up.
Pattern wise – it should test higher on Monday, and everything later depends on breaking that resistance above the head.
Have a nice weekend all, and we’ll continue on Sunday evening.
In the mean time expect updates from Crypto world
 May 30, 2025 at 9:11 pm #25648
XRPUSD
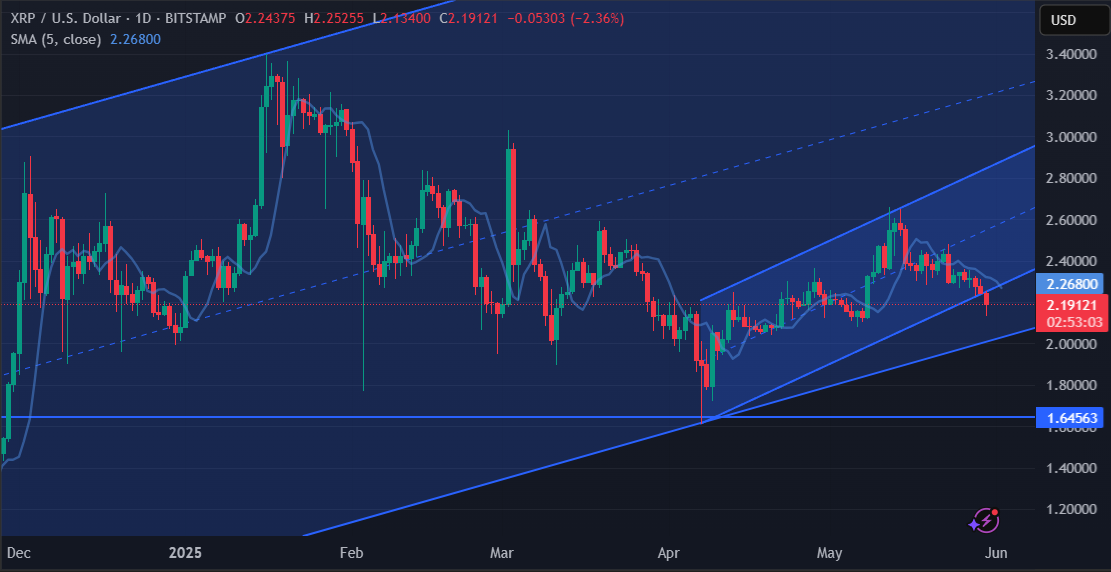
XRP lost that attacking angle and now is deep in….well..correction.
I am going over charts, and so far everything and everyone – Lost…this or that
So, watch that support at 2.01800
If XRP is to make any aggressive Up moves, that one has to hold…or 1.64550 here we come.
And that wouldn’t even be such a bad thing, but so much time would be lost.
 May 30, 2025 at 9:06 pm #25647May 30, 2025 at 9:01 pm #25646May 30, 2025 at 8:56 pm #25645May 30, 2025 at 8:50 pm #25644May 30, 2025 at 6:58 pm #25641May 30, 2025 at 6:58 pm #25640May 30, 2025 at 5:21 pm #25637May 30, 2025 at 5:18 pm #25636
EURUSD 4H
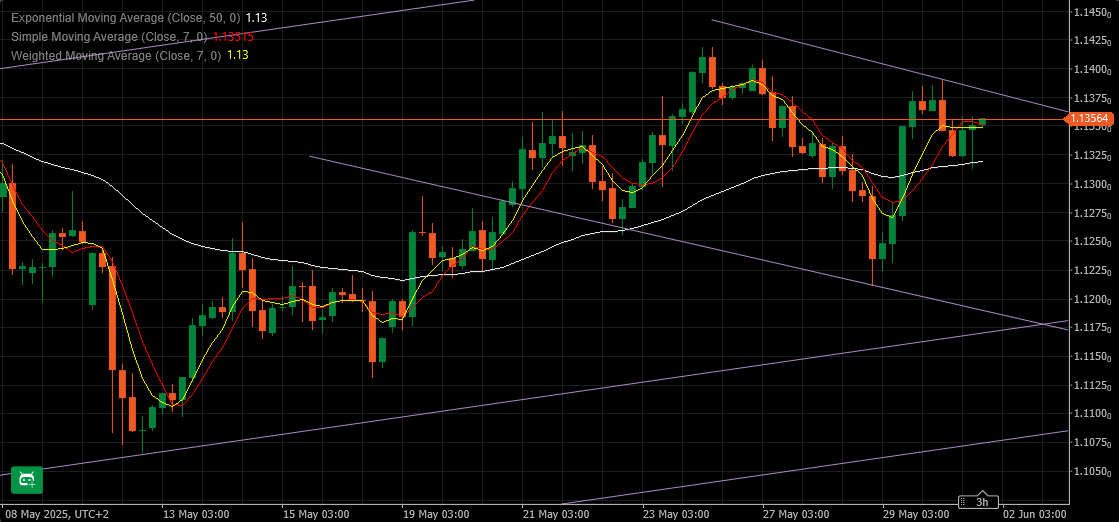
This is one silly development – someone / something is obviously buying EUR on any dip….
For any follow through, EURUSD has to take over 1.13600 first and then 1.13800
If however those resistances prove to be too hard to break, whoever was buying EUR is going to have his/her stops exposed.
My bet is on the downside …so we’ll see
 May 30, 2025 at 5:12 pm #25635May 30, 2025 at 5:02 pm #25634May 30, 2025 at 4:35 pm #25631May 30, 2025 at 4:34 pm #25628
USD moves lower after data dump but there are some limits
The USD moved lower after the data that showed inflation was under control – for now. The trade data saw a big improvement. The personal income data was solid.
Not so hot is Pres. Trump tweeted that China violated the trade agreement:
Stocks are lower. Yields are near unchanged.
The USD moved lower initially, but is moving modestly higher after the initial move.
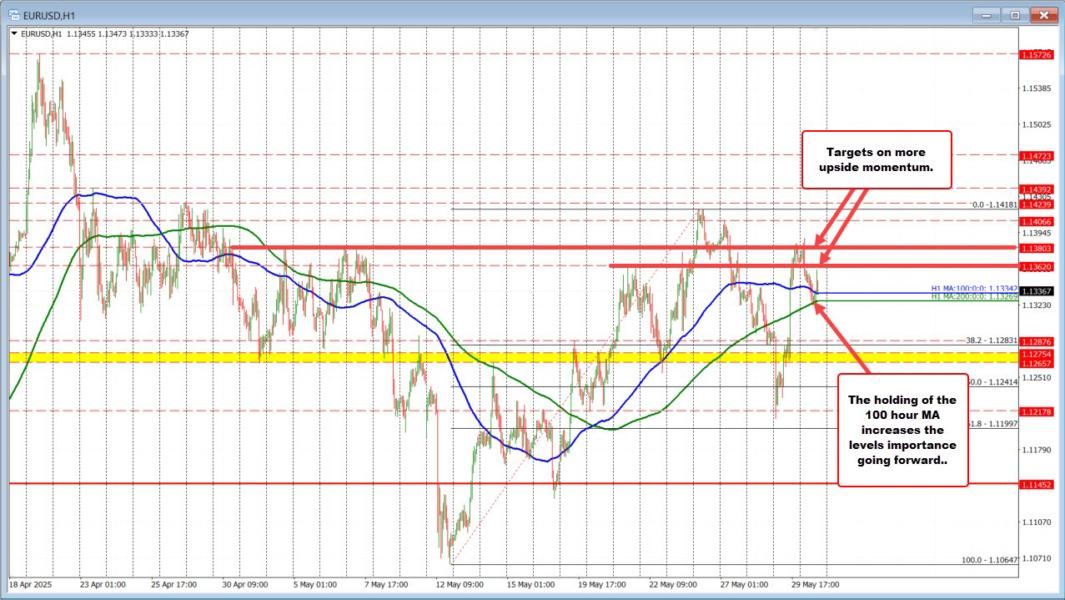
EURUSD: The EURSUD moved above the 100-hour MA at 1.13342. The high reached 1.1357. The 1.1362 and 1.13803 are targets. The high today reached 1.1389.
-
AuthorPosts


- You must be logged in to reply to this topic.
Search
© 2024 Global View