
- This topic has 28,146 replies, 54 voices, and was last updated 5 hours, 50 minutes ago by GVI Forex 2.
-
AuthorPosts
-
June 23, 2025 at 10:23 pm #26656June 23, 2025 at 10:17 pm #26655June 23, 2025 at 10:12 pm #26654
XTIUSD (WTI)
What do you say when XTIUSD falls 16,0% from its high (78.85) to a low (66.24), breaking its trendline and producing an outside day key reversal in a straight line move down?
It’s easy to say after the fact it was a case of pricing in a worst case outcome (Iran retaliation) and running for cover once it became apparent that the worst case (e.g. closing straits of Hormuz) would not materialize.
As I noted last night and again today, crude oil would act as a key indicator of the risk mood so it doesn’t take a rocket scientist to figure out how other markets reacted to the plunge in oil.
So keep an eye on the price of crude although it will be less of an indicator now that the upside failed below 80.00
Supports: Various levels between 60.00-67.00, 60.00 is major support. Expect offers to be lying above the market.
XTIUSD 4 HOUR CHART
June 23, 2025 at 9:22 pm #26653Is this the end ngame?
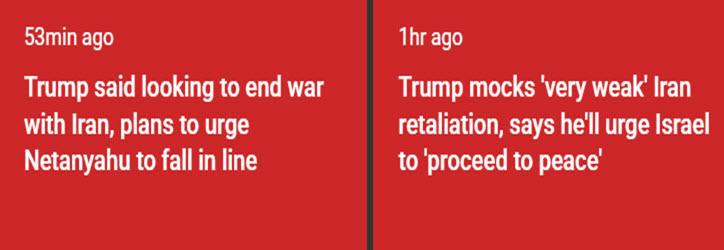
… They’ve gotten it all out of their ‘system,’ and there will, hopefully, be no further HATE,” Trump writes.
“I want to thank Iran for giving us early notice, which made it possible for no lives to be lost and nobody to be injured,” Trump says.
“Perhaps Iran can now proceed to peace and harmony in the region, and I will enthusiastically encourage Israel to do the same,” he adds
June 23, 2025 at 8:09 pm #26652NAS100 (NASDAQ)
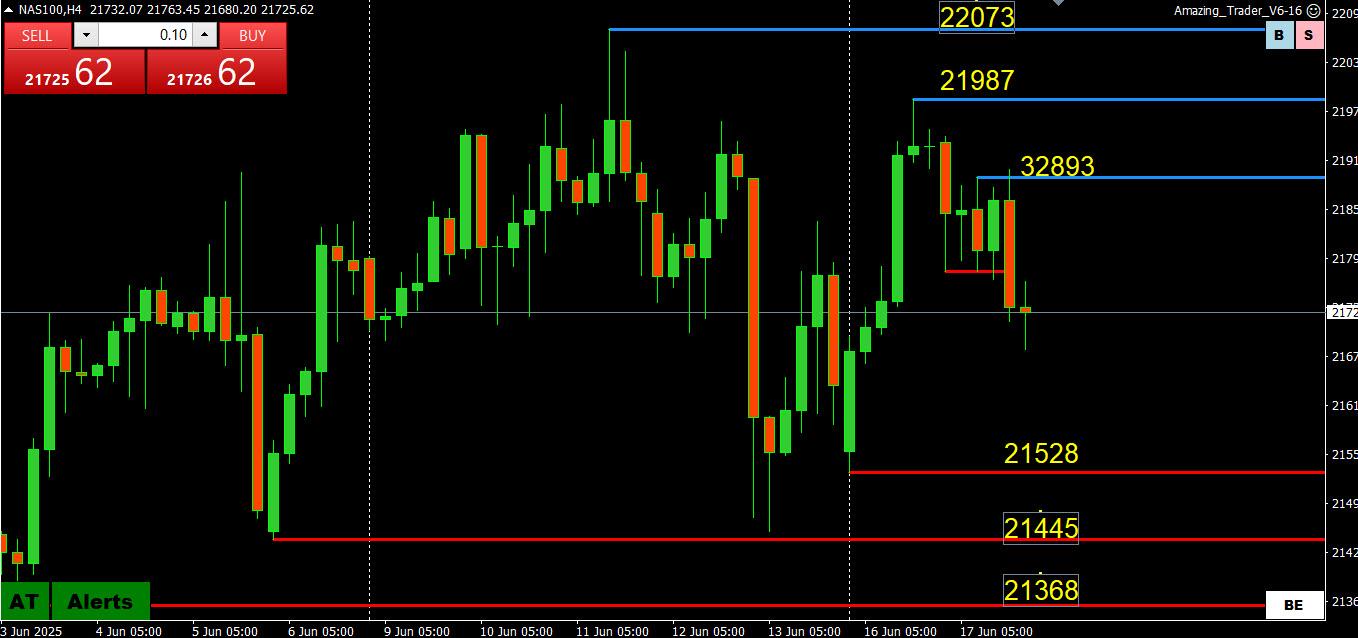
‘It has been one-way up following the pause just above 21364 support on the u-turn to risk on.
21900-22000 remains the tough zone that needs to be cracked for a run at the elusive 22220 record high.
Watch the trendline as well as a break is needed to cool any lingering downside risk and shift the risk to the upside.
Look for support on any decent dip while above 21364.
NAS100 4 HOUR CHART
 June 23, 2025 at 7:51 pm #26651
US500 (SP500)
Reversal of fortune after failure to test 5900.
Reaction to Iran retaliation was like a buy the rumor, sell the fact (or in this case sell the rumor, buy the fact).
Move back above 6000 needs to hold to have a bid, break 6025 and then 6052 to give this rebound more legs to the upside.
In any case, 6000 will continue to be pivotal in setting its tone.
US500 4 HOUR CHART
 June 23, 2025 at 7:36 pm #26650June 23, 2025 at 7:30 pm #26649June 23, 2025 at 7:29 pm #26648
Iran attack appears to be symbolic and to save face at home
 June 23, 2025 at 7:20 pm #26647June 23, 2025 at 7:14 pm #26646
Nvidia Corporation – NVDA
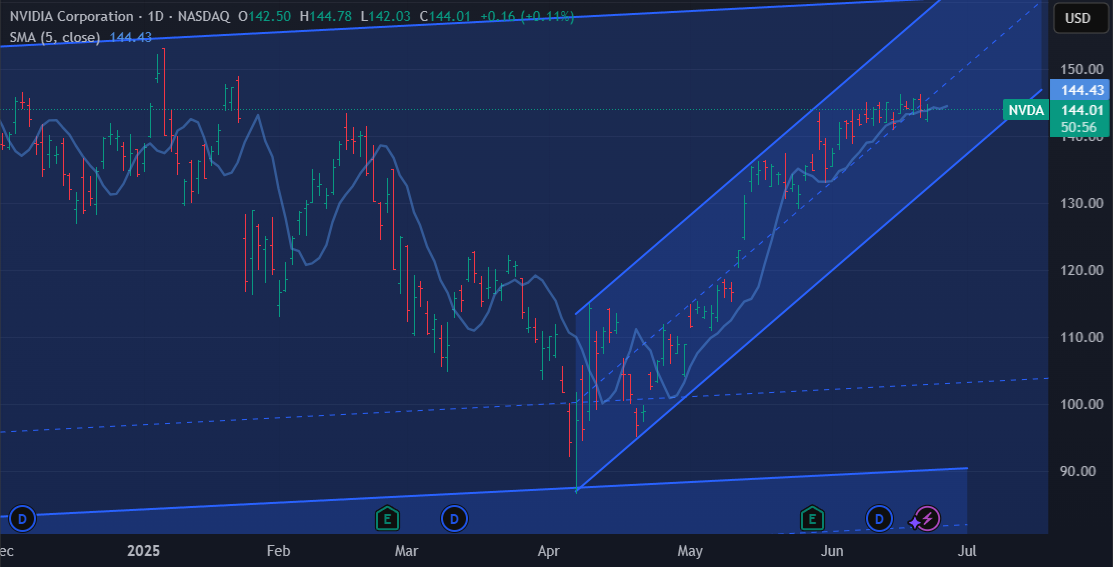
We can look at Nvidia from two opposite angles:
Nvidia is struggling to continue this rally UP
Nvidia is successfully holding onto the gains of this rally UP
Anyway you look at it, it is going up….
Resistances: 146.25, 148.95 & 153.15
Supports: 142.00, 140.85 & 138.85
Overall target stays at 160.00
 June 23, 2025 at 7:08 pm #26645June 23, 2025 at 7:02 pm #26644June 23, 2025 at 6:55 pm #26643June 23, 2025 at 6:48 pm #26642
BTCUSD – Bitcoin
BTC stayed short of reaching 95K support, and this rebound looks promising, but there are lots of obstacles in front of it.
Resistances: 103.370, 104.400 & 106.550
Supports: 99.675, 98.190 & 97.950
If it stays till closing tonight below 103.370 it would be no man’s land :
Above it, becomes Bullish
Close below 102.550 – Bearish
 June 23, 2025 at 6:42 pm #26641
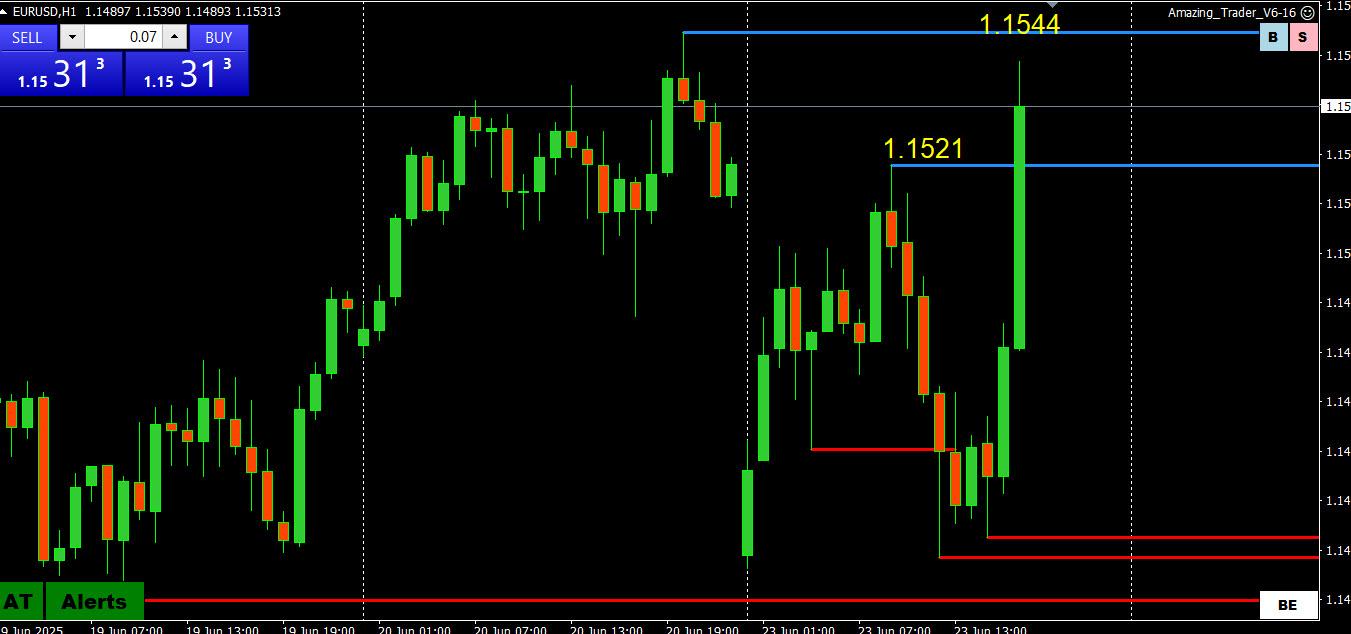
EURUSD Daily
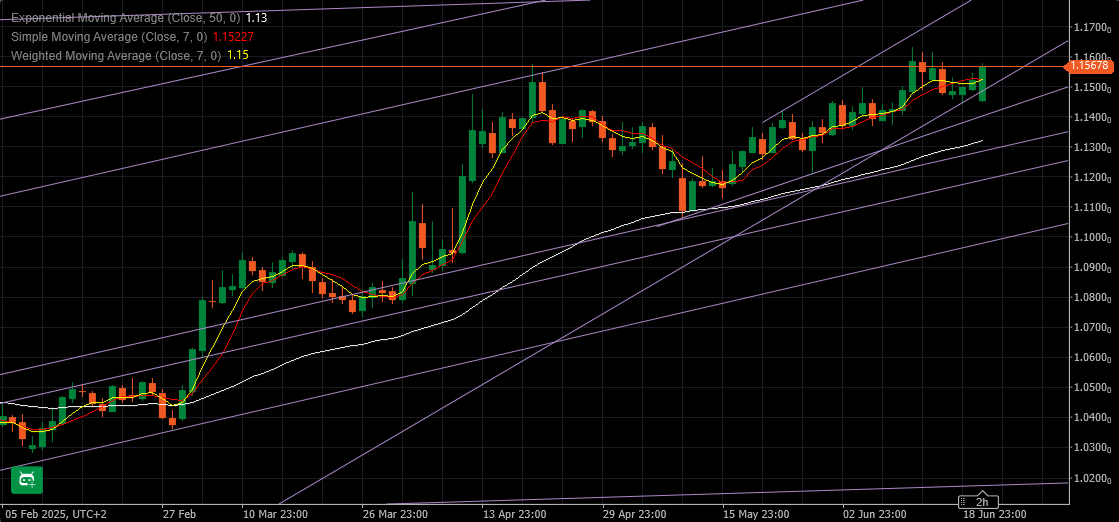
After all support at 1.14500 held firmly.
As always I will look at it strictly technical – pattern recognition of different bombs being thrown is not operational, yet 😀
Supports: 1.15450, 1.15300 & 1.14700
Resistances: 1.15800, 1.16150 & 1.16300
This is a Bullish pattern, but I would like to see the close tonight around 1.15450 to be sure that next move will be up.
 June 23, 2025 at 6:00 pm #26640June 23, 2025 at 4:52 pm #26639June 23, 2025 at 4:29 pm #26638June 23, 2025 at 4:24 pm #26637June 23, 2025 at 3:48 pm #26636June 23, 2025 at 3:45 pm #26635June 23, 2025 at 3:23 pm #26634June 23, 2025 at 3:15 pm #26633June 23, 2025 at 3:07 pm #26632
What’s Hot and What’s Not?
What’s Hot?
Dollar is no longer hot after giving back some or all of its gains (down vs C HF, GBP, EUR in that order) and well off its highs vs, others)
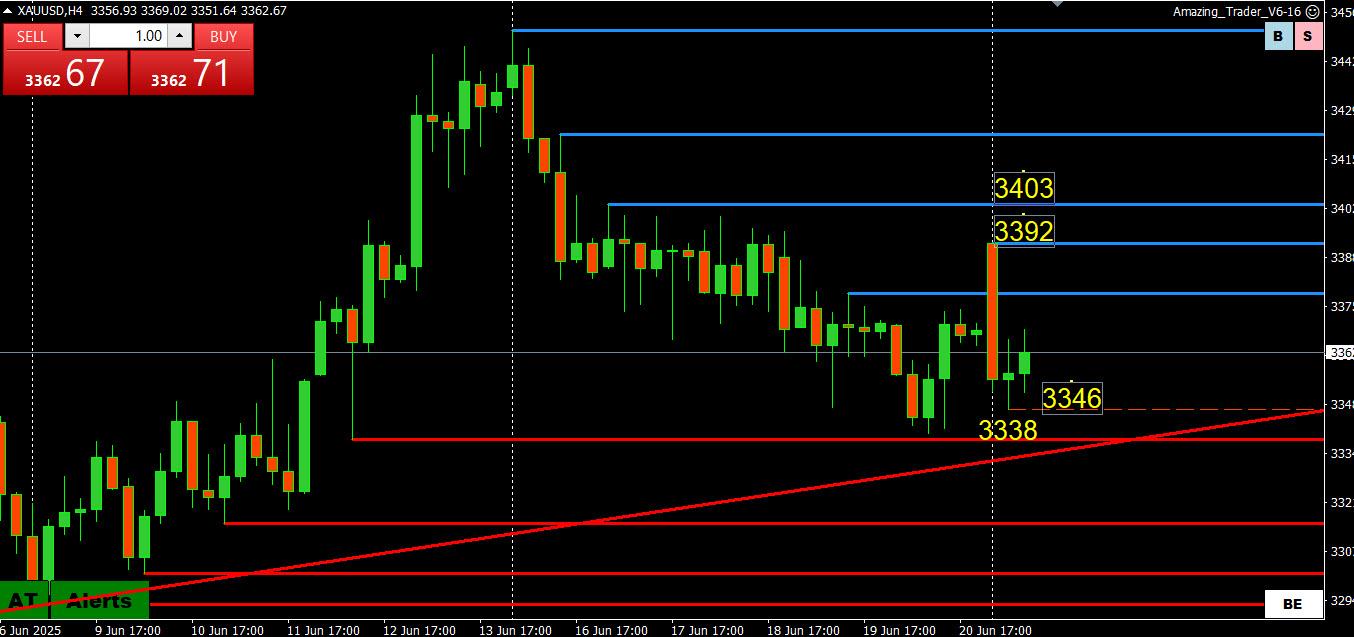
GOLD is trying to trying to turn hot but still below 3400
US bonds (yields lower)
US stocks rebounding from early losses but cautiously.
What’s Not?
The dollar giving back its safe haven gains
Crude oil after failing to follow through on an early spike higher
 June 23, 2025 at 2:51 pm #26631June 23, 2025 at 2:37 pm #26628June 23, 2025 at 2:34 pm #26627
Looking for a ctalyst for the sudden turnaround to risk oin and a weaker USD, a shift to a dovish stance may have been the catalyst.
 June 23, 2025 at 1:49 pm #26626June 23, 2025 at 1:42 pm #26625
-
AuthorPosts






- You must be logged in to reply to this topic.
Search
© 2024 Global View