
- This topic has 27,906 replies, 54 voices, and was last updated 7 hours, 31 minutes ago by GVI Forex 2.
-
AuthorPosts
-
August 18, 2025 at 2:53 pm #29185August 18, 2025 at 2:45 pm #29184August 18, 2025 at 2:39 pm #29183
USDCAD Technical Analysis – Canadian CPI and Fed Chair Powell on the agenda
Fundamental Overview
The USD came under some pressure at the start of last week following the US CPI report as the data came mostly in line with expectations. In the following days though, we got some hottish data with the US PPI beating expectations by a big margin, the US Jobless Claims improving further and the inflation expectations in the UMich survey surprising to the upside.
Overall, we ended the week basically flat on the US dollar as the aggressive dovish expectations on the Fed got trimmed a bit. Nevertheless, given the overreaction from the Fed members to the last soft NFP, a September cut looks unavoidable now and only a hot NFP report in September might get us to a 50% probability (although it would certainly diminish expectations for rate cuts after the September one).
The focus has now switched to Fed Chair Powell’s speech at the Jackson Hole Symposium on Friday. Traders will be eager to see if he changes his stance as well. Most likely though, he won’t pre-commit to anything and just reiterate that they will decide based on the totality of the data.
On the CAD side, the underlying inflation in Canada has been rising steadily since last December and continues to hover near the upper bound of the 1-3% target range. The data out of Canada has been improving recently and the latest employment report surprised to the upside.
The BoC kept interest rates unchanged at the last meeting as expected and although it kept the door open for more rate adjustments, it’s unlikely to do so unless we get another growth shock or a series of benign inflation data. The market is pricing 22 bps of easing by year-end.
USDCAD Technical Analysis – Daily Timeframe
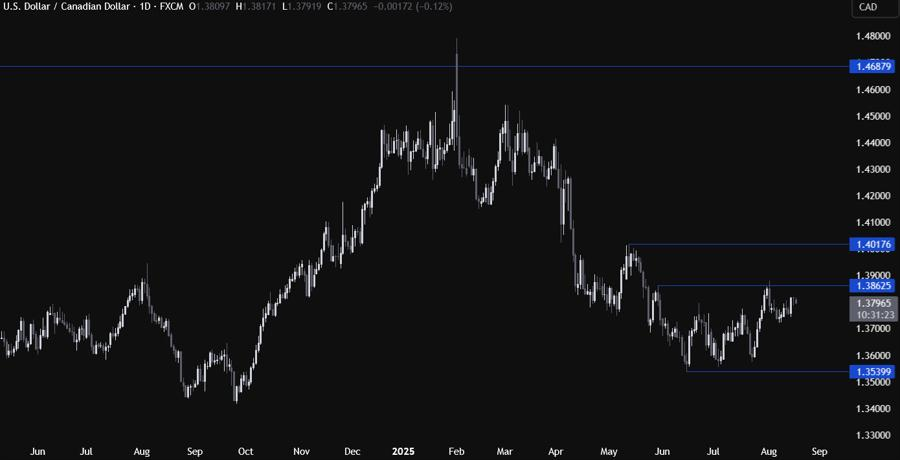
On the daily chart, we can see that USDCAD rejected the key swing level at 1.3860 following the soft NFP and got stuck in a consolidation ever since. From a risk management perspective, the sellers will have a better risk to reward setup around the swing level to position for a drop into the 1.3540 low. The buyers, on the other hand, will want to see the price breaking higher to start targeting the 1.40 handle next.
Upcoming Catalysts
Tomorrow we have the Canadian CPI and Fed’s Bowman speaking. On Wednesday, we have Fed’s Waller and the FOMC meeting minutes. On Thursday, we get the US Flash PMIs as well as the US Jobless Claims figures. Finally, on Friday, we conclude the week with Fed Chair Powell speech at the Jackson Hole Symposium.
 August 18, 2025 at 2:35 pm #29182
GBPUSD Technical Analysis – Eyes on the UK CPI and Fed Chair Powell
Fundamental Overview
The USD came under some pressure at the start of last week following the US CPI report as the data came mostly in line with expectations. In the following days though, we got some hottish data with the US PPI beating expectations by a big margin, the US Jobless Claims improving further and the inflation expectations in the UMich survey surprising to the upside.
Overall, we ended the week basically flat on the US dollar as the aggressive dovish expectations on the Fed got trimmed a bit. Nevertheless, given the overreaction from the Fed members to the last soft NFP, a September cut looks unavoidable now and only a hot NFP report in September might get us to a 50% probability (although it would certainly diminish expectations for rate cuts after the September one).
The focus has now switched to Fed Chair Powell’s speech at the Jackson Hole Symposium on Friday. Traders will be eager to see if he changes his stance as well. Most likely though, he won’t pre-commit to anything and just reiterate that they will decide based on the totality of the data.
On the GBP side, the BoE delivered a hawkish cut at the last meeting with the first voting round failing to produce a majority. It was the first time ever the BoE had to conduct two voting rounds to reach a majority. Moreover, inflation forecasts were revised upwards, and the statement leant on the more hawkish side with these two lines: “upside risks around medium-term inflationary pressures have moved slightly higher” and “the restrictiveness of monetary policy has fallen.”
The central bank is finally acknowledging that inflation should be their biggest concern given that the UK still has one of the highest inflation rates among the major countries. In fact, core inflation has never fallen below 3% since 2021. Couple that with high wage growth and a central bank that is cutting rates, and the outlook gets very tricky for the BoE. This week the focus will be on the UK CPI data.
GBPUSD Technical Analysis – Daily Timeframe
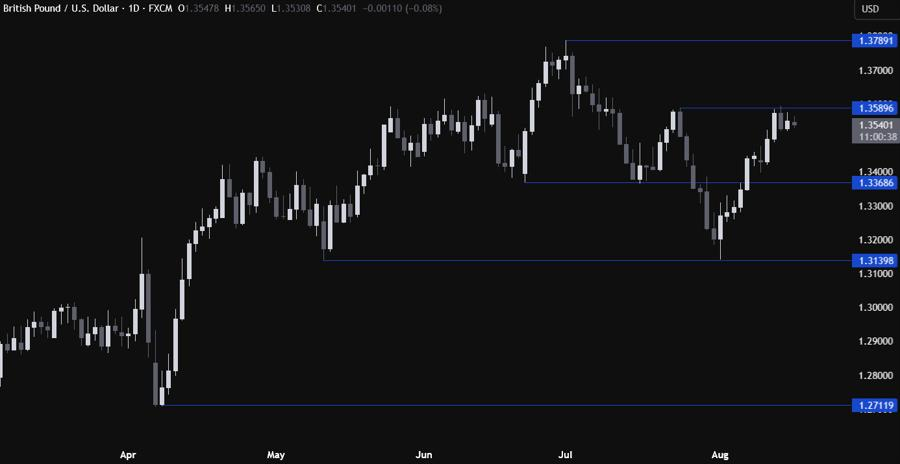
On the daily chart, we can see that GBPUSD has rallied all the way up to the key swing level at 1.3590. This is where the sellers stepped in with a defined risk above the level to position for a drop back into the 1.3368 level. The buyers, on the other hand, will need the price to break higher to start targeting the next key level at 1.3790.
Upcoming Catalysts
Tomorrow we have Fed’s Bowman speaking. On Wednesday, we have the UK CPI report, Fed’s Waller and the FOMC meeting minutes. On Thursday, we get the UK and US Flash PMIs as well as the US Jobless Claims figures. Finally, on Friday, we conclude the week with Fed Chair Powell speech at the Jackson Hole Symposium.
 August 18, 2025 at 2:31 pm #29181
EUR/USD: Euro Hits Sell wall at $1.17 as Resistance Builds at Third Inflection Point. Now What?
Key points:· Euro hits third rejection
· Upside swing challenged
· Resistance looms large
Excuse the technical language — but resistance is looming at the third leg up, causing the price to ricochet off of another lower high. Can euro bulls break through?
Triple Tap Resistance
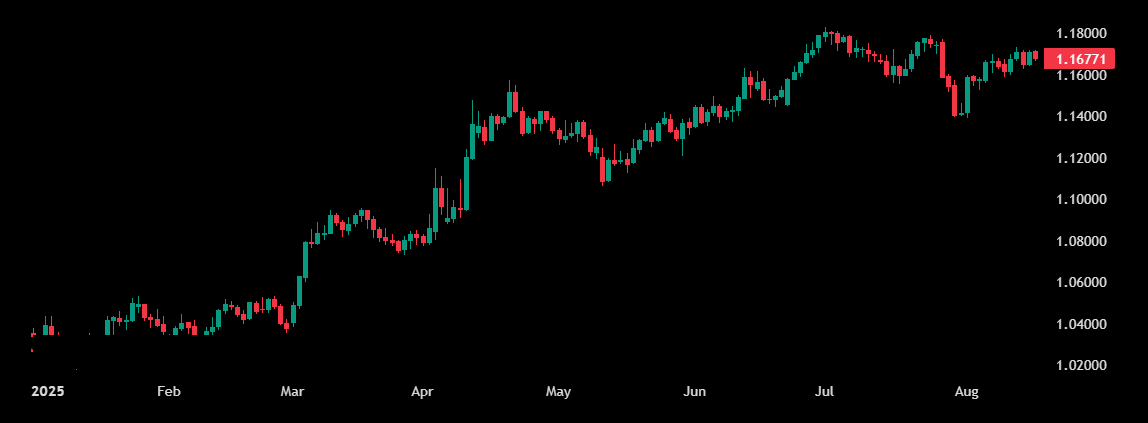
· The euro’s recent upside swing hit a snag Monday as the EURUSD pair briefly pierced $1.1705 before fading under $1.1680, ricocheting off a well-defined descending resistance line. Forex bros are now asking: is this just a breather, or the start of another stall?
· The euro’s rejection at $1.17 marks the third touchpoint on the downtrend line, a level technicians have been eyeing to pile their shorts. The first rejection came July 1 at $1.1830, followed by a second at $1.1770 on July 28, and now today’s touch-and-go reversal.
· A move through $1.17 with conviction could open up a run toward $1.18, but as long as that line holds, the bias skews back toward range-trading or a corrective pullback.
Geopolitics vs. Monetary Policy
· For euro bulls, the question is whether the broader uptrend still carries enough momentum to break the sellwall.
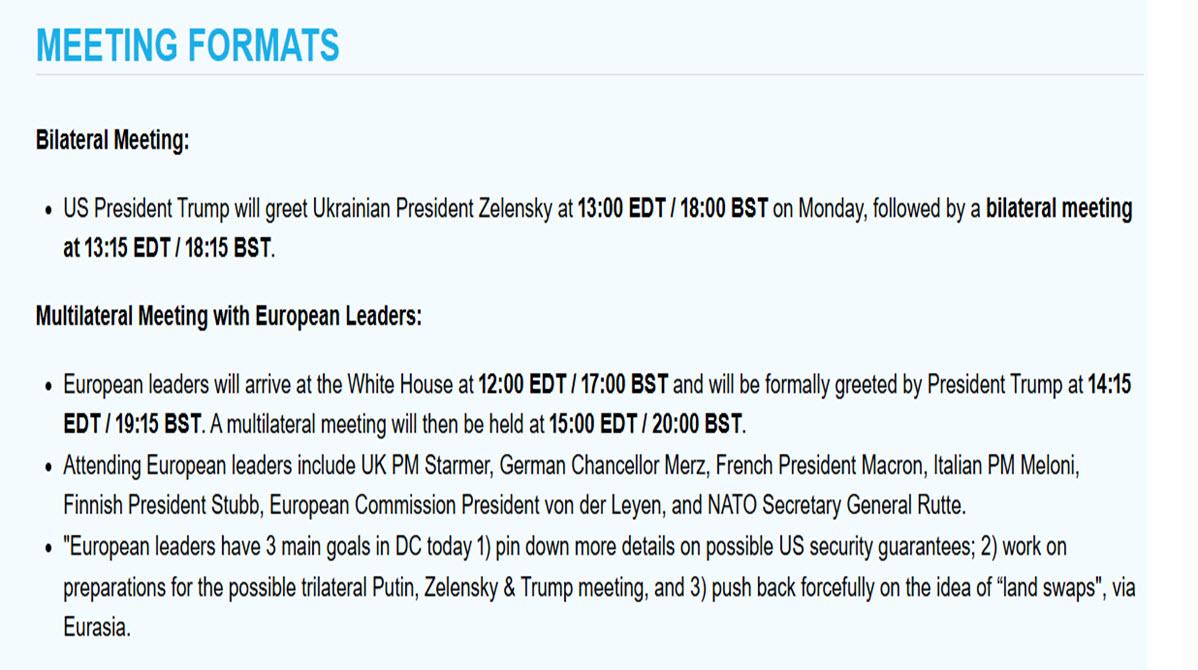
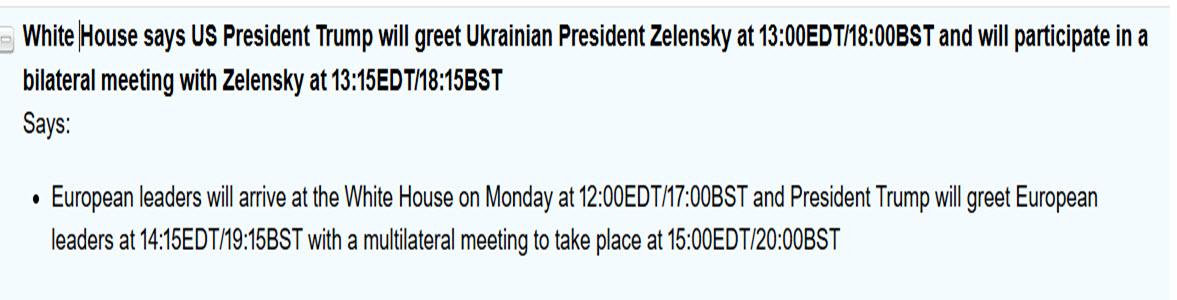
· Monday’s headlines aren’t just about charts. Ukrainian President Volodymyr Zelensky will be at the White House, backed by European leaders. The goal? Press Donald Trump for security guarantees in a push to end the war. A breakthrough could reshape risk sentiment across FX markets.
· Later in the week, Federal Reserve Chair Jay Powell will take the stage at Jackson Hole on Friday, where traders expect clues on September’s policy move. With markets pricing in a near-95% chance of a Fed rate cut, any hint of hawkish hesitation could revive the dollar.
Bulls vs. Bears at the Line
· Until then, macro risks loom large over technical setups — meaning breakouts could come on headlines, not candles. The euro is still up 13% in 2025, its strongest yearly performance against the dollar in recent years. Momentum and rate-cut bets give bulls a case.
· Bears counter with resistance levels, geopolitical uncertainty, and the risk Powell pushes back on market easing expectations.
· The takeaway? The $1.17 level is the battlefield. The longer the euro-dollar stalls below it, the heavier the resistance grows. But a decisive break — especially with dovish Fed signals — could reset the trend higher.
 August 18, 2025 at 2:29 pm #29180August 18, 2025 at 2:26 pm #29179
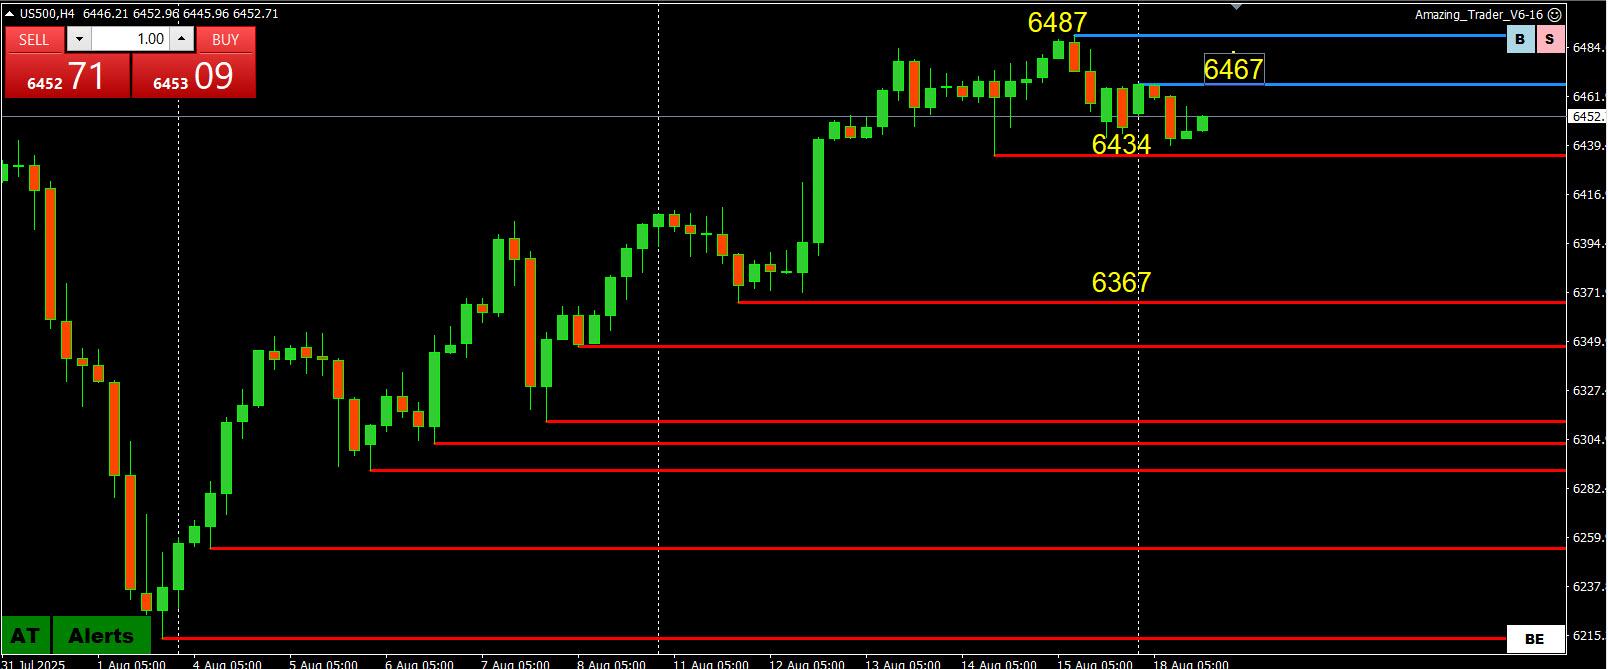
S&P 500 Opens Lower, With Fed, Ukraine Meeting in Focus
Stocks were mostly flat Monday morning, a muted start to a Federal Reserve-centric week.
Minutes from the Fed’s July meeting will be released Wednesday, shedding light on policymakers’ deliberations as they kept interest rates on hold. Later in the week, central bankers will gather in Wyoming for the annual Jackson Hole symposium, with Fed Chair Jerome Powell slated to speak Friday.
Powell’s remarks will be scrutinized for insight into the Fed’s thinking ahead of its September meeting. A widening gap between shorter- and longer-dated U.S. borrowing costs underscores investors’ conviction the central bank will cut rates, as President Trump has pushed for.
Before then, Trump is set to meet with Ukrainian President Volodymyr Zelensky and European leaders in Washington. Monday’s meeting follows Trump’s summit Friday with President Vladimir Putin, after which he advised Ukraine to strike a peace deal with Moscow.
Away from geopolitics, earnings are due this week from Lowe’s, Target and Walmart. The big-box retailers will effectively wrap up a largely upbeat earnings season.
In recent trading:
Major U.S. stock indexes were mixed. The Dow hit a new intraday high Friday.
Treasury yields edged down, with the 10-year yield at around 4.32%.
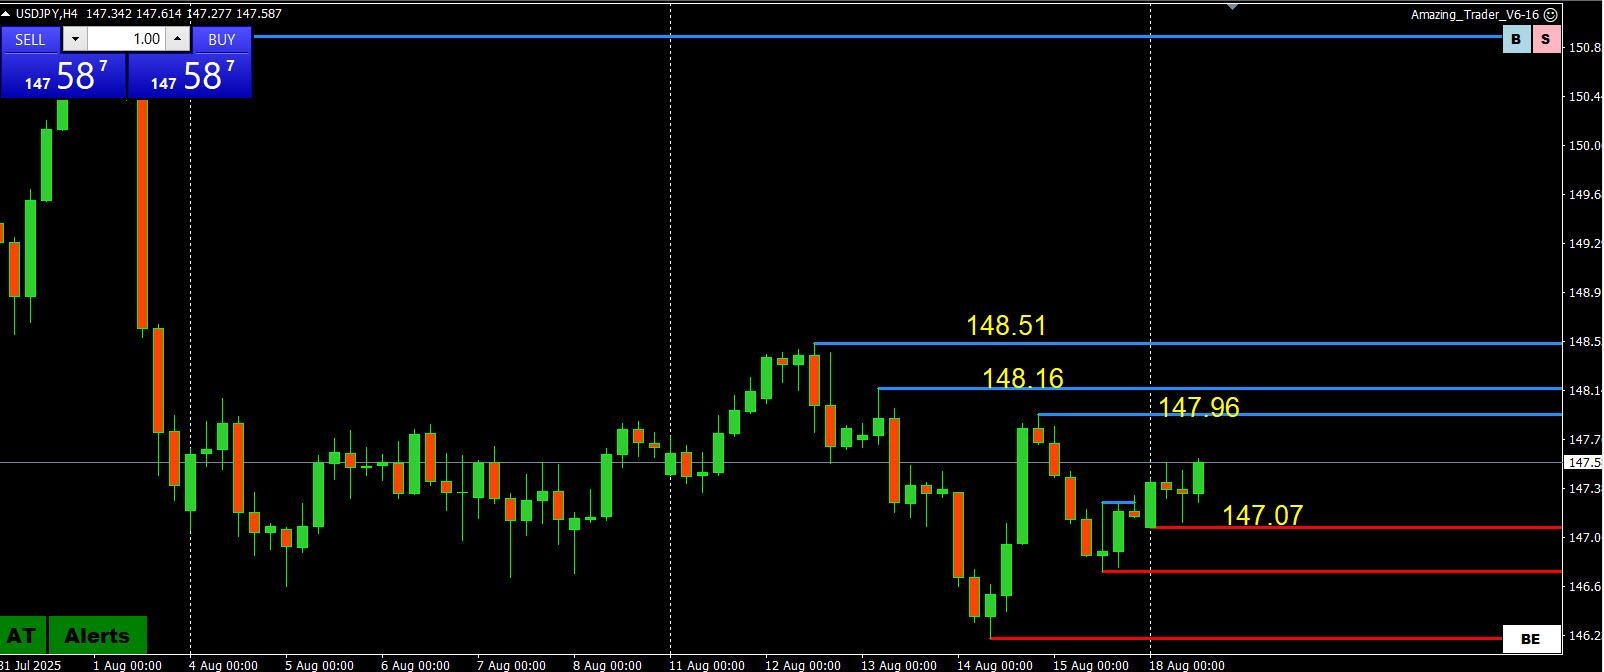
The dollar strengthened against the yen and the euro.
Bitcoin prices dropped toward $115,000.
European stock indexes fell. Data showed European Union exports to the U.S. dropped in June to the lowest level since 2023.
Asian indexes largely rose. Benchmarks in Japan, Taiwan and Australia all closed at new records. The Shanghai Composite settled at its highest in almost a decade
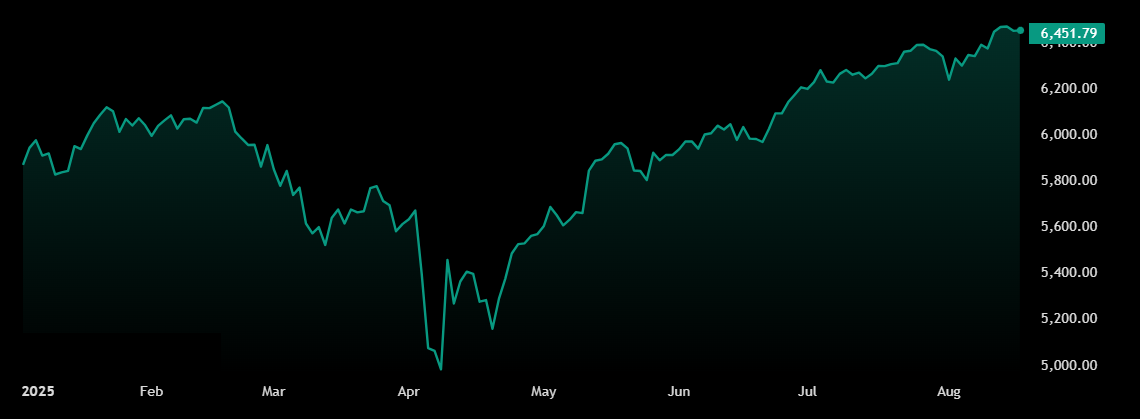
SPX Chart
 August 18, 2025 at 1:54 pm #29178August 18, 2025 at 1:26 pm #29177
DLRX 98.067 at 9:21
personally I dont assign much of price-moving potential significance to the zelensky show.
If there should be any “positive / negative” it is for the weapons manufacturers whose “goods” go or not anymore to Ukraine – and that only on some other time frame than 5 min chartEURO 1.1672
S 1.1650 Res 1.1750
I am biased UP if only on intra – central bank relative prospects of “easing”Lagarde yaks a couple of times (wed and saturday) this week , as does jerome on friday at 10am
August 18, 2025 at 1:07 pm #29176August 18, 2025 at 12:46 pm #29175August 18, 2025 at 12:37 pm #29174August 18, 2025 at 12:27 pm #29173XRPUSD – Ripple
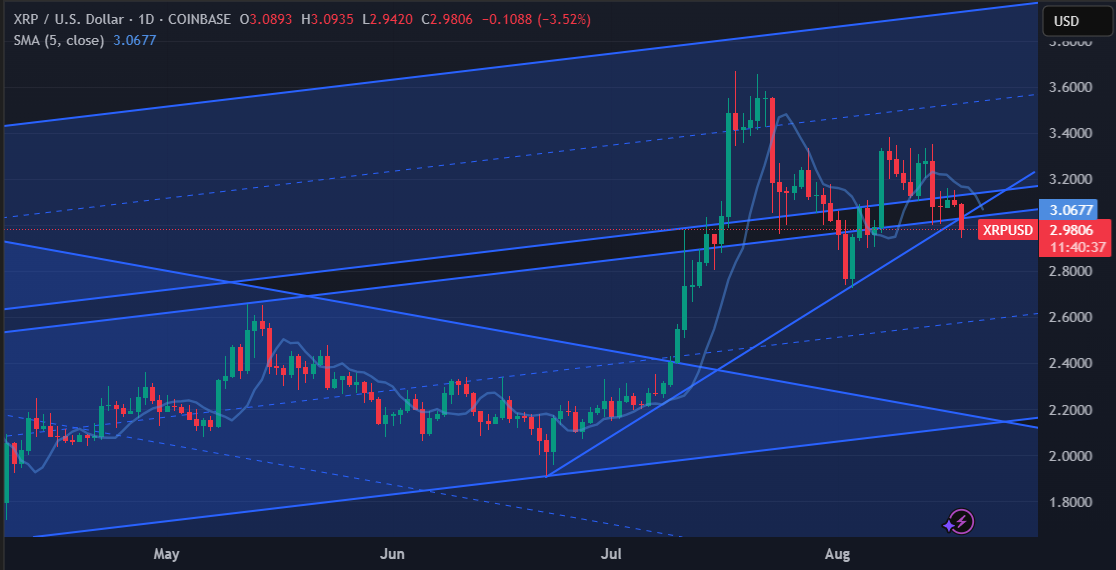
In one move XRP lost two important supports today
3.0290 – Channel support line and Uptrend one…
Now that support should act as a resistance, unless XRP manages to go back above it today or latest
Tomorrow.
Resistances:
3.0290, 3.0935 & 3.1280
Supports:
2.9420, 2.9000 & 2.7275
If supports lost, road is open for 2.1500
 August 18, 2025 at 12:26 pm #29171August 18, 2025 at 12:18 pm #29169
DAX Index
Supports: 24.245, 24.150 & 23.945
Resistances: 24.395, 24.535 & 24.640
Intraday – Dax is currently consolidating as long as it stays above 24.150
Anything below it might turn into correction
It has to push above 24.315 in order to continue Up.
Targets up there are 24.925 & 25.135
However, if it loses 24.150 two targets on the down side are:
23.740 & 23.600
 August 18, 2025 at 12:06 pm #29168August 18, 2025 at 11:50 am #29167August 18, 2025 at 11:31 am #29166
President Trump claimed Sunday that Ukrainian President Volodymyr Zelensky could bring the nation’s war with Russia to a halt “almost immediately” if he’s willing to make two major concessions.
Trump called for Ukraine to drop its bid to join the North Atlantic Treaty Organization (NATO), a demand long made by Russia, and also said there would be “no getting back” Crimea — signaling to the nation to accept Russia’s illegal 2014 annexation of the region during the Obama administration. NY Post
August 18, 2025 at 10:19 am #29164August 18, 2025 at 9:59 am #29163August 18, 2025 at 9:58 am #29162August 18, 2025 at 9:48 am #29161Zelensky “can end the war with Russia almost immediately, if he wants to, or he can continue to fight,” “Remember how it started. No getting back Obama-given Crimea (12 years ago, without a shot being fired!), and NO GOING INTO NATO BY UKRAINE. Some things never change!!!” – Trump on his Truth Social network on Sunday.
August 18, 2025 at 9:47 am #29160EURUSD
Geopolitics more than technical dominating to start the week with EURUSD backing off as longs taken in the hope of a Ukraine-Russia ceasefire unwind.
With that said, all we have to look at are charts ahead of the Zelensky Trump meeting are charts
EURUSD hit a wall at 1.1715
1.1671 blocks 1.1646-50 and 1.1631 and 1.1590
On the upside, 1.1715 blocks 1.1724. 1.1730
Surprise would be if Zelensky caves in to Russian demand but any glimmer of a willingness to compromise would be a positive.
EURUSD 1 HOUR CHART
 August 18, 2025 at 9:45 am #29159August 18, 2025 at 9:29 am #29158August 18, 2025 at 9:20 am #29157
Using my platform as a HEATMAP shows,,,
.. the dollar trading mixed in a cautious start to the week awaiting the meeting between Zelensky (plus European and UK leaders and Trump to discuss Russia’s proposal to end the war. EUR us an underperformer as some longs taken in hope for a ceasefire unwind.
1. NZD
2. CAD
3. AUD
4. CHF
5. GBP
6. JPY
7. EUR
 August 18, 2025 at 2:38 am #29156
94% of XRP holders are in profit: Has the price topped?
• XRP’s rally to $3 has pushed 94% of supply into profit, a level that historically marked macro tops.
• XRP is in the “belief–denial” zone, onchain metrics show, echoing peaks in 2017 and 2021.
XRP’s XRPUSD rally to over $3 has pushed nearly 94% of its circulating supply into profit, Glassnode data shows.
As of Sunday, XRP’s percent supply in profit was 93.92%, underscoring strong investor gains as the cryptocurrency rallied by more than 500% in the past nine months to $3.11 from under $0.40.
90%> supply in profit is usually an XRP macro top Such high profitability has historically signaled overheated conditions. In early 2018, over 90% of holders were in profit just as XRP peaked near $3.30 before a 95% price reversal.
A similar setup appeared in April 2021, when profitability levels above 90% preceded an 85% crash from the top near $1.95. XRP’s NUPL mirros 2017 and 2021 price peaks XRP’s Net Unrealized Profit/Loss (NUPL) is further signaling top risks.
The indicator, which tracks the difference between unrealized gains and losses across the network, has entered the “belief–denial” zone, a phase historically observed before or during market tops. XRP price is consolidating inside a descending triangle after rising above $3. The pattern, typically bearish, is defined by lower highs against horizontal support near $3.05.
Earlier this month, XRP briefly broke below the support in a fakeout, only to rebound back inside the structure. August 18, 2025 at 1:04 am #29155
Bitcoin risks new 2025 correction as BTC price uptrend starts 7th week
Key points:
• Bitcoin has enjoyed six weeks of its latest “price discovery uptrend” — but a correction is now due.
• Analysis shows that in previous halving cycles, BTC price tends to halt its second uptrend after five to seven weeks.
• A new dip now would still allow fresh all-time highs in Q4.Bitcoin risks keeping its recent $124,500 all-time high in place — if it follows historical patterns. Historically, Bitcoin Price Discovery Uptrend 1 tends to end between Week 6 & 8 of its uptrend. Whereas in Price Discovery Uptrend 2, Bitcoin tends to end its uptrend between Week 5 & 7.
Week 7 of Price Discovery Uptrend 2 begins tomorrow.
A linked chart from earlier in the year shows a potential upside target for the second uptrend at just below $160,000.
In 2025, Bitcoin’s first corrective phase took the price from near $110,000 to under $75,000 — a roughly 30% drawdown not uncommon in previous halving cycles.
Data from monitoring resource CoinGlass shows BTCUSD up 2.1% in August, already slightly above the 1.8% average. September, by contrast, has on average delivered a 3.8% price drawdown. August 18, 2025 at 1:01 am #29154
THIS WEEK’S MARKET-MOVING EVENTS (all days local)
The upcoming week in global economics is set to reveal how various regions are responding to shifting monetary policy, tariffs, and weakening trade. In Asia-Pacific, the Reserve Bank of New Zealand is widely expected to cut rates by 25 basis points as inflation eases and unemployment rises. Japan’s trade and machinery orders signal slowing external demand, especially in autos, while inflation is expected to cool slightly due to energy subsidies and a stronger yen. China is keeping its loan prime rates unchanged, suggesting a wait-and-see approach amid recent export growth.
In Europe, the first real data showing U.S. tariff impacts—especially on Switzerland and possibly Germany—will come through PMI surveys and GDP results. Germany’s economy is forecast to shrink slightly in Q2, confirming continued stagnation. Meanwhile, in the U.S., all eyes are on Fed Chair Jerome Powell’s speech at Jackson Hole. He must navigate internal dissent at the Fed, political pressure from the Trump administration, and unclear signals from inflation and labor market data. The markets await clarity on whether another rate cut is imminent as inflation ticks up due to tariffs, but the Fed’s message remains cautious and data-driven…Econoday
 August 18, 2025 at 12:41 am #29153
 -
AuthorPosts









- You must be logged in to reply to this topic.
Search
© 2024 Global View