
-
AuthorSearch Results
-
March 25, 2024 at 9:57 pm #3605
In reply to: Forex Forum
AUDUSD 4-HOUR CHART – Consolidation or Correction?
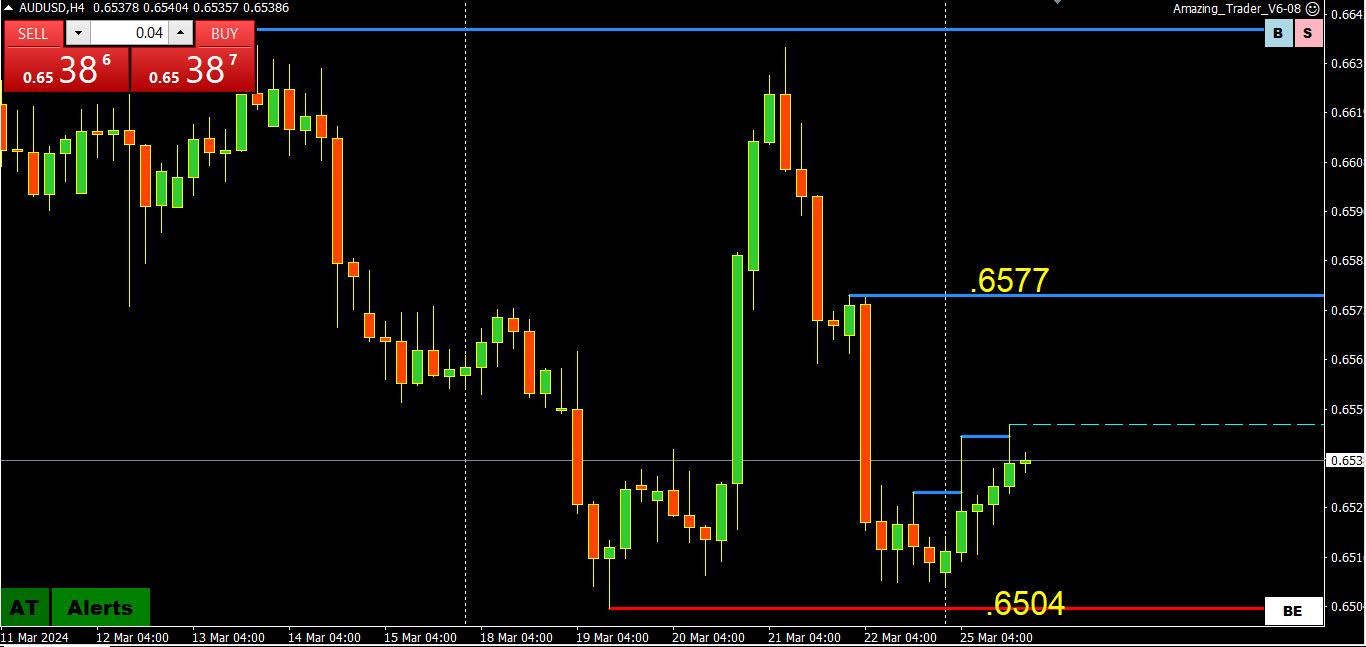
The market has started out in typical pre-Easter week fashion with some position adjustments dominating.
AUDUSD failure to test .6500 has seen a modest retracement that would need to take out .6577 to give it some legs.
Otherwise, expect some choppy consolidation trading while within .6599094 and .6577.
March 25, 2024 at 6:03 am #3560In reply to: Forex Forum
USDCHF Analysis: Consolidation and Support Levels
USDCHF has maintained its position above the ascending trend line on the 4-hour chart, indicating that the pair is still in an uptrend starting from 0.8729. The upward movement from 0.8729 has reached as high as 0.9019.
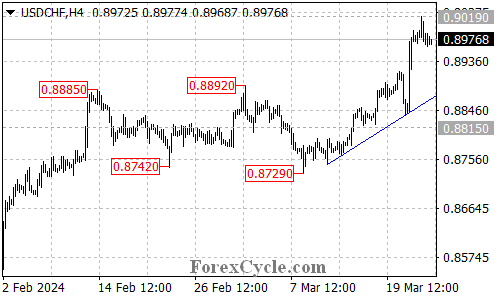
The subsequent retracement from 0.9019 suggests that the pair is currently undergoing a period of consolidation for the uptrend. It is expected that the pair will trade within the range of 0.8900 and 0.9019 in the coming days.
If the support level of 0.8900 remains unbroken, the bullish trend could be expected to resume, with a breakout above the 0.9019 resistance level potentially triggering another upward movement towards 0.9100 and 0.9180.
On the downside, a breakdown below the 0.8900 support level could indicate that a longer period of consolidation for the uptrend starting from 0.8729 is necessary. In this scenario, the pair would likely find support at the rising trend line on the 4-hour chart.
It is important to note that only a decisive break below the trend line support would suggest the potential completion of the current uptrend.
March 24, 2024 at 4:26 pm #3552In reply to: Forex Forum
USDJPY 4 HOUR CHART – CONSOLIDATION?

With Goldman raising its 3-month USDJPY forecast (see prior post), let’s take a look at a 4-hour USDJPY chart.
With 151.90 remaining the major resistance (shown on a daily chart), currently protected by 1.5181-86, the current range is consolidating between 150/152, with 151 acting as a neutral midpoint.
The key support is at 150.26. above it keeps 151.90 in play, a stronger risk if 151.00 can become support.
The reason that I looked at the range as consolidation is that the upcoming week is not a normal one
Pre-Easter week and a 4-day long weekend break
A week normally dominated by position adjustment rather than aggressive positioning
Light economic calendar, highlight Friday’s US PCE report
Month/quarter end for many on Thursday with markets closed on Friday-Monday
The actual quarter end is Friday
March 21, 2024 at 12:31 pm #3409In reply to: Forex Forum
USDJPY Analysis: Pullback and Support Levels
USDJPY has experienced a retracement from 151.81 to a low of 150.26, with the pair now testing the support of the ascending trend line on the 4-hour chart.

If the trend line support remains unbroken, the current pullback from 150.26 could be interpreted as a period of consolidation for the uptrend starting from 146.47. In this scenario, there is still potential for further upward movement towards the 170.00 area after the consolidation phase.
The key support level to monitor is at 150.26. If the price falls below this level, it could indicate the potential completion of the uptrend that initiated from 146.47, with the next target set at the 149.00 area.
March 20, 2024 at 8:46 pm #3381In reply to: Forex Forum
March 20, 2024 at 8:06 pm #3380In reply to: Forex Forum
XAUUSD 4 HIOUR CHART

I was asked to post an XAUUSD chart so here goes as well…
The bounce from solid 2145 support has broken 2172, suggesting an end to the retracement.
However, as the chart shows there is still layers of resistance *blue) ahead of the 2195 key high.
Looking at this chart, support is at 2164-72, which needs to hold to keep the focus on 2195 and away from 2145.
March 20, 2024 at 6:00 pm #3369In reply to: Forex Forum
To give some perspective to the importance of who heads the SNB following Jordan who was a strong advocate of currency management, in 2022 the SNB sold foreign currencies worth 22.3 bio CHF. In 2023 under Jordan’s strong CHF policy they sold 132.9 bio chf of foreign currencies (buying CHF). Any step back from the strong CHF policy should have a super size impact….
March 20, 2024 at 9:39 am #3323In reply to: Forex Forum
March 20, 2024 at 4:48 am #3320In reply to: Forex Forum
USDJPY Analysis: Breakout and Potential for Further Upside Movement
USDJPY has successfully surpassed the 150.88 resistance level, with the upward movement from 146.47 extending to a peak of 151.33.
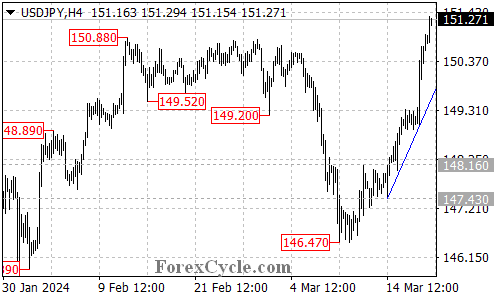
As long as the price remains above the ascending trend line on the 4-hour chart, there is still potential for additional upward movement in the upcoming days, with the next target estimated around 160.00.
The initial support level to monitor is at 150.35. If the price breaks below this level, it could suggest a period of consolidation for the uptrend starting from 146.47, with the pair likely finding support at the rising trend line.
A decisive break below the support provided by the trend line could indicate the potential completion of the current uptrend.
March 19, 2024 at 9:15 pm #3314In reply to: Forex Forum
March 19, 2024 at 5:51 pm #3302In reply to: Forex Forum
March 17, 2024 at 2:37 pm #3137In reply to: Forex Forum
March 16, 2024 at 11:52 am #3101In reply to: Forex Forum
March 14, 2024 at 10:40 am #2979In reply to: Forex Forum
Next up
US RETAIL SALES (THU): US retail sales are expected to rise +0.3% M/M (prev. -0.8%), and the ex-autos measure is seen rising +0.3% M/M too (prev. -0.6%). Bank of America’s Consumer Checkpoint update for February notes that weather conditions were largely to blame for the weakness in January, but where the weather was better, spending was resilient, and in the later part of January, total card spending per household rebounded across the country. The bank notes that while consumer confidence has rebounded recently, it remains relatively weak given the consumer has been resilient over the last year and the labour market has been solid, likely a result of ‘sticker shock’ from higher prices. But ahead, BofA says that “as the rate of inflation comes down, this sticker shock should begin to fade, particularly as aftertax wages and salaries growth remains healthy for low and middle-income households in our data,” adding that “consumers’ savings buffers remain elevated and shows no significant sign that people are tapping into their longer-term retirement savings.”Newsquawk.com
March 13, 2024 at 5:43 pm #2958In reply to: Forex Forum
XAUUSD 1-HOUR CHART

With the retracement holding the pivotal 2150 level, XAUUSD is trying to make another run at the upside.
However, to challenge the high, 2182-86+ needs to trade. Otherwise consolidation within 2150-2195 until eirther side breaks.
In the meantime expect support as long as 2161-66 and the trendline holds.
March 13, 2024 at 8:26 am #2921In reply to: Forex Forum
AUDUSD Analysis: Uptrend Continuation and Key Levels
AUDUSD continues its upward trajectory from 0.6477, with the recent retracement from 0.6667 likely representing a period of consolidation within the uptrend.
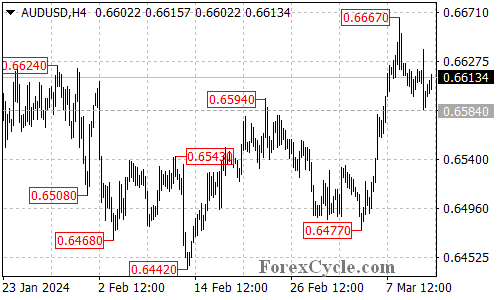
As long as the support at 0.6584 remains intact, the uptrend is anticipated to resume, potentially leading to a further ascent towards the 0.6750 region.
The initial resistance level to monitor is at 0.6640. A successful breakout above this level could propel the price towards testing the 0.6667 resistance. Subsequent breakthrough above 0.6667 would set the stage for a push towards 0.6750.
Conversely, a breakdown below the 0.6584 support level would signal a potential completion of the upward movement at 0.6667, potentially resulting in a decline towards the 0.6500 level.
March 12, 2024 at 6:47 pm #2908In reply to: Forex Forum
Monedge, you brought back some memories 😀
It was mid 90’s and I was on the desk of a Middle Eastern bank – off shore outfit ..
We had a Forex dealing desk , and had regular clients – HNWI – we called them High Net worth Individual Suckers , but some of them became good friends.
Between tens of different stories ( each man had a story to tell 😀 , two cannot be forgotten :
One had a Nickname – Goddammit , I Should Sold it, and the other was called behind his back – BOBBY , BUT WHY NOW ??
Such a fond memories 😀
March 12, 2024 at 3:36 pm #2887In reply to: Forex Forum
March 12, 2024 at 1:51 am #2858In reply to: Forex Forum
AudCad is targeting 8930/40 area to see what is there. If it fails it will dump straight to8890. On the buy side from 8808 and riding locked in. In activity like this it likely fails if it gets up there without solid supporting conditions including fundamentals. Nobody else is posting and Monedge is very active so why not. If you are new to this, some of us currency traders are very active.
March 11, 2024 at 5:00 pm #2845In reply to: Forex Forum
EURUSD 4-Hour Chart – Retracement or Consolidation?

The market is trying to retrace but pressures only build if 1.0917 is firmly taken out (so far just briefly). If broken there is little on this chart until 1.0867 (suggests 1.09 will be important). Needs to stay below 1.0946 to keep a retracement risk alive
On the upside, if the retracement fails to build steam, look for consolidation unless Friday’s high at 1.0981 is taken out.
Expect cautious trading ahead of the next key event risk, US CPI on Tuesday.
What Is Consolidation?
Consolidation in technical analysis refers to an asset oscillating between a well-defined pattern of trading levels. Consolidation is generally interpreted as market indecisiveness, which ends when the asset’s price moves above or below the trading pattern…. Investopedia
In simple terms, it means trading within well-defined support and resistance levels until either side breaks.
March 11, 2024 at 4:08 pm #2842In reply to: Forex Forum
March 11, 2024 at 10:35 am #2765In reply to: Forex Forum
USDJPY Technical Analysis: Key Levels and Potential Scenarios
USDJPY’s downward momentum from 150.88 has extended to a low of 146.47, currently testing the support level at 145.89.

The initial resistance level is located at 147.25. As long as this resistance level remains intact, the downside move is likely to persist. A potential breakdown below the 145.89 support level might trigger further downside movement towards the 144.30 area.
On the upside, a decisive breakout above the resistance level at 147.25 would suggest that consolidation for the downtrend is underway, with the pair potentially encountering resistance around the 148.00 region.
March 8, 2024 at 3:09 pm #2708In reply to: Forex Forum
Long Usd vs Singapore Dollar and Mexican Peso filled almost at absolute bottom post data, will hold for fun. At times I trade crosses approaching data to stay out of wild activity. I’m riding a Gbp/Chf from Wednesday at 1.2225 and am likely to exit any time here, see it settling around 1.1250 around end of day likely. Light positions. Bailed last night on Aud and Gbp sells with a squeaky gain, didn’t look good at all, those were testers. Still see Usd pulling up a bit overall but obviously the dynamic has shifted to the sell side.
March 8, 2024 at 11:04 am #2696In reply to: Forex Forum
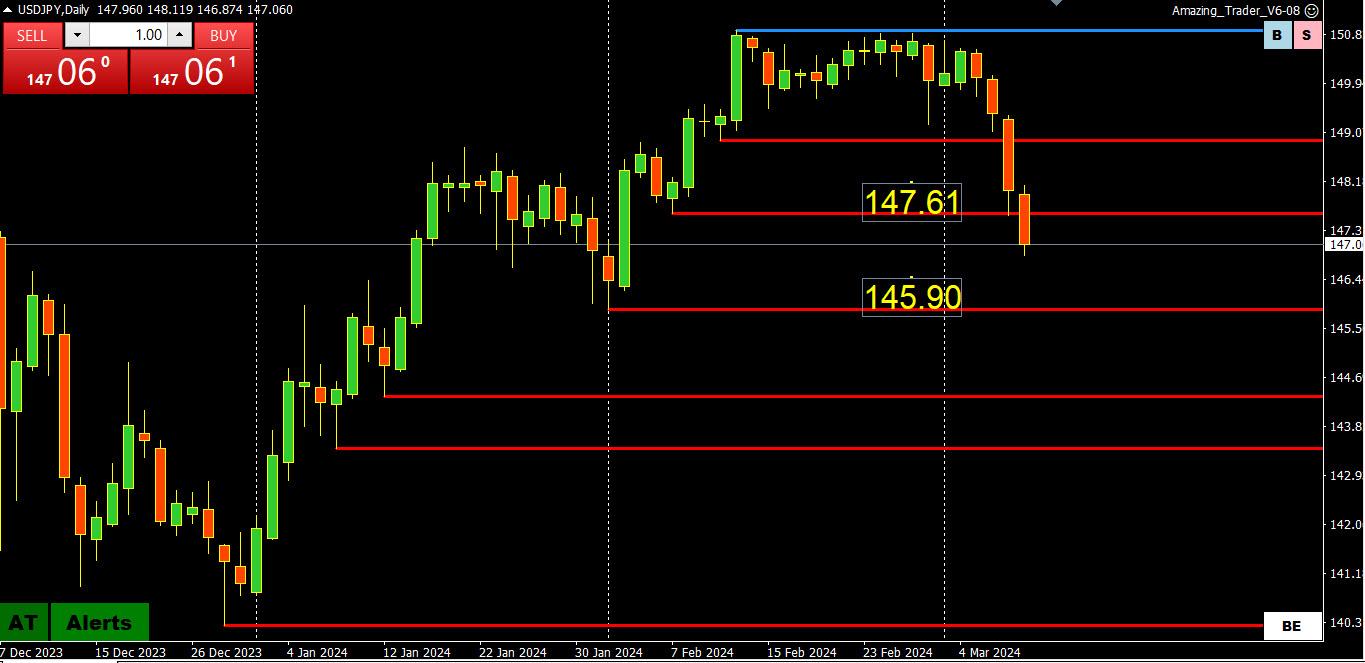
USDJPY DAILY CHART: MELTDOWN
Red AT support lines are being broken like Swiss cheese in a market likely thinned awaiting the US jobs report today.
With consolidation around 148 failing to last, the break of 147.61 leaves a void until 145.90.
On the upside, resistance is now between 147.61=148.00. Only back above 148 would deflect the risk
From the earlier Reuters article, suggests a limited USDJPY upside ahead of the BoJ meeting:
Bank of Japan (BOJ) officials have begun ramping up their hawkish rhetoric and shown increasing confidence that the Japanese economy was moving towards the BOJ’s 2% inflation target, just ahead of the central bank’s March 18-19 policy meeting.
March 6, 2024 at 1:01 pm #2539In reply to: Forex Forum
10-yr 4.16% at 6:57 AM EST
according to jeff cox:
* Fed Chair Jerome Powell heads to Capitol Hill on Wednesday with markets intent on getting more clarity about how the central bankf plans on proceeding with monetary policy this year.* Central to the question of how the Fed acts from here on out is its view on inflation and how Powell expresses that.
* Powell’s testimony before Congress comes at a ticklish time for markets: After breaching historic highs, major stock averages have sold off this week.
Fed Chair Powell testifying to House on Wednesday. What investors are expecting
March 4, 2024 at 11:24 pm #2412In reply to: Forex Forum
March 4, 2024 at 1:38 pm #2382In reply to: Forex Forum
March 4, 2024 at 11:14 am #2373In reply to: Forex Forum
USDCHF Analysis: Consolidation Phase Continues, Key Levels to Monitor
Following a touch of the 0.8885 resistance level, USDCHF retraced from 0.8892 and has since been consolidating for the uptrend originating from 0.8550.

As long as the critical support level at 0.8742 remains intact, the uptrend is likely to resume. A breakthrough of the 0.8892 resistance level could propel the price towards the 0.9000 area.
Conversely, a breach below the 0.8742 support level would signal the completion of the upward movement at 0.8892. In such a scenario, the next target area would be around 0.8600.
March 1, 2024 at 12:49 pm #2308In reply to: Forex Forum
March 1, 2024 at 11:24 am #2297In reply to: Forex Forum
EURUSD Analysis: Key Support and Resistance Levels to Watch
The EURUSD pair is currently testing the 1.0789 support level once again. A breakdown below this level would suggest that the upside move from 1.0694 has concluded at 1.0887. In such a scenario, the next target levels would be at 1.0750, followed by 1.0694.

However, if the 1.0789 support level holds, the pullback from 1.0887 could potentially be a consolidation phase for the uptrend from 1.0694. In this case, another rise towards the 1.0950 level is still possible after the consolidation.
The initial resistance level is at 1.0840. A breakthrough of this level could potentially take the price to the next resistance level at 1.0887. Above this level, the price could aim for 1.0950.
-
AuthorSearch Results
 Gold is in a buy mood to reach 2161.70, as confirmed.
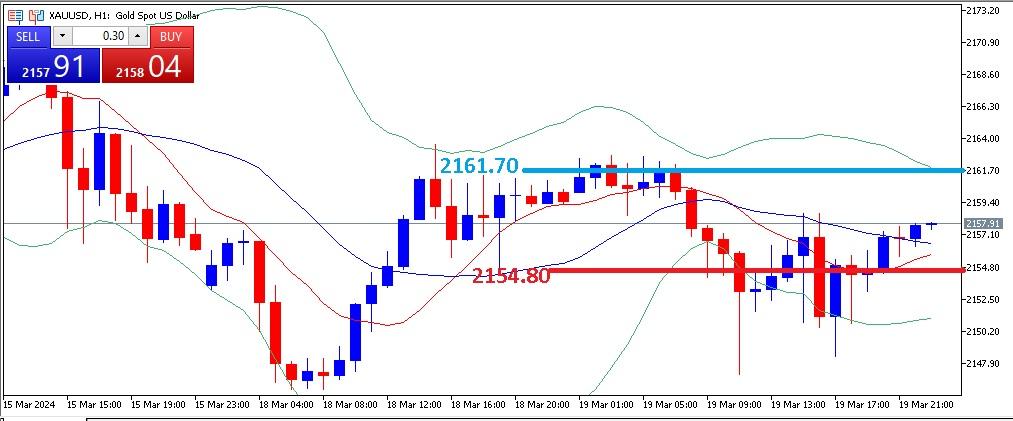 tp at it.
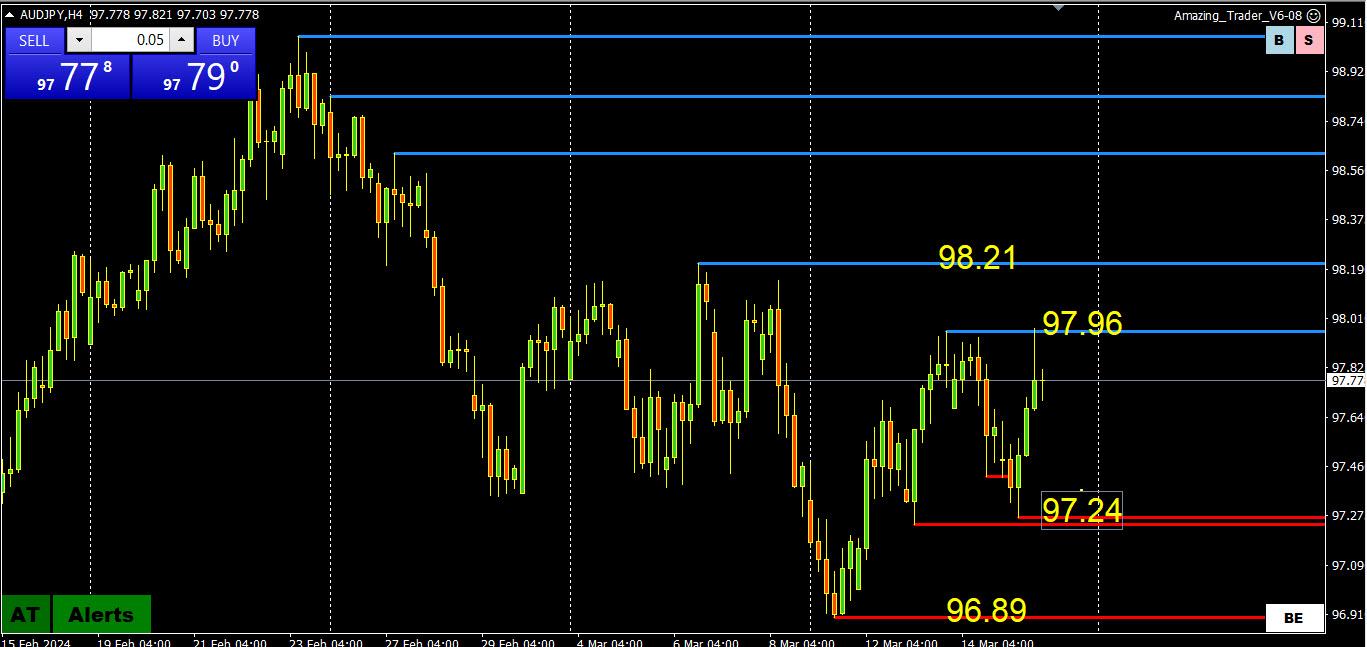
 GBPUSD signal for the coming week:
 XAUUSD 1 HOUR CHART


Search
© 2024 Global View