

Forum Replies Created
-
AuthorPosts
-
THIS IS ONE OF OUR CLASSIC BLOG POSTS ON WHAT IT TAKES TO BE A WINNING TRADER RATHER THAN A LOSING ONE

A look at the day ahead in U.S. and global markets from Mike Dolan
A sharp retreat in oil prices and a rare joint warning from major economies against excessive dollar strength have helped calm restive markets just as Big Tech earnings start to hit.
Morning Bid: Recoiling oil and dollar sow calm as tech earnings loom
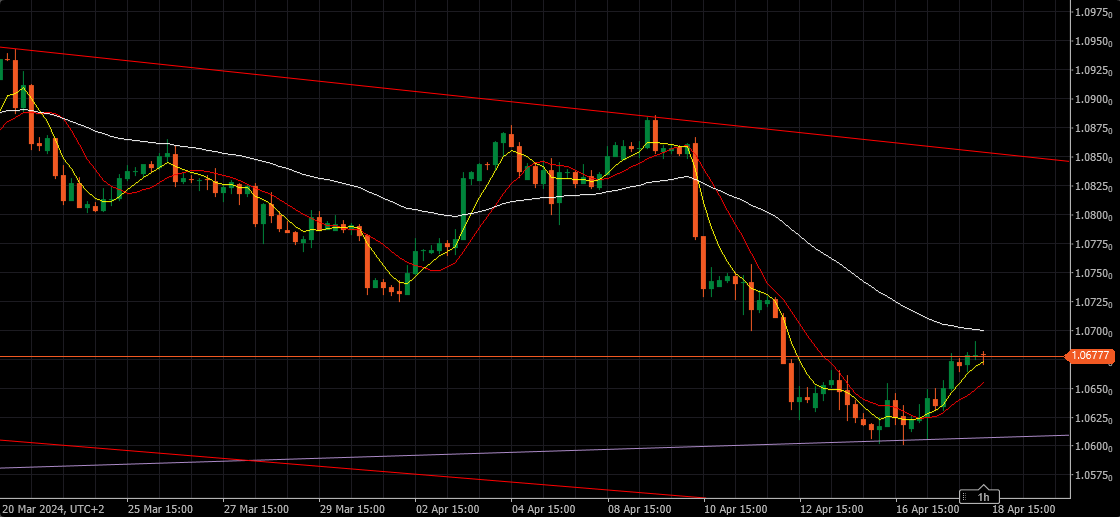
EURUSD 4h
Resistance at 1.07000 & 1.07250
Support at 1.06700 & 1.06500
Told you that this is going to happen. So what now ?
Two options:
– Break above the EMA 50 and test of 1.07500 & even 1.07750
– Meeting with 1.07250 and sudden drop , followed by the break of 1.06000 and continuation of the steep downtrend
Watch for Initial Jobless Claims today and bunch of other US data tomorrow
XBRUSD 4 HOUR CHART (Brent CFD)
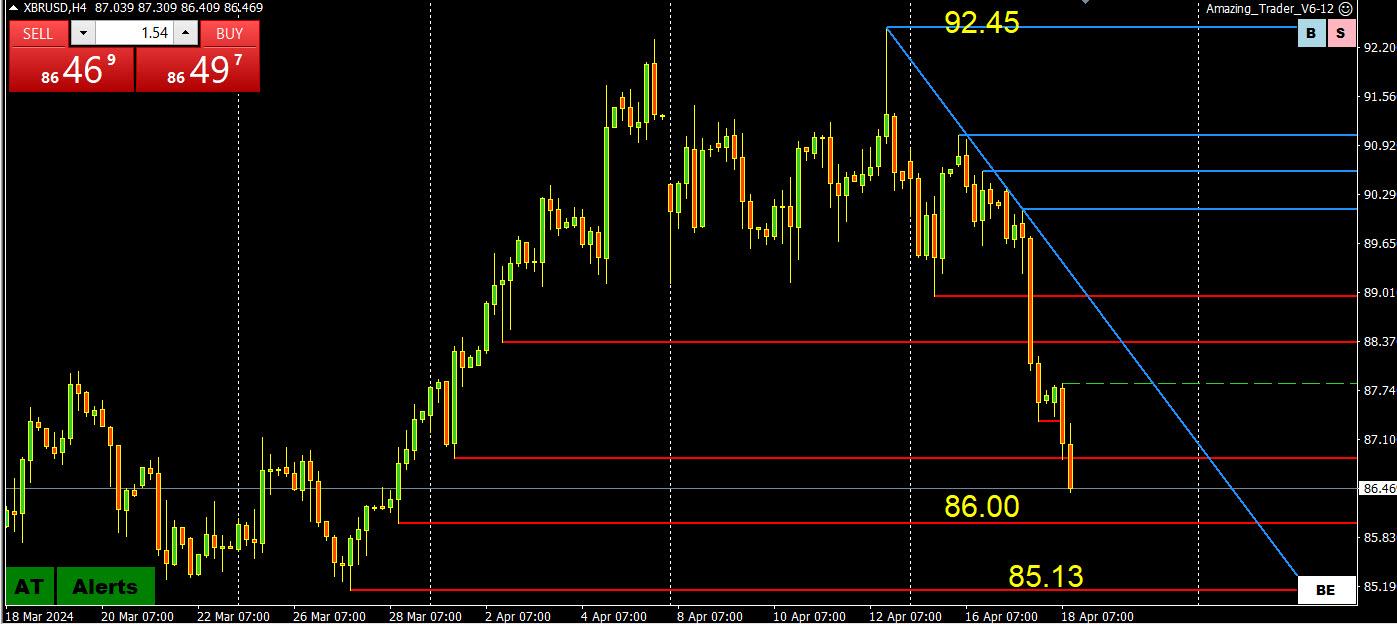
Let’s look at the price action in crude following the spike high on geopolitical events and subsequent retreat despite ongoing concerns..
With the focus on interest rates and sticky inflation, the price of energy will play a role as central bank decisiosn on when or how much to cut interest rates.
This chart shows potential for an exhaustion on the upside but would probably have to take out the $85 level to suggest more scope on the downside.
Reminder this is a CFD price feed and levels may differ from what your broker shows. So look at the chart patterns and line them up with your charts.
EURUSD 4 HOUR CHART – JYST A CORRECTION?
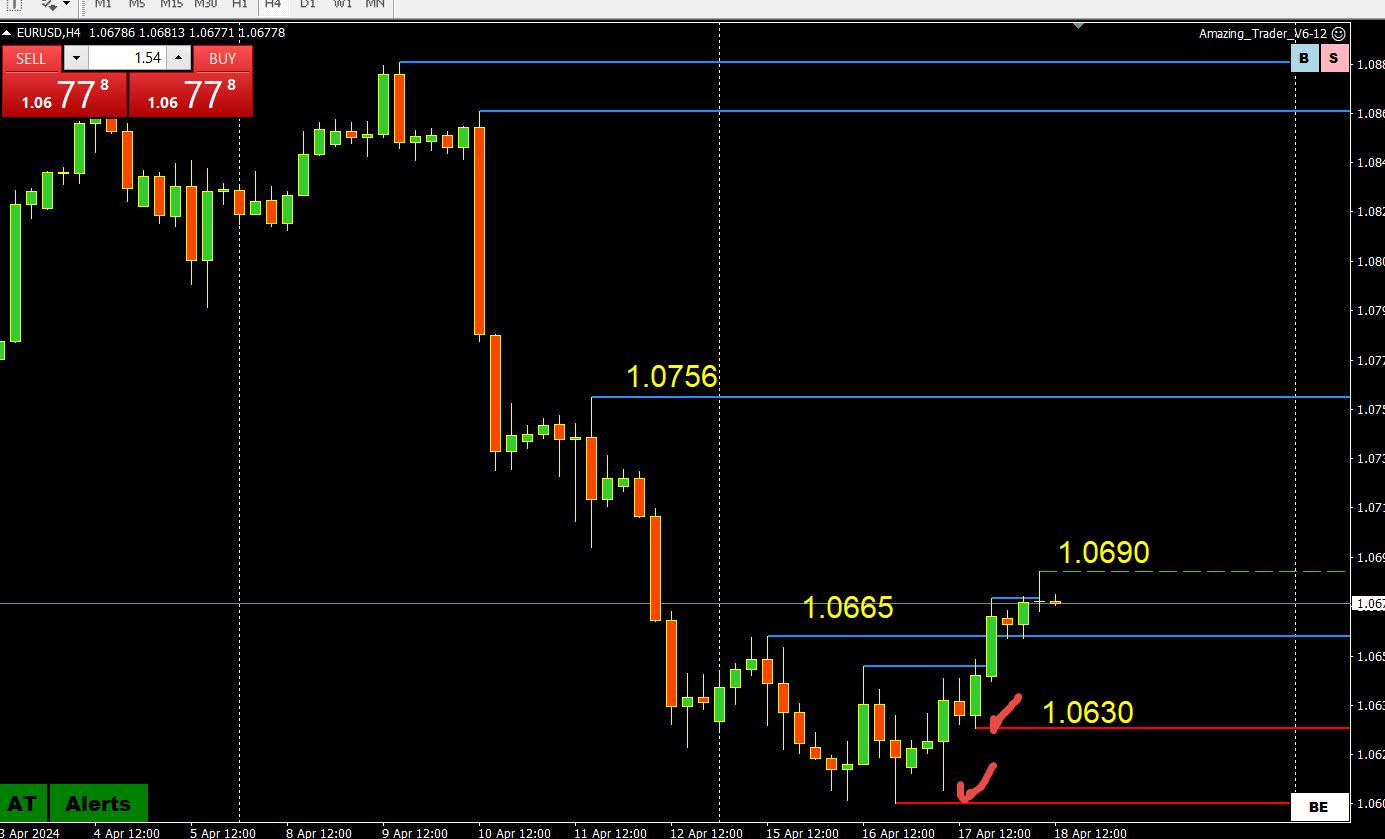
As I pointed out, there appeared to be an invisible hand protecting 1.06, which in turn has seen EURUSD correct.
The question then is does the correction have more legs?
On one hand, what has changed is there are no key stops to go after until below 1.06, currently protected by 1.0630.
On the other hand, as the chart shows, the next key level is not until 1.0756, leaving the high of the day at 1.0690 as a key intra-day level which would need to be taken out to extend the retracement.
So, where does this leave us?
It leaves us with a focus on yesterday’s breakout level at 1.0665 needing to hold to keep a bid. Otherwise, look for 1.0650 to exert its magnetic pull.
WASHINGTON, April 17 (Reuters) – The United States, Japan and South Korea agreed to “consult closely” on foreign exchange markets in their first trilateral finance dialogue on Wednesday, acknowledging concerns from Tokyo and Seoul over their currencies’ recent sharp declines.
US nods to ‘serious’ Japan, S.Korea concerns over slumping currencies
April 18 (Reuters) – A look at the day ahead in Asian markets.
Amid a flurry of commentary from global financial leaders at the International Monetary Fund and World Bank Spring meetings in Washington, and with many markets having undergone huge moves in recent weeks, investors are taking a bit of a time out.
I POSTED THIS IN OUR BLOG YESTERDAY AND IT TURNED OUT TO BE A TIMELY ARTICLE.
LOOKING ACROSS CURRENCIES AND OTHER MARKETS TODAY SOME WILL CALL IT A CORRECTION DAY.
i CALL IT A LIQUIDATING MARKET DAY, ONE THAT NEEDS TO BE TRADED DIFFERENTLY AS YOU WILL SEE IN THE ARTICLE.

BTC 4 HOUR CHART – HAS THE AIR COME OUT OF THE BALLO0N?
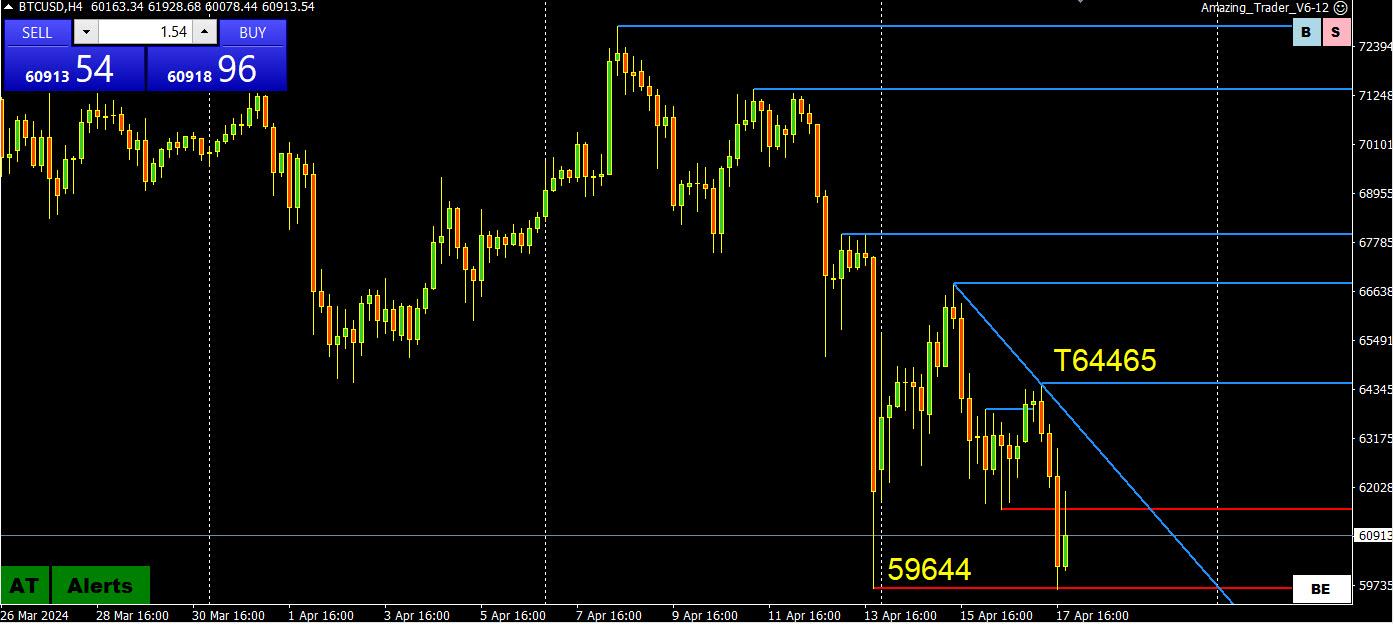
As I pointed out previously, BTC was not seeing safe-haven flows despite the current geopolitical situation.
This may have been a clue that the air was coming out but looking at this chart the blue AT lines dominating showed a risk on the downside.
What amazes me about BTC is that is when a technical level or pattern holds in something that can move 7% on a Saturday.
With that said, the move below 60000 came close to a key level (see chart) which if broken would leave a void until around 50000.
This shows the importance of 60000 as a pivotal level and the key support line below it.
Balance for EurChf has adjusted to flat now so sell waves should be expected to be under normal until Israel hits. UsdChf could hold here temporarily at 9100 which could give EurChf enough to hold. Risk aversion is growing and so Chf itself is only a matter of time for hard downside moves once Israel hits in my view. This includes options.
IMF WORLD ECONOMIC OUTLOOK
STEADY BUT SLOW: RESILIENCE AMID DIVERGENCE
APRIL 2024… “the global view can mask stark divergence across countries. The exceptional recent performance of the United States is certainly impressive and a major driver of global growth, but it reflects strong demand factors as well, including a fiscal stance that is out of line with long-term fiscal sustainability (see April 2024 Fiscal Monitor). This raises short-term risks to the disinflation process, as well as longer-term fiscal and financial stability risks for the global economy since it risks pushing up global funding costs. Something will have to give.” …
what and when could that be ?
EURUSD 4 HOUR CHART – TRYING TO CORRECT BUT…
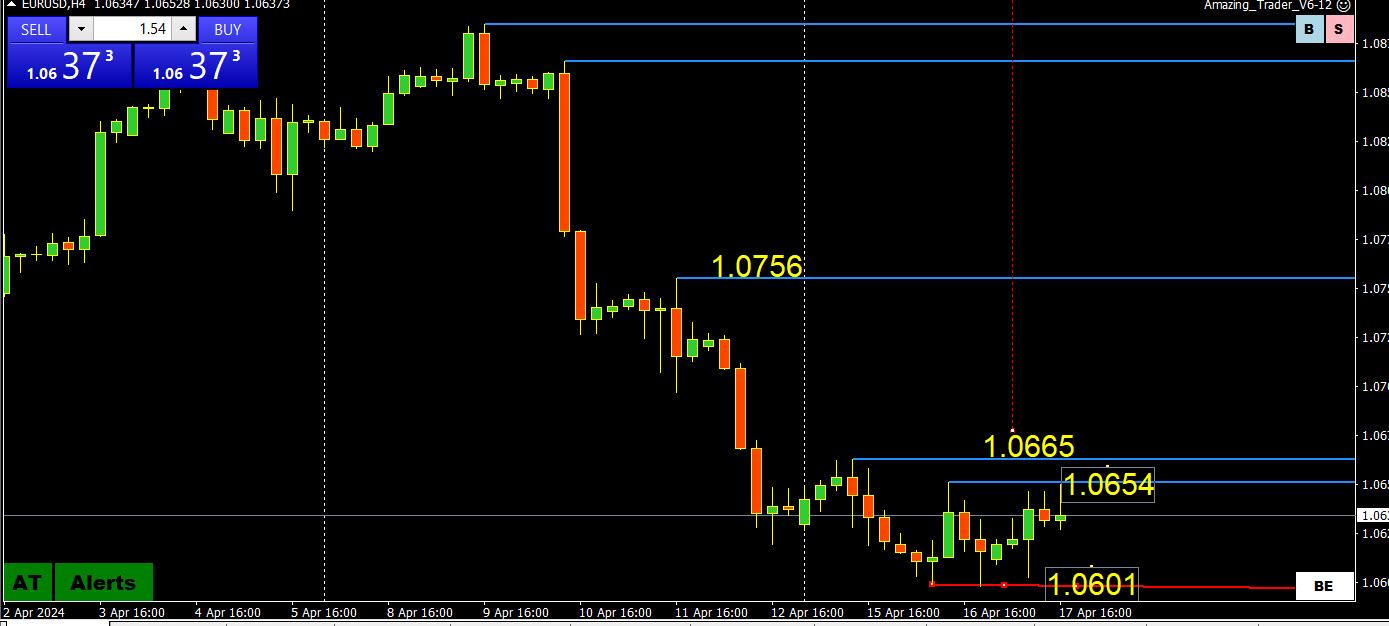
Looking at this chart the key level on the upside is clear at 1.0665.
Often, when in a sharp trend, there needs to be a squeeze on weak positions to run some stops )e.g. above 1.0665) before setting a fresh run at a new low or high.
This is the setup after an invisible hand held its finger in the dyke at 1.06.
Whether it materializes or not is still up in the air so just pointing out a risk.
Otherwise, the trend is still your friend.
-
AuthorPosts
Search
© 2024 Global View