

Forum Replies Created
-
AuthorPosts
-
DLRx 103.78
to state the obvious : dlr is on the back foot somewhatone could be suspicious of players trying to push the puppy lower for possible buying but I am not convinced there is underlaying appetite for the buck.
maybe if FED yakkers come out with higher for longer hymns or Minutes deliver something to impress players later this week
XAUUSD 30 Min Chart – is the high for the day in?

Having held the 1995 level I cited in prior posts, XAUUSD is rallying in line with a weaker USD
So far the high around 2031 is just shy of last week’s 2032 high
2025 = support that needs to hold to keep the high at risk
2015 = low of the day so expect support below the market as long as it stays above it
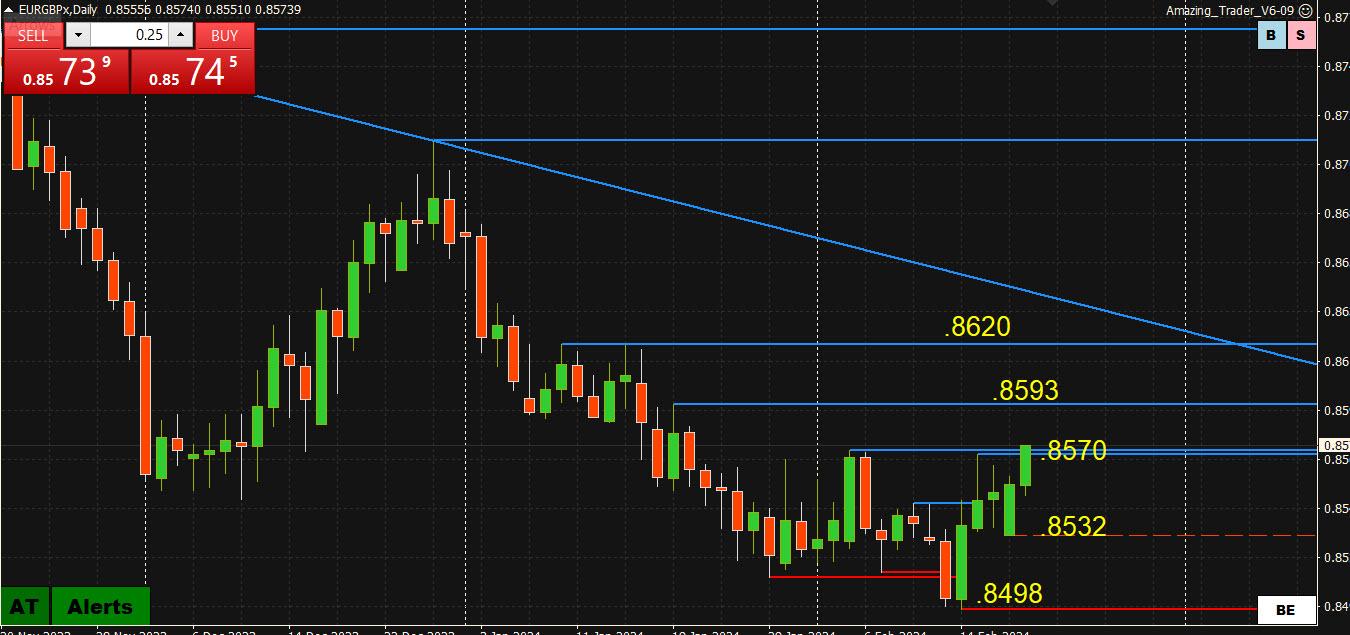
EURGBP Daily Chart (correcting or end of trend>)
Those who have followed me over the years have seen me say you can’t trade EURUSD or GBPUSD without keeping an eye on EURGBP. The move up in this cross is behind some of the demand for EURUSD while GBPUSD struggles on the upside.
As the chart shows, EURGBP has bounced off a test of .8500 *just below( and is currently trying to establish above,8575, which would expose .8592-.8620 as the last leg down is negated.
On the downside, it needs to hold .8532 to keep the bid but .8570+ for the string bid.
A look at the day ahead in European and global markets from Tom Westbrook
Europe’s central bank has singled out wages as the single biggest risk to its crusade to contain inflation. Fourth-quarter negotiated wages data likely headlines the trading day.
USDCHF Analysis: Uptrend Continues, Resistance and Support Levels
The USDCHF pair is currently above a rising trend line on its 4-hour chart, indicating that the pair remains in an uptrend from 0.8550.

As long as the trend line support holds, the pullback from 0.8885 could be seen as consolidation for the uptrend. A breakthrough of the 0.8845 resistance level could trigger another rise to test the 0.8885 resistance level. A breakthrough of this level would aim for the 0.9000 area.
The key support level is located at 0.8782. Only a breakdown below this level would indicate that the upside move has completed at the 0.8885 resistance level already. In this case, the pair would find next support at around the 0.8650 area.
ROFL …. please someone tell me
that there is no co-ordination, that I am a hallucinating conspirationalist:
–Summers: “Meaningful Chance” That Fed Might Hike Rates
YouTube · Bloomberg Television 3 days agoRate Hike May Be Fed’s Next Move If Growth Picks Up
4 days ago — (Bloomberg) — The Federal Reserve’s next interest-rate move could be a hike — rather than a cut — if the US economy reaccelerates …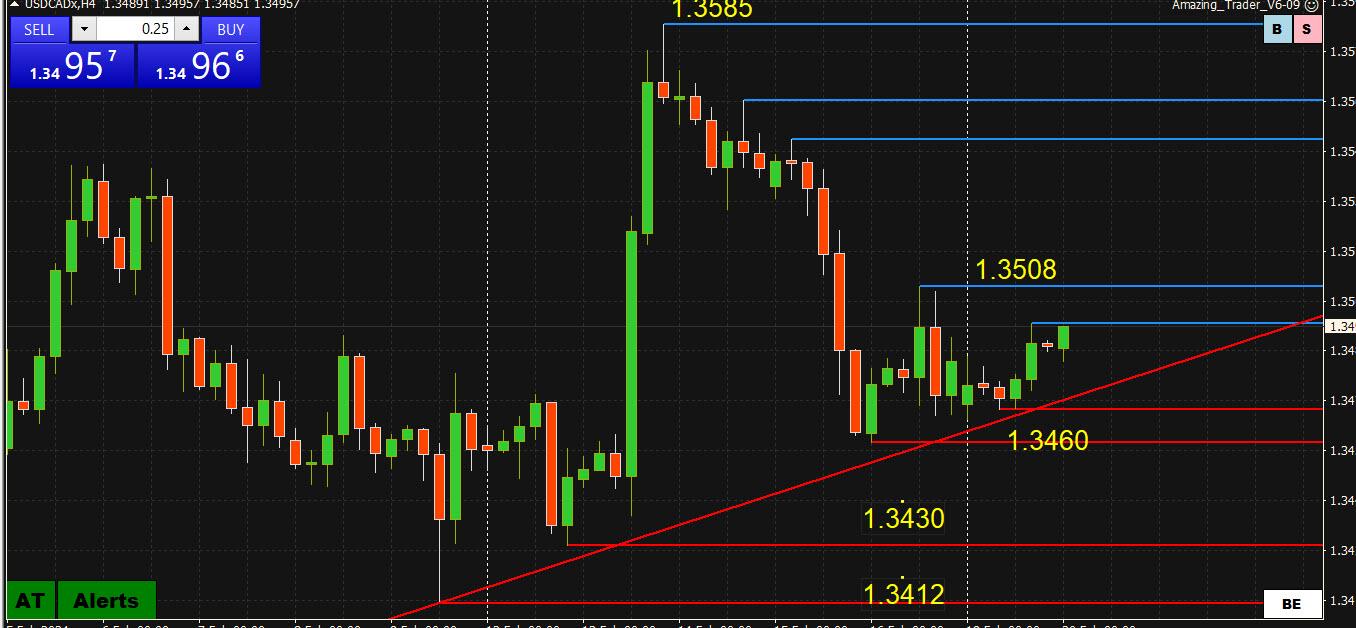
USDCAD 4-Hour Cgart
Why am I posting a USDCAD chart?
There is a very light economic calendar on Tuesday except for Canada CPI.
Looking at this chart, there is a broad range near 1.34-1.36 (1.3412-1.3585)
So it is no wonder the pair keeps gravitating towards the 1,35 midpoint.
Rising trendline offset by falling resistance lines (blue).
Whatever the case, expect some volatility around the CA inflation report but only a break of 1.34-1.36 would be significant/
Visit our Economic Calendar

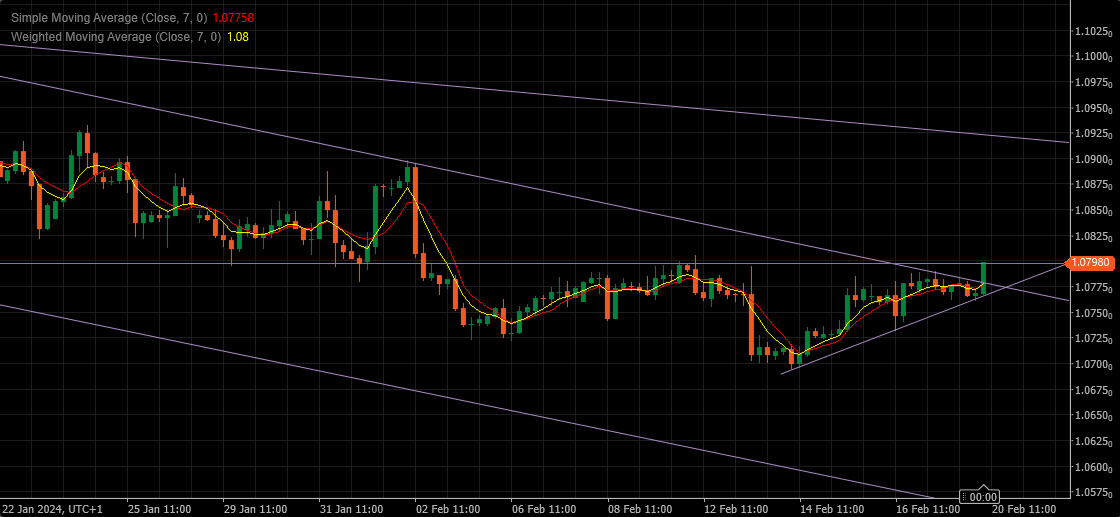
The pair got itself in the triangle , with clear Resistance at 1.07850 and Support at 1.07600
Buying above Res and selling bellow Supp is an easy deal…but you have to implement S/L in the right place
If Selling, S/L above 1.08000
If Buying S/L bellow 1.07500
Calculate your stop and multiple it with at least 1:3 – that should be your desired profit -
AuthorPosts

Search
© 2024 Global View