

Forum Replies Created
-
AuthorPosts
-
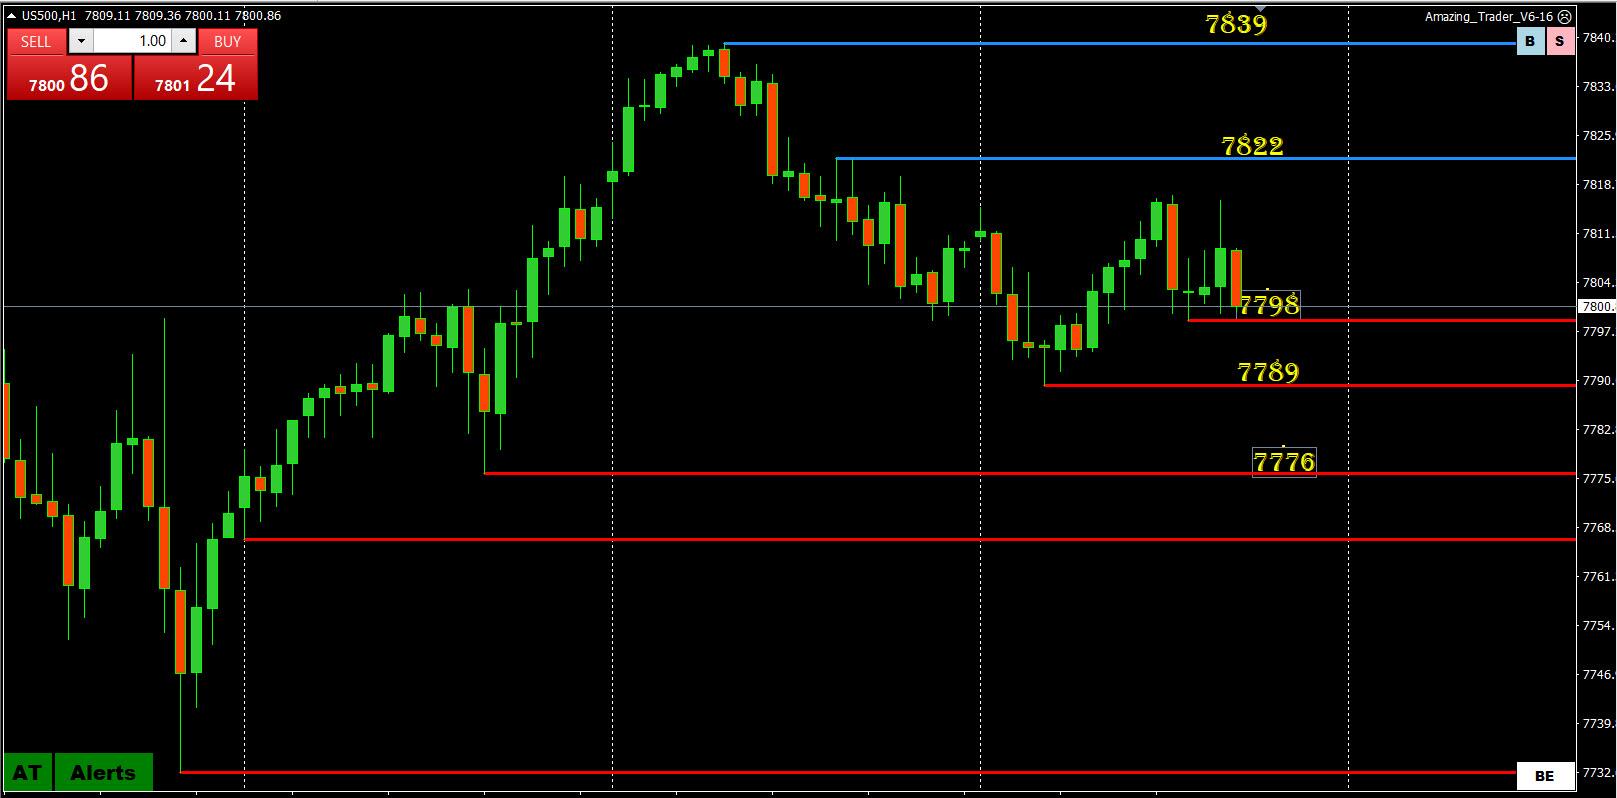
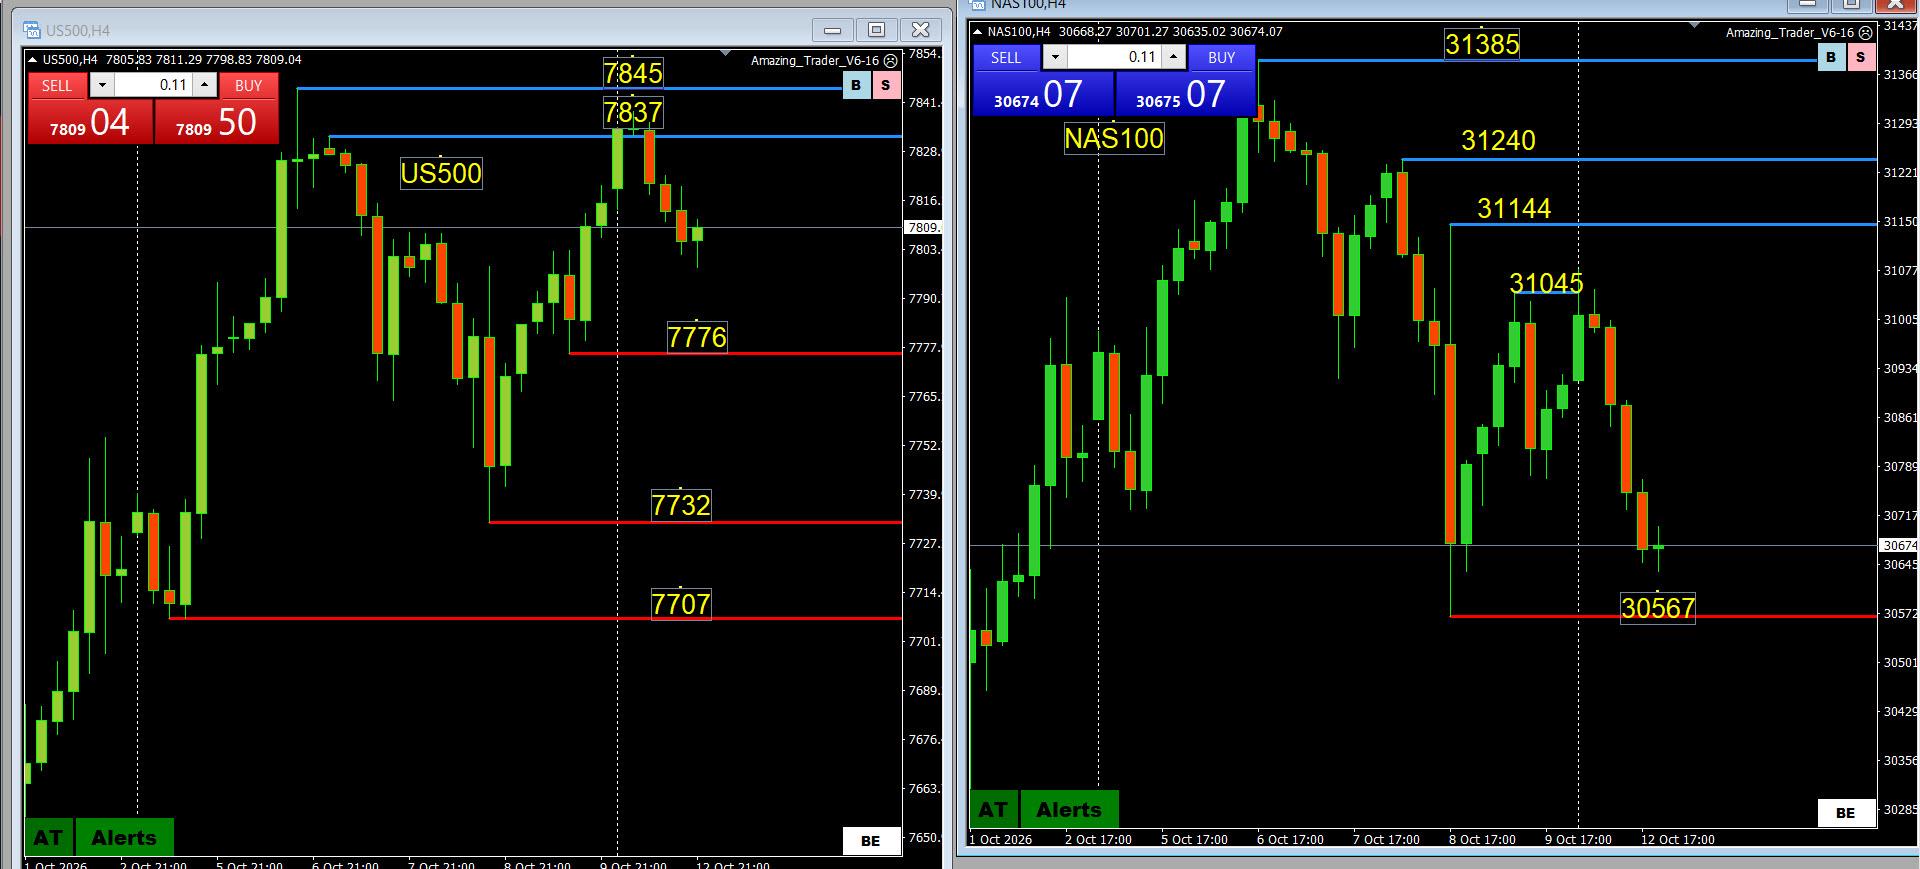
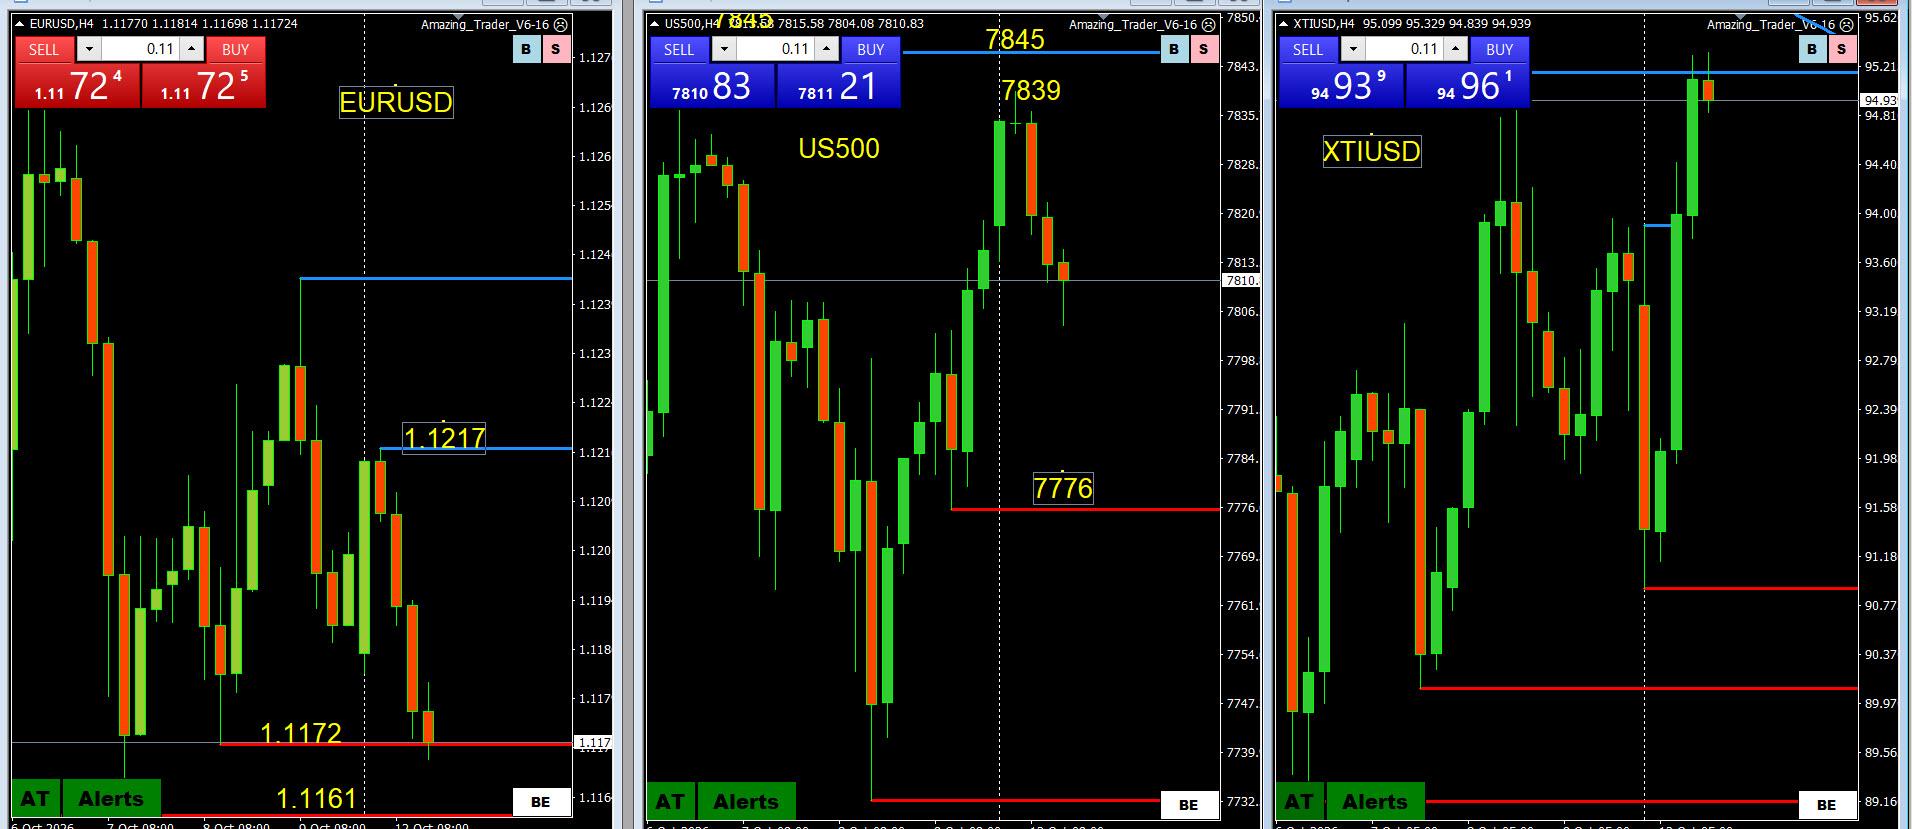
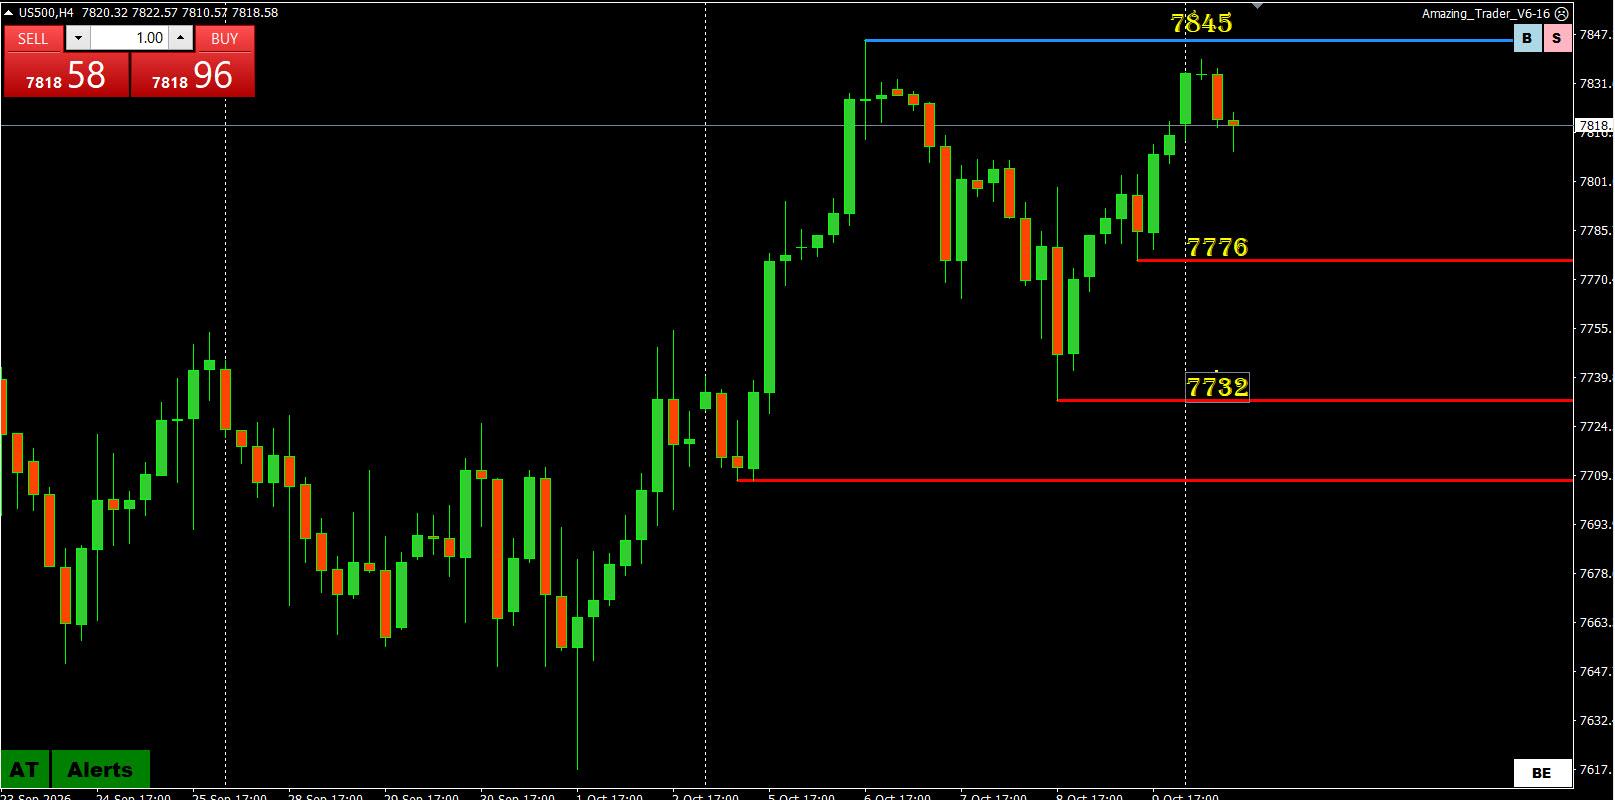
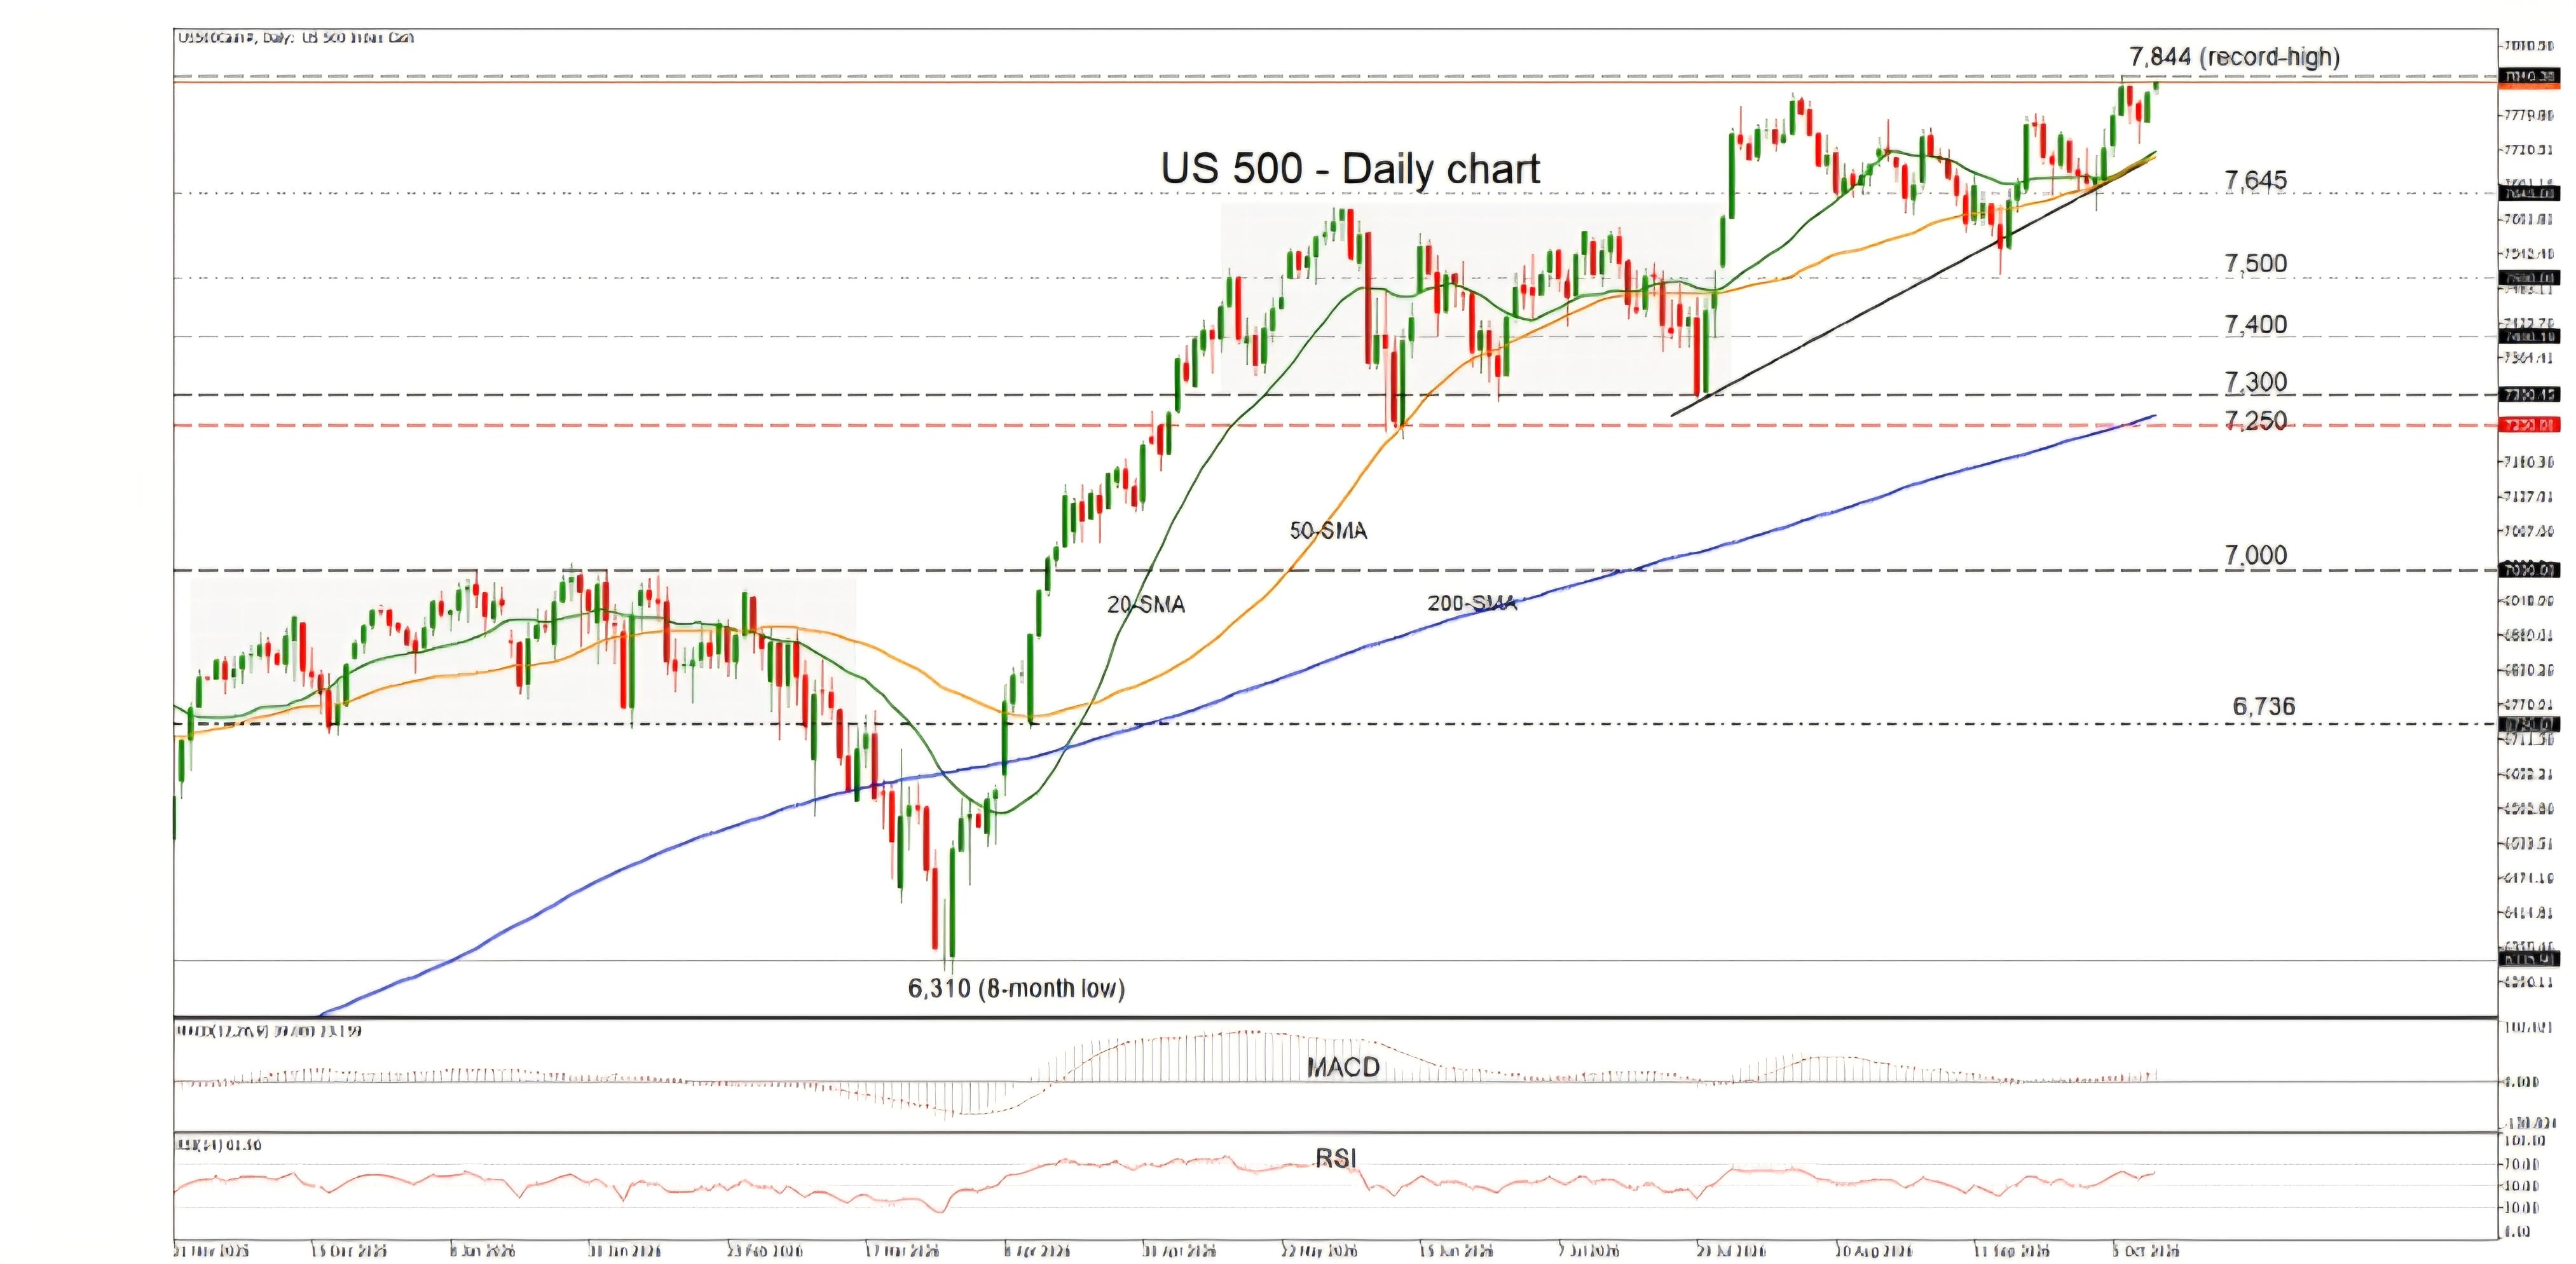
US500 (SP500) 1 HOUR: 6 days in a row Consolidating around 7800, which has traded 6 days in a row. Last time this happened Was around 7700 (before a breakout to the upside) but 7800 is a more significant level so stay on guard for a directional move when this pattern breaks. Test may come in the reaction to Wed’s CPI. Wide range 7776-7839/45.
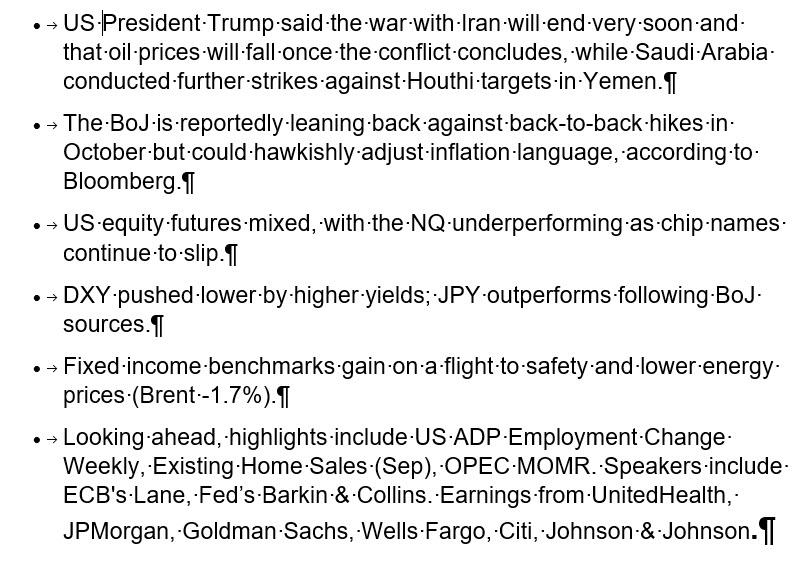
Newsquawk Daily US Opening News – 13th October 2026
(Right click on any image (or chart) to open a full screen in a new tab)
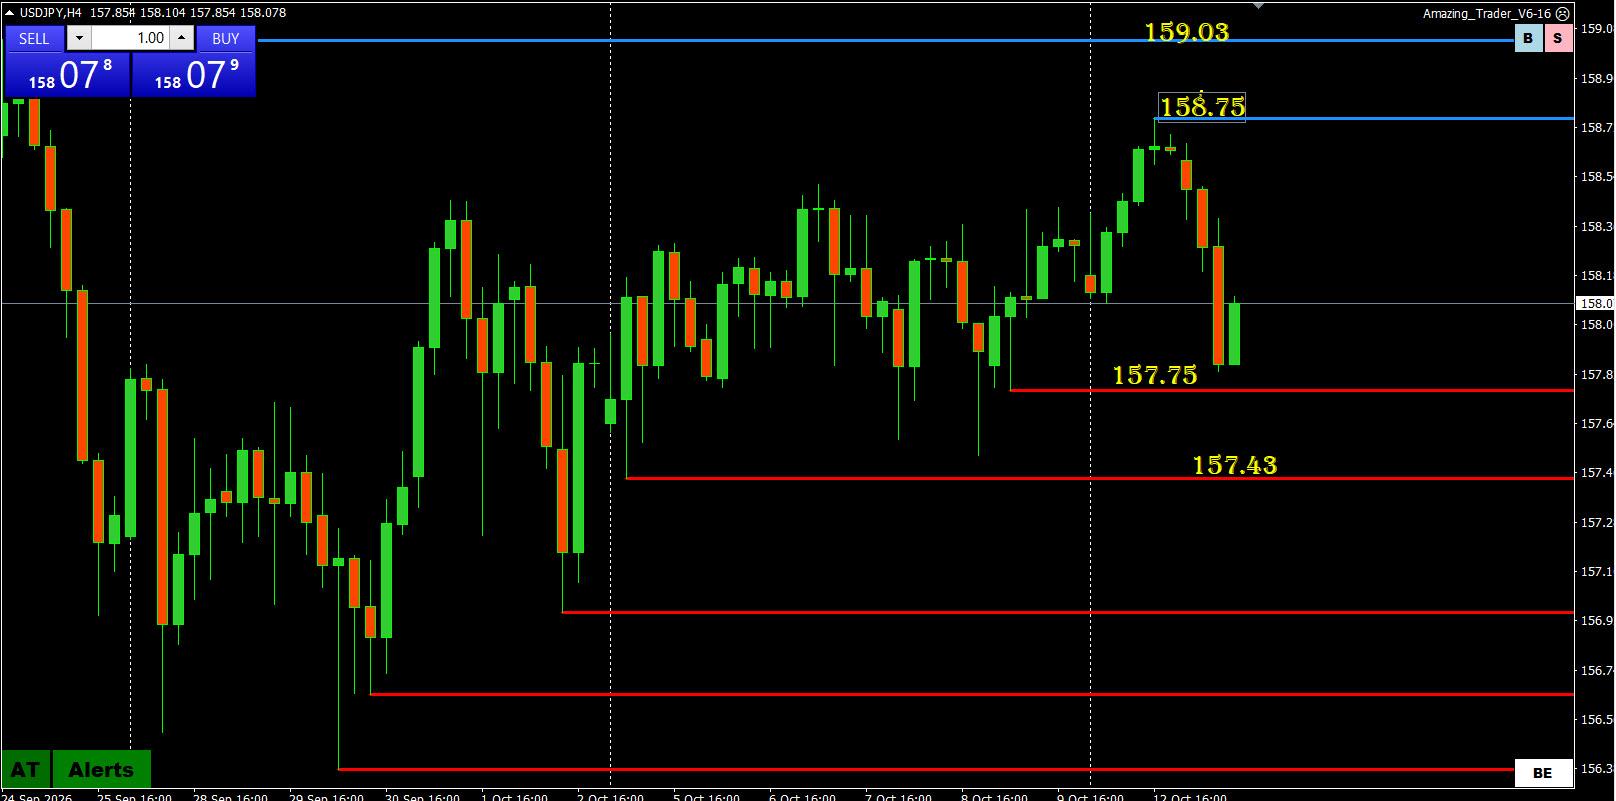
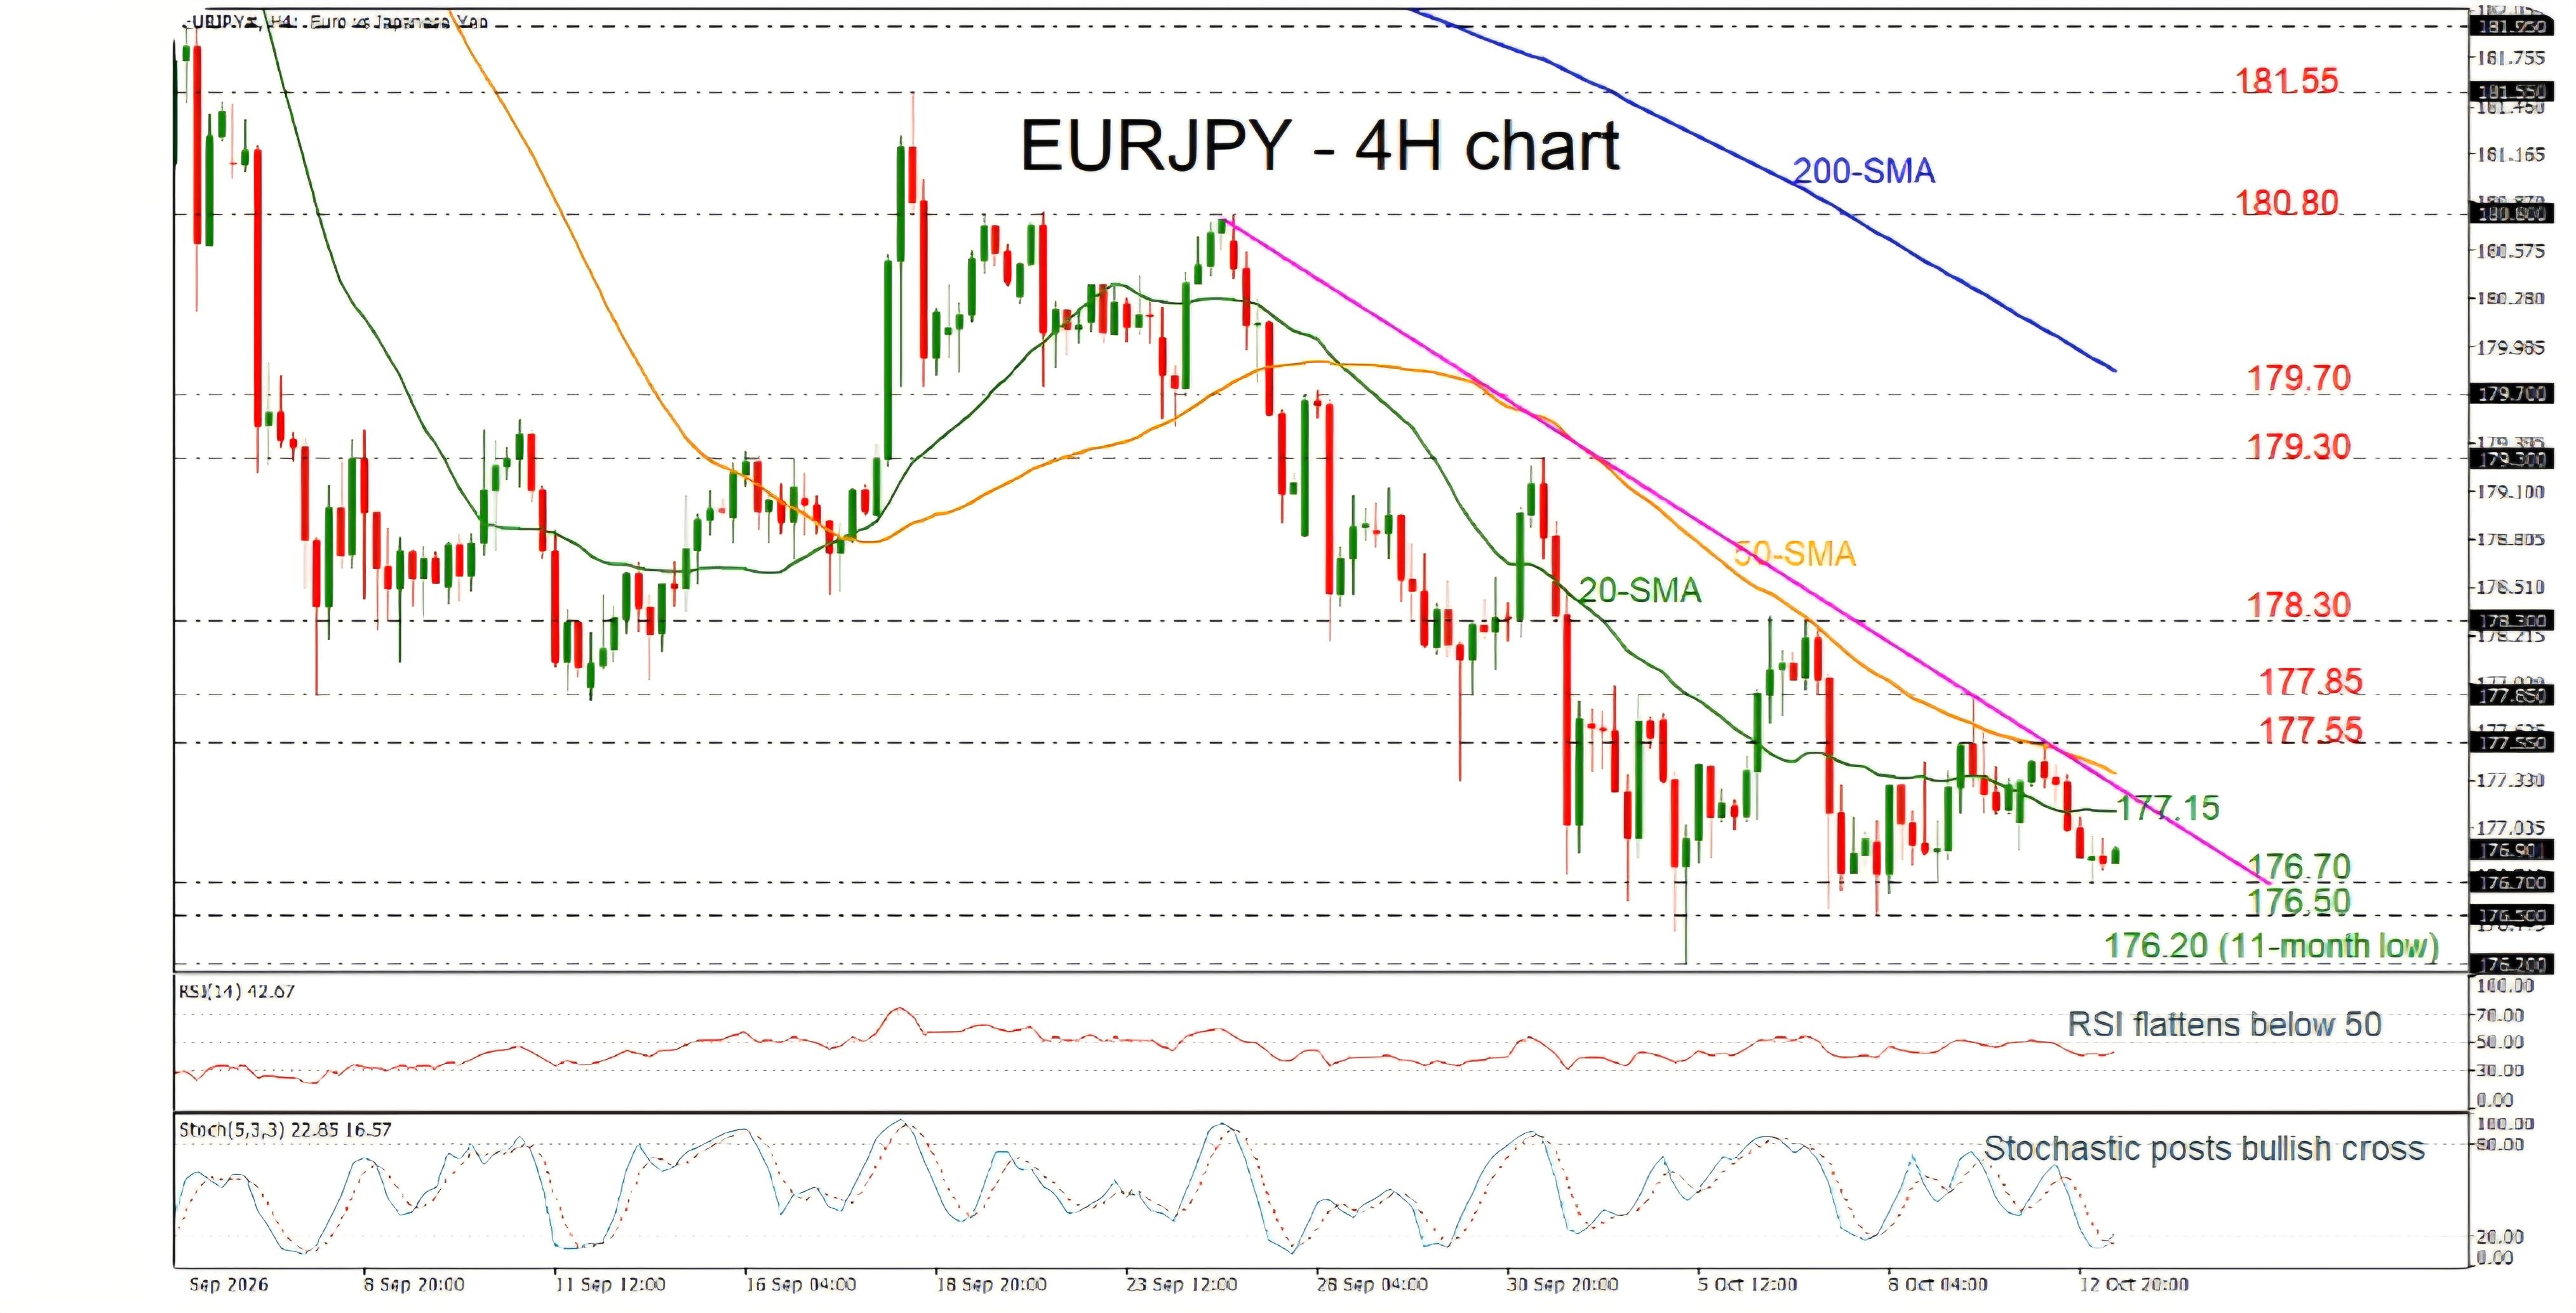
USDJPY 4 HOUR: Conspiracy theory
As noted yesterday, the break of a 7 day pattern around 158 would normally be taken as a bullish signal but these are not normal times given the threat of BoJ intervention. Conspiracy theory: If I was the BoJ I would have taken advantage of the dip in US yields and softer USD to give USDJPY a nudge to run stops below 158 (low 157.75).
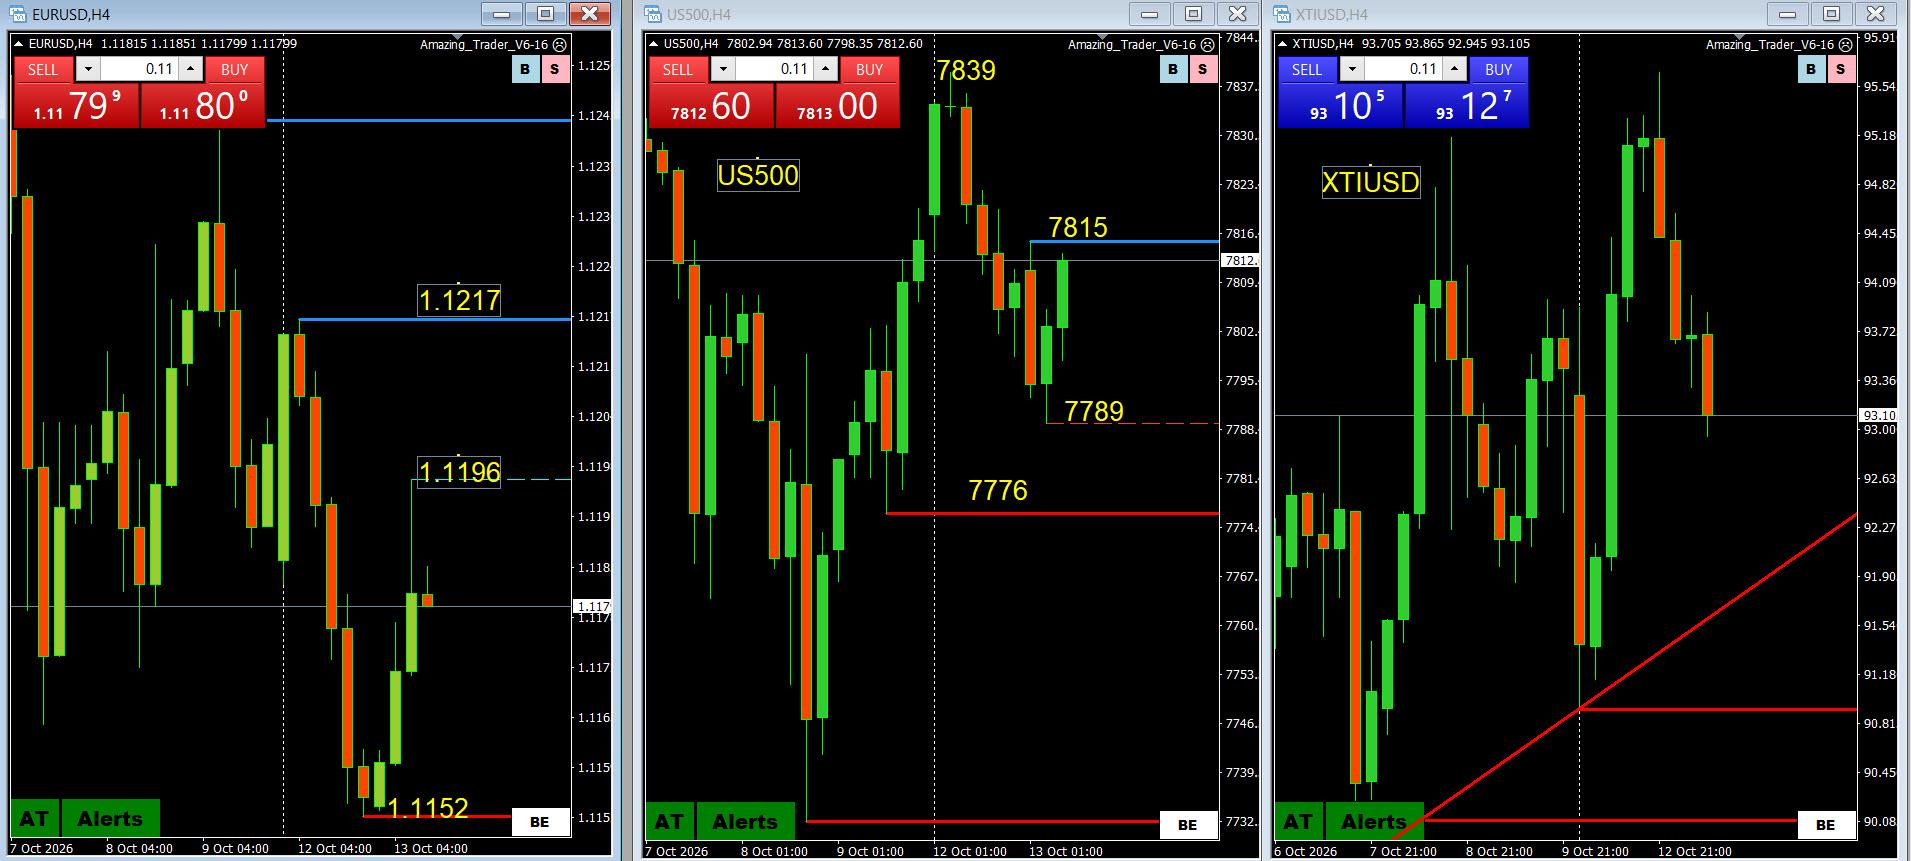
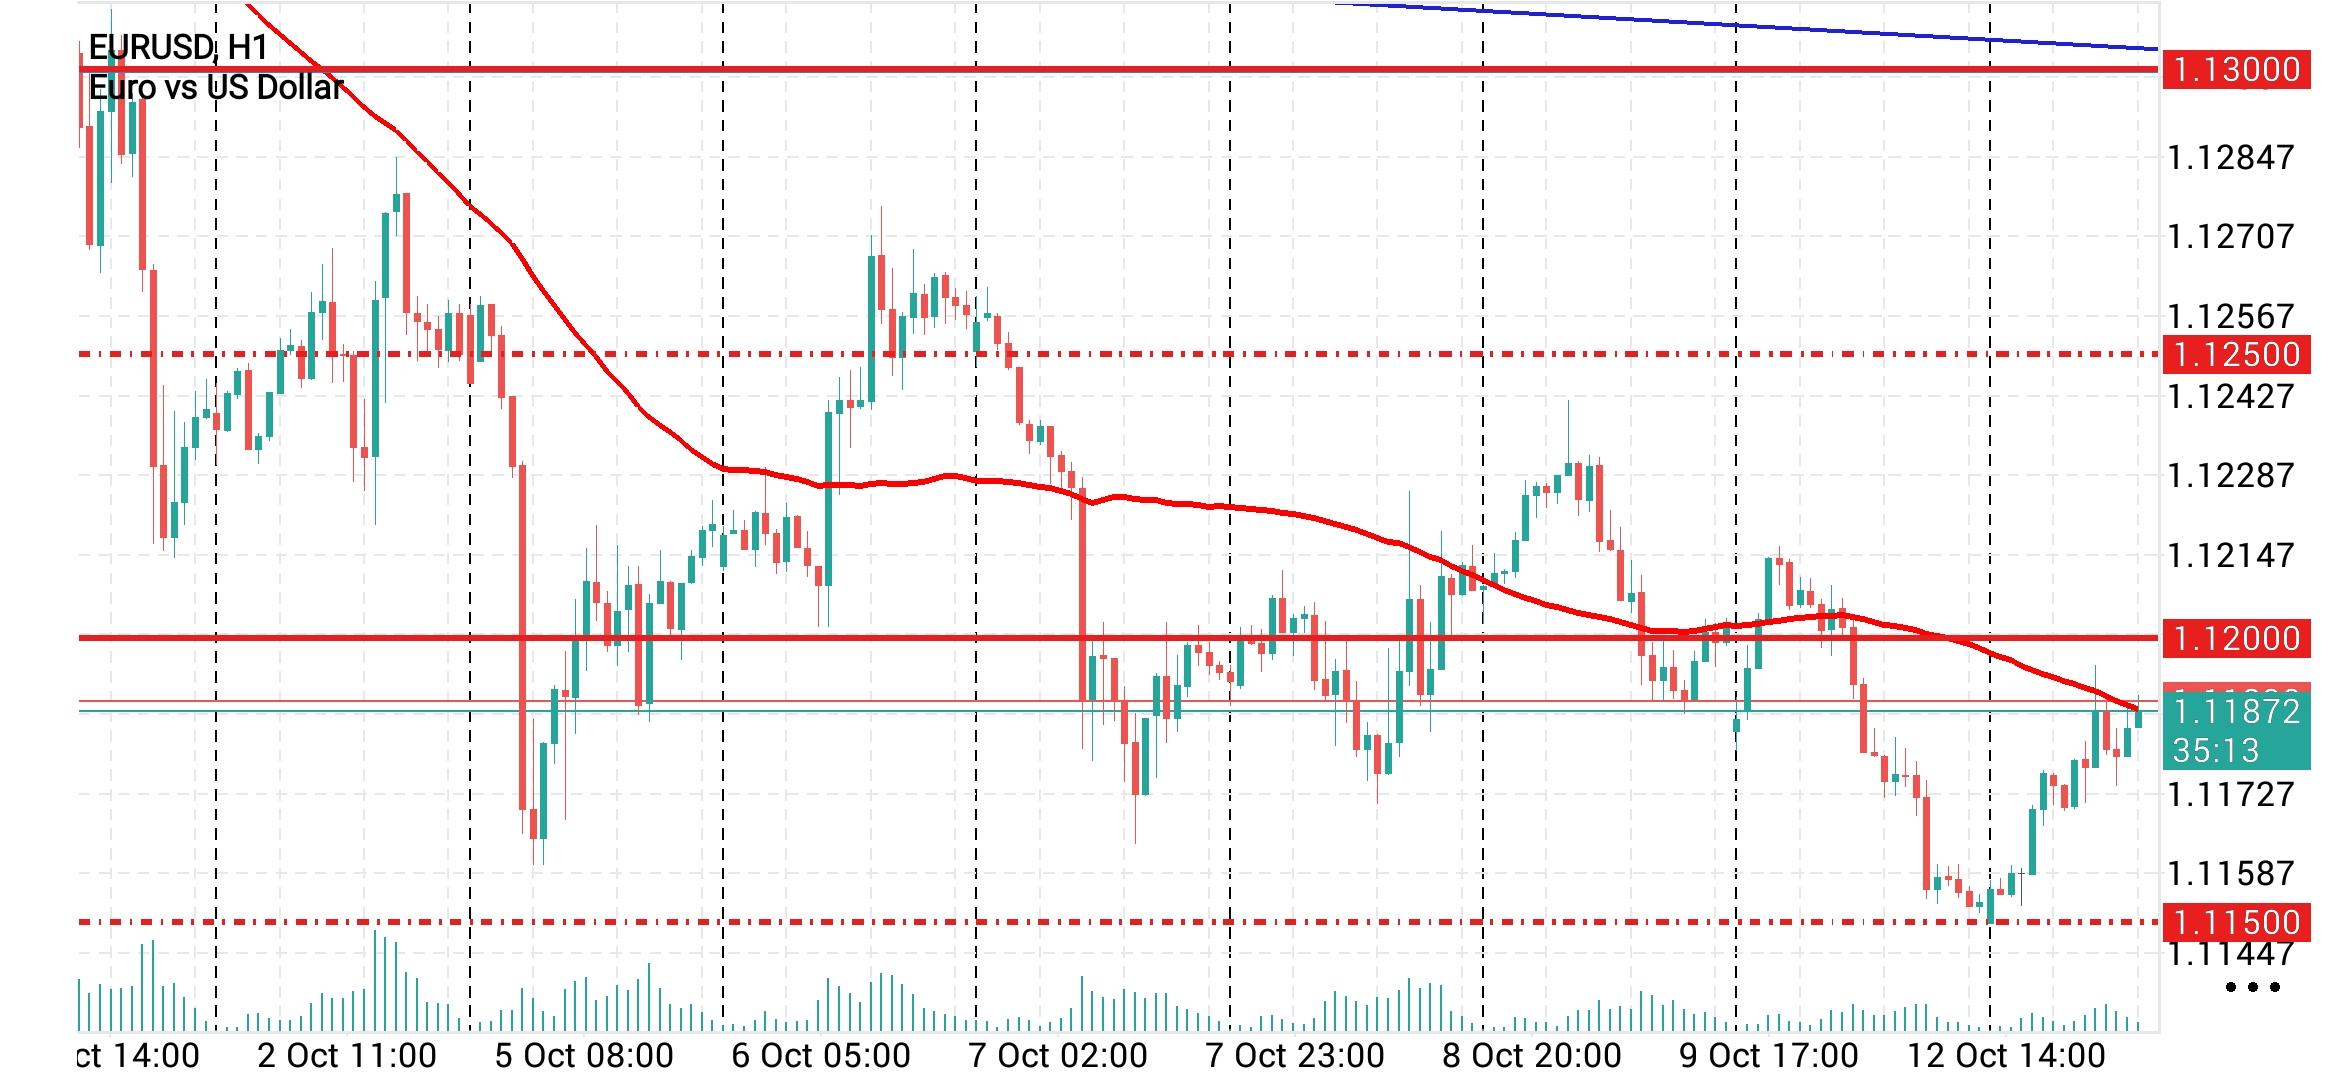
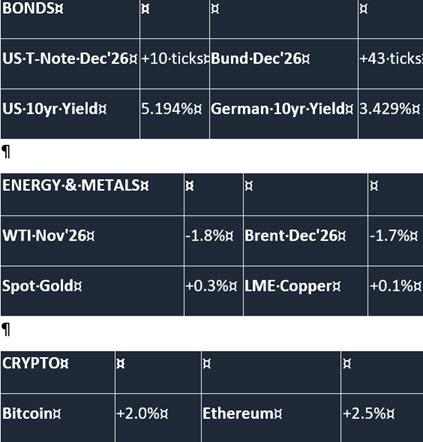
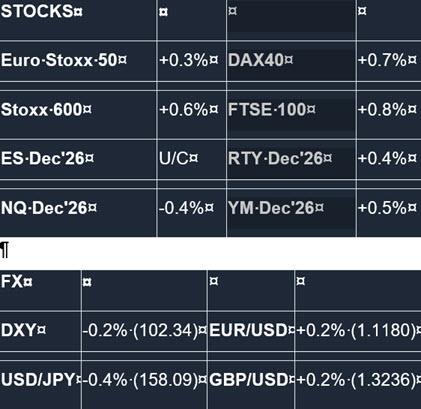
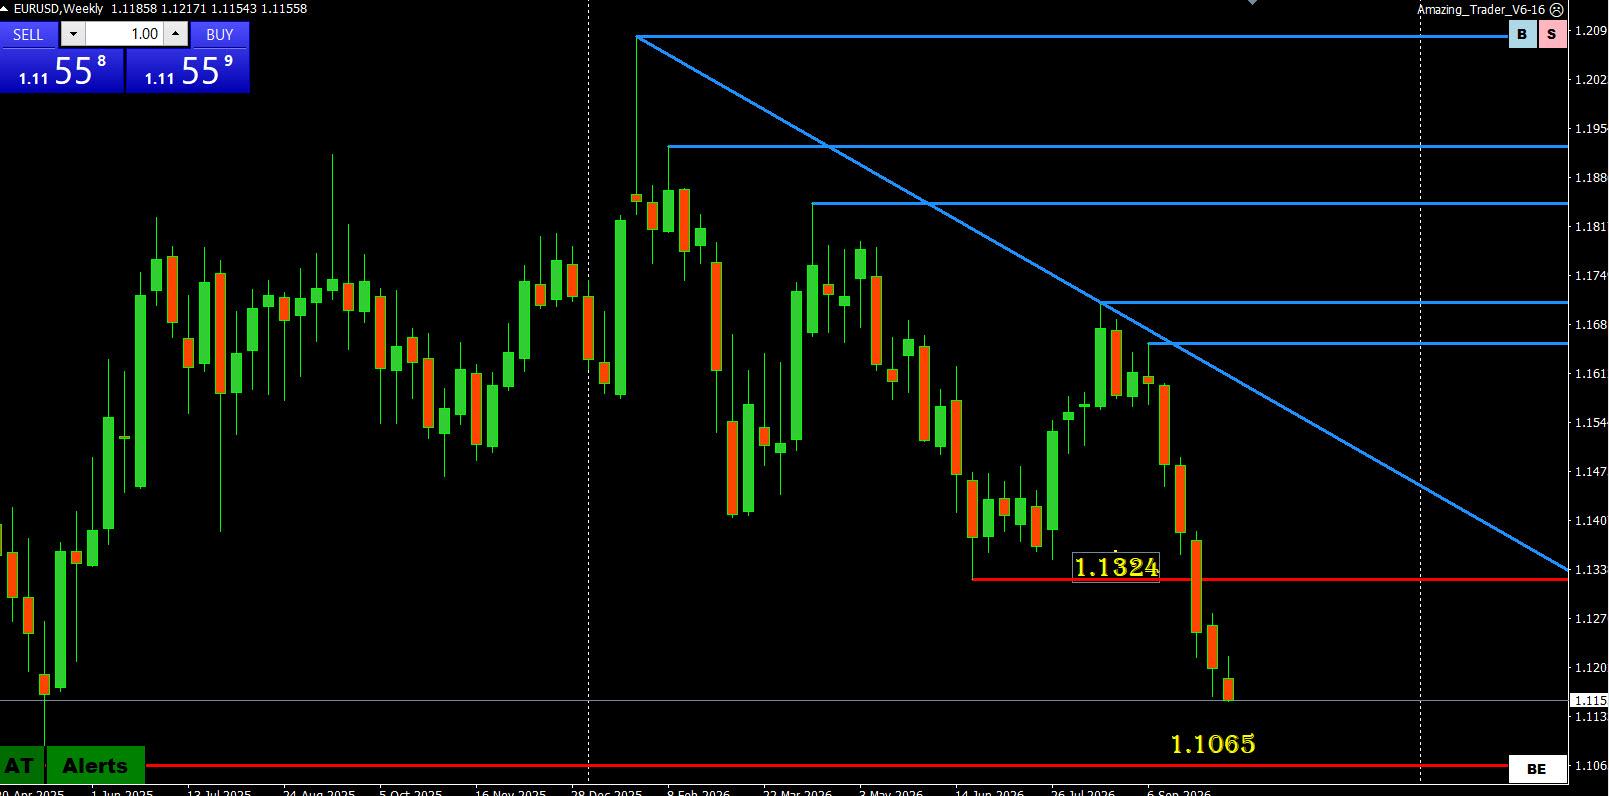
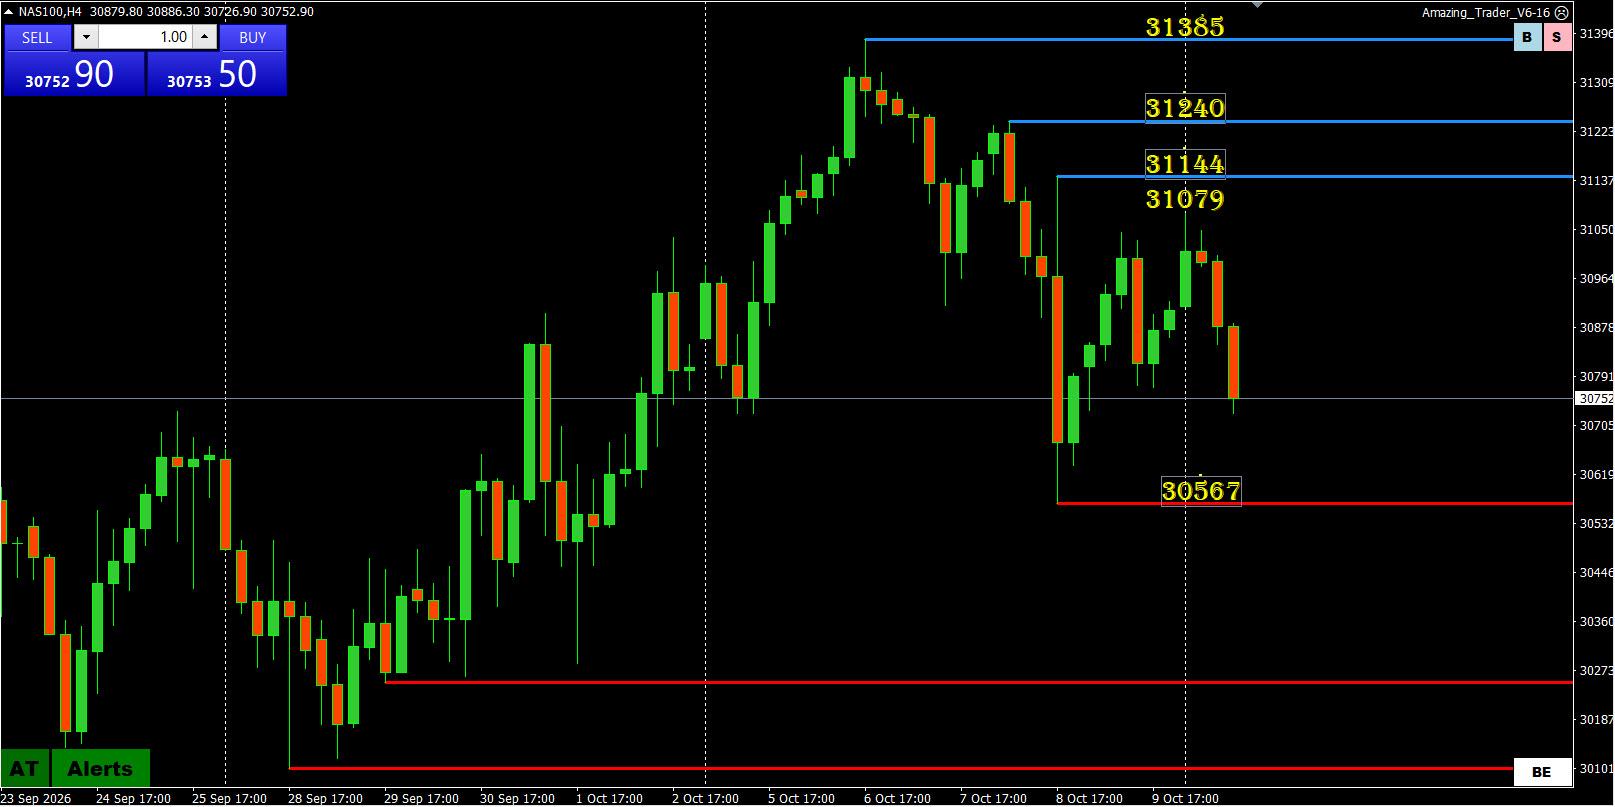
Market Update: Fickle convictions Bond yields down => stocks (led by NAS) initially down => USD down (stocks currently off the lows but yields still down as curve flattens). Crude oil is down on the day after firming yesterday. EURUSD: 2-day double bottom just above 1.1150 but upside so far contained below 1.12 and 1.1217 resistance. US500 back above 7800 (and NAS bounced off low as well).

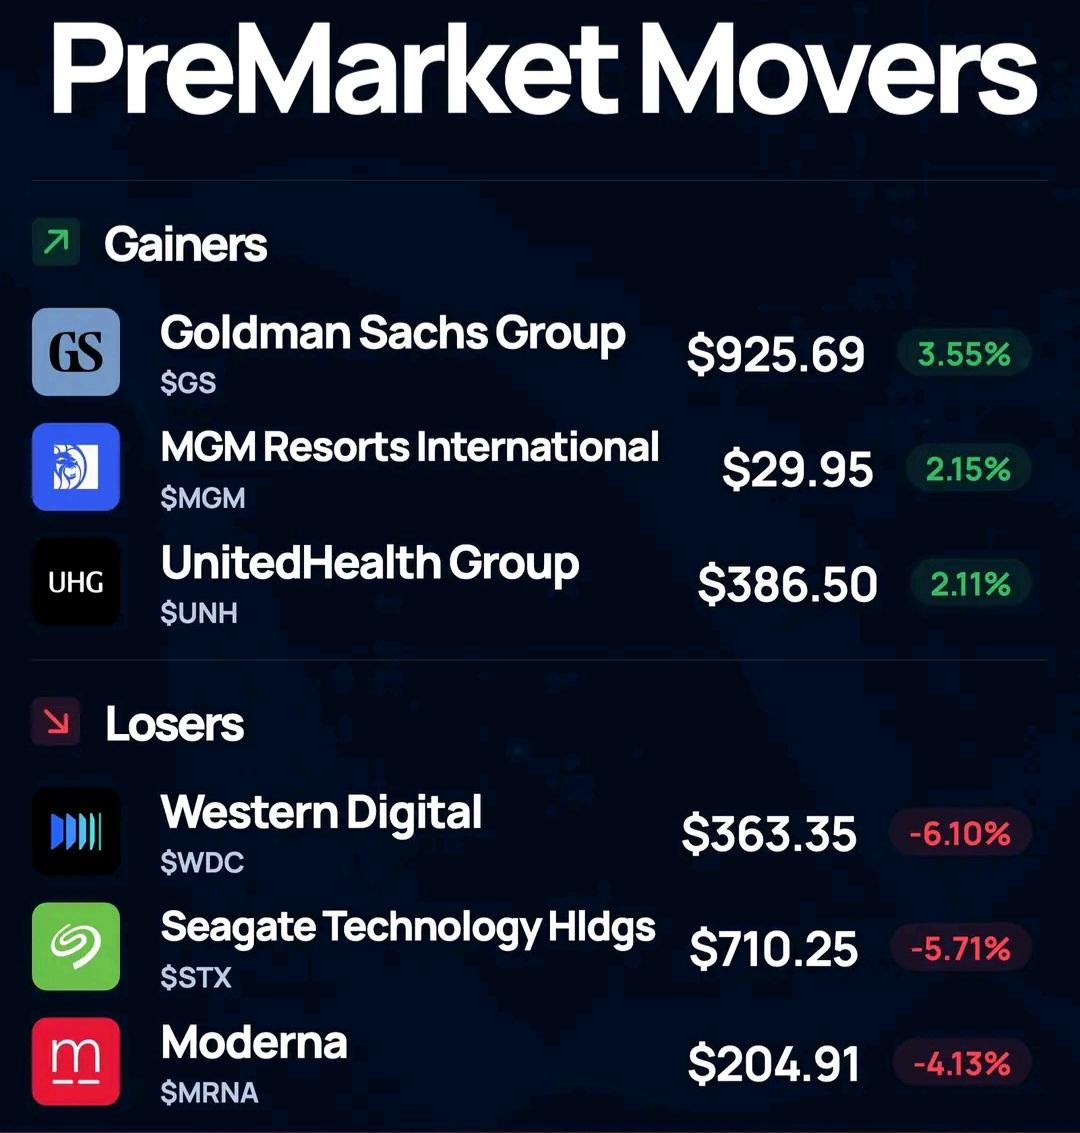
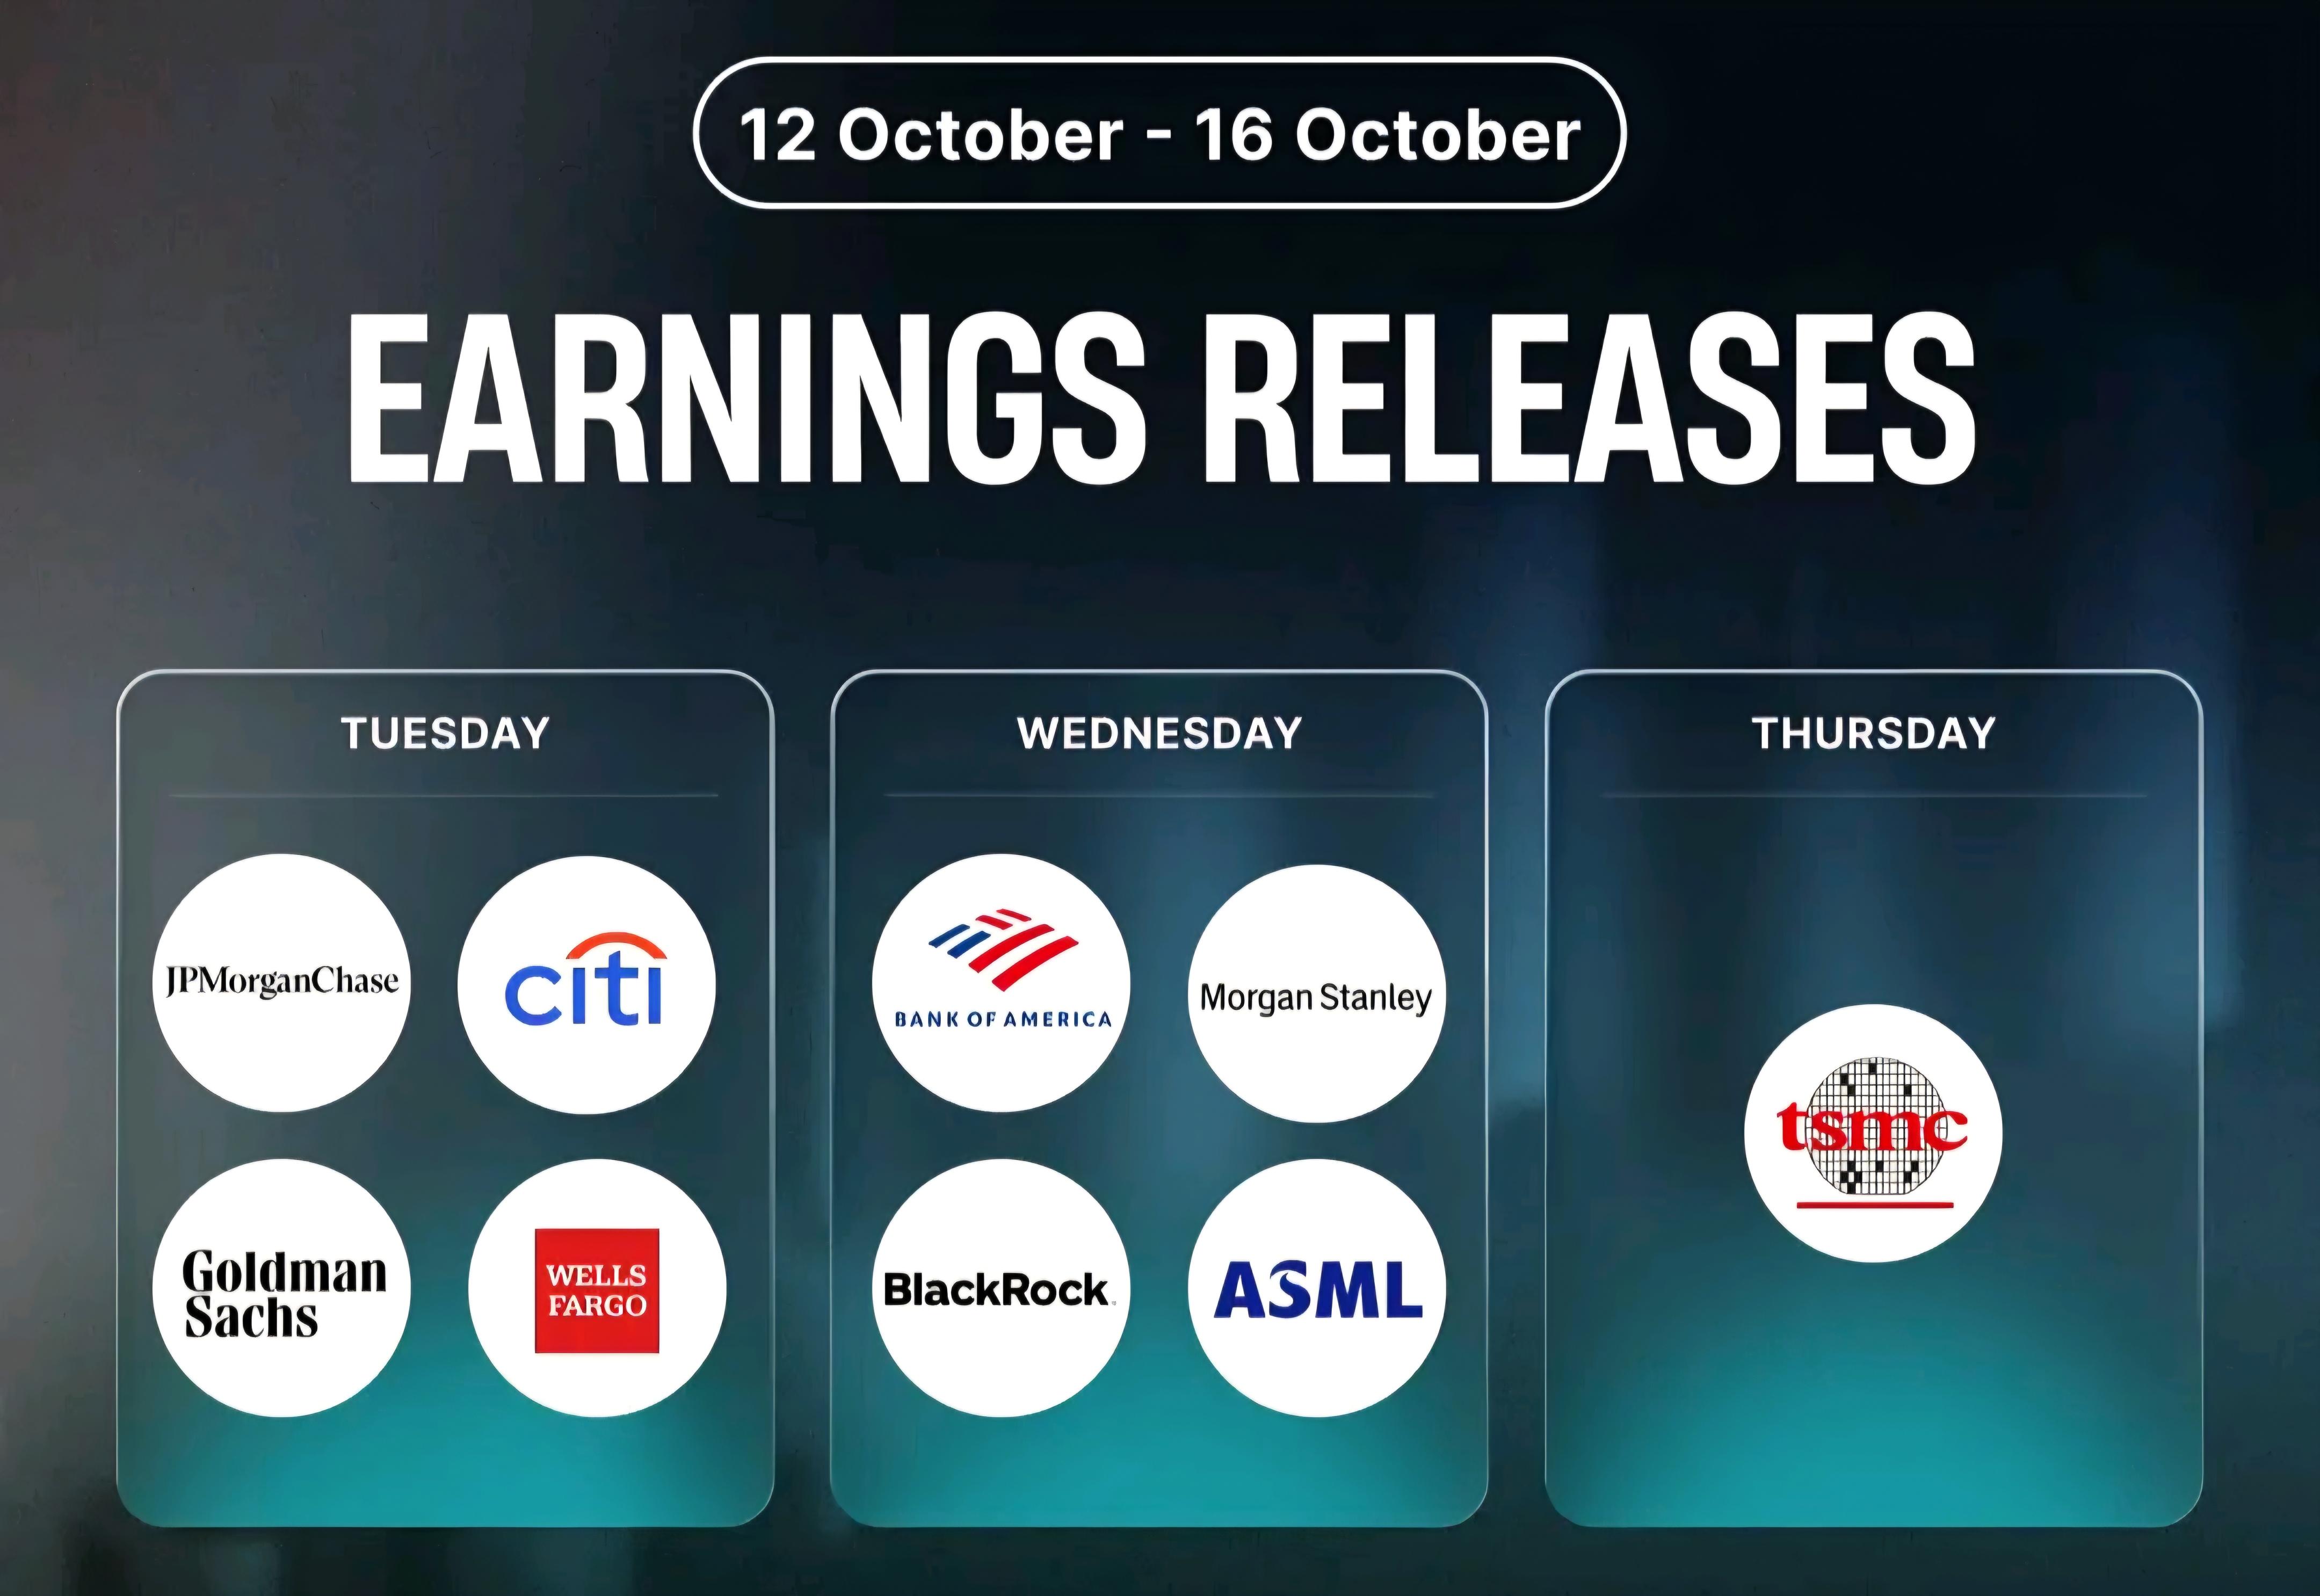
COMING UP: Data: Japanese PPI (Sep), German Final Inflation (Sep), US ADP Employment Change Weekly, Existing Home Sales (Sep). Events: RBA Minutes; OPEC MOMR. Speakers: US President Trump; BoE’s Greene; ECB’s Elderson, Lane; Fed’s Waller, Barkin, Collins. Supply: Australia, Netherlands, Italy, Germany. Earnings: UnitedHealth, JPMorgan, Goldman Sachs, Wells Fargo, Citi, Johnson & Johnson.
-
AuthorPosts


Search
© 2024 Global View