
- This topic has 28,112 replies, 54 voices, and was last updated 1 hour, 11 minutes ago by GVI Forex 2.
-
AuthorPosts
-
May 16, 2024 at 2:17 pm #6392
interesting …
“EXCLUSIVE (WSJ)
Russian Spacecraft Tested Components for Antisatellite Weapon, U.S. Says”
–
actually there is nothing new about this type of toys. they date back decades.the only thing that might be new(s) is if anyone or all start to … biding badang each others’ satellites.
my Q is … how would I manage my trades , eh ?
May 16, 2024 at 2:11 pm #639110-yr Yield | 9:59 AM EDT 4.369%
still stinks
–
If neel k wanted my nickle’s worth: the FED’s monetary policy is nowhere near exerting downward pressure on the economy.I d still inform him that it is NOT an unknown and that he should get in line with his chairman’s “higher for longer”. ditto for williams.
I am currently bit perplexed what game these two suits are playing.
May 16, 2024 at 1:58 pm #6390Sam had THE pulse of the market earlier today:
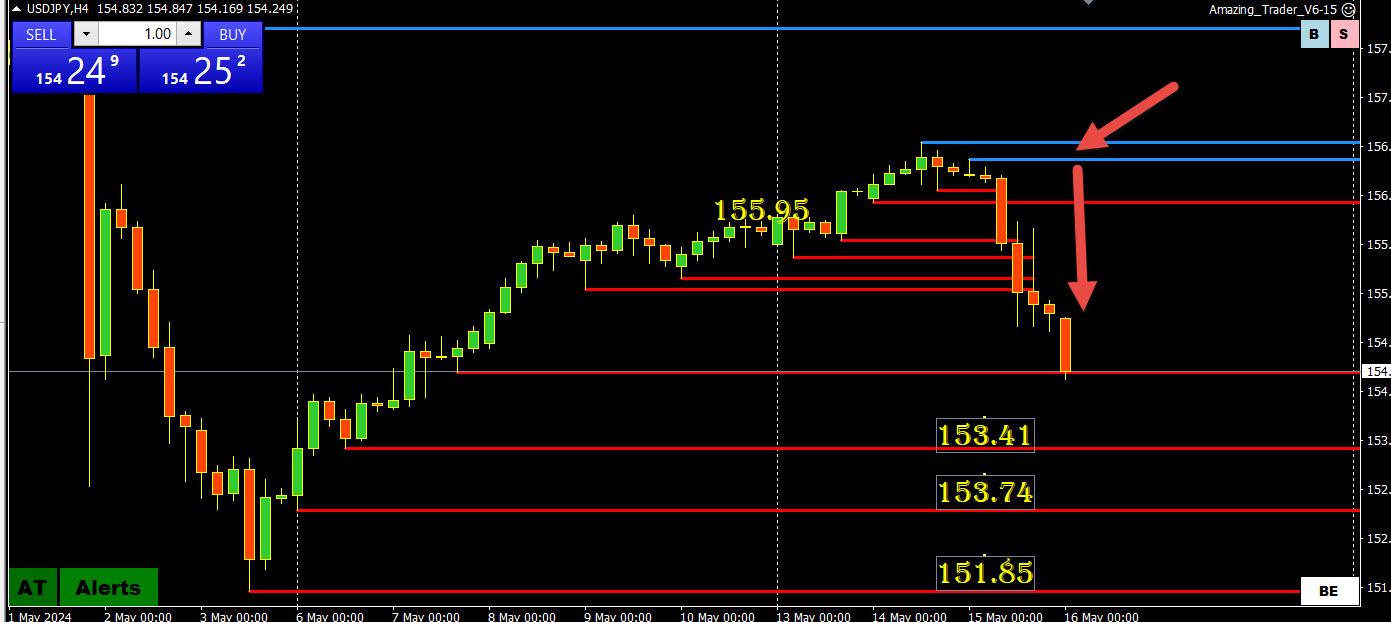
May 16, 2024 at 1:56 pm #6389May 16, 2024 at 1:40 pm #6388May 16, 2024 at 1:15 pm #6387USDJPY 1 HOUR CHART – 155 REMAINS THE FOCUS

As I noted last night, the only level that matters to me is 155 as that will set the overall bias.
Weak Japanese GDP data seems to have been the catalyst for a move back above 155. To suggest more scope on the rebound, 155.50 would probably need to be cleared.
May 16, 2024 at 11:16 am #6386EURUSD 15 MIN CHART – WAITING FOR US DATA
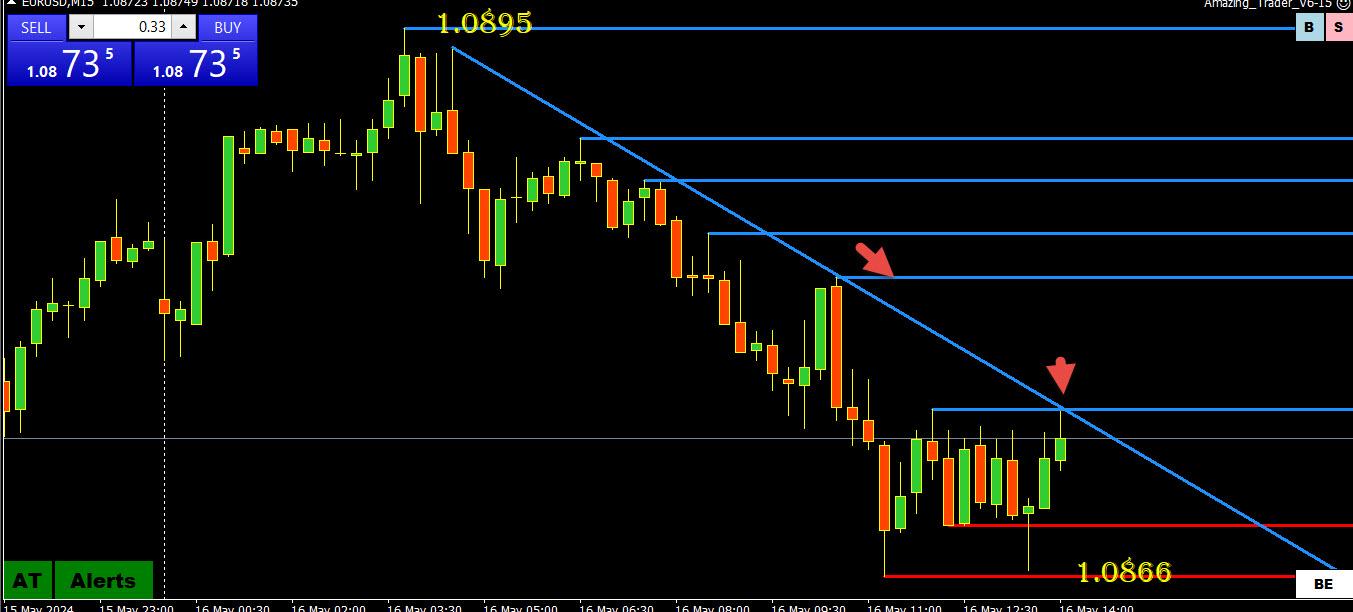
As markets wait for the next batch of US data here is a snapshot of the EURUSD
1.0866 double bottom’
Red arrows indicate the levels that need to be broken to break this retracement.
50% = 1.0851See our Economic Calendar for consensus forecast
May 16, 2024 at 10:57 am #6384dlr downtrend theme ?
williams helping ignite animal spirits:
–
Williams said April’s U.S. inflation data was a “positive” development after a string of disappointments and he said the overall price trend “looks reasonably good.”“I try not to take too much signal from one month or two months and look at the broader context of of the inflation trends. So I do think it’s a kind of a positive development after a few months where the data were disappointing, but you don’t want to over emphasize any one month or another month reading,” Williams said…
May 16, 2024 at 10:53 am #63836 May 2024 – A look at the day ahead in U.S. and global markets from Mike Dolan
World stocks (.MIWD000000PUS), opens new tab notched new records and the dollar (.DXY), opens new tab nursed its worst day of the year as fears of an overheating U.S. economy dissipate – stirring hopes that the coast is clearing for Federal Reserve easing at last.
Morning Bid: New highs hold as disinflation resumes, US cools
May 16, 2024 at 10:16 am #6374XAGUSD – Silver – Monthly
I was playing with this puppy like 25 years ago, but as I avoid anything that has mixed liquidity I avoid it as well.
But one of the Internet “Gurus” provoked me to take a closer look…Guy is calling for immediate reversal , talking how he’s selling it ( oh gimme a break…you might be selling eggs on the farmers market somewhere, but not this) on every uptick and blah, blah, blah..
He is declaring the double top ( No it’s not – we had a marginally new high already this month ) , and only problem that I see here is that 50% Fibo line just above the head – about 30.500-31.000.
However, pattern suggest more to come….so let’s see
To me more important is that trend line above at 31.600 – if above it, it can fly….
 May 16, 2024 at 9:49 am #6373
GBPUSD DAILY CHART –
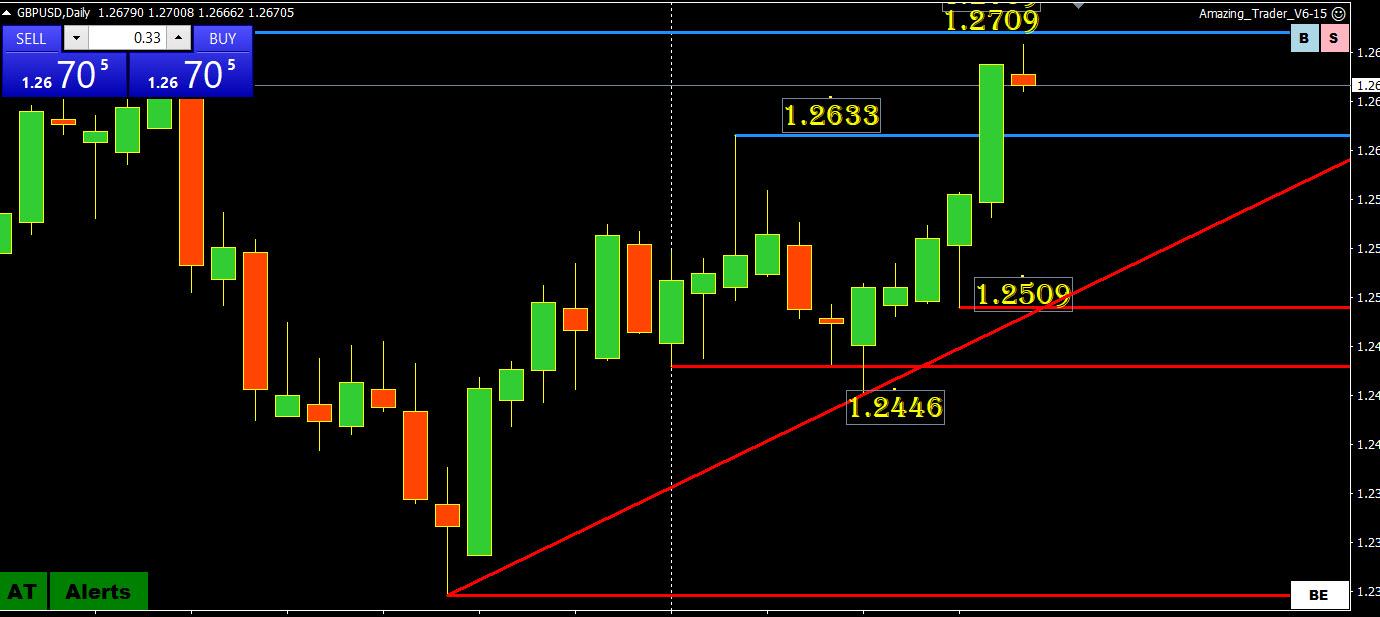
GBPUSD tested 1.27, just shy of the key 1.2709 level but has since backed off.
tHE STRAIGHT LONE MOVE UP YESTERDAY LEAVES LITTLE IN THE WAY OF OBVIOUS SUPPORT SO EITHER LOOK AT SHORTER TIME FRAME CHARTS OR USE RETRACEMENT LEVELS.
In this regard, check out our FIBONACCI CALCULATOR and calculate FIBO levels for whatever time frame you are looking at, such as 4 hour chart
May 16, 2024 at 9:27 am #6371BTC DAILY CHART – DO TECHNICALS MATTER?
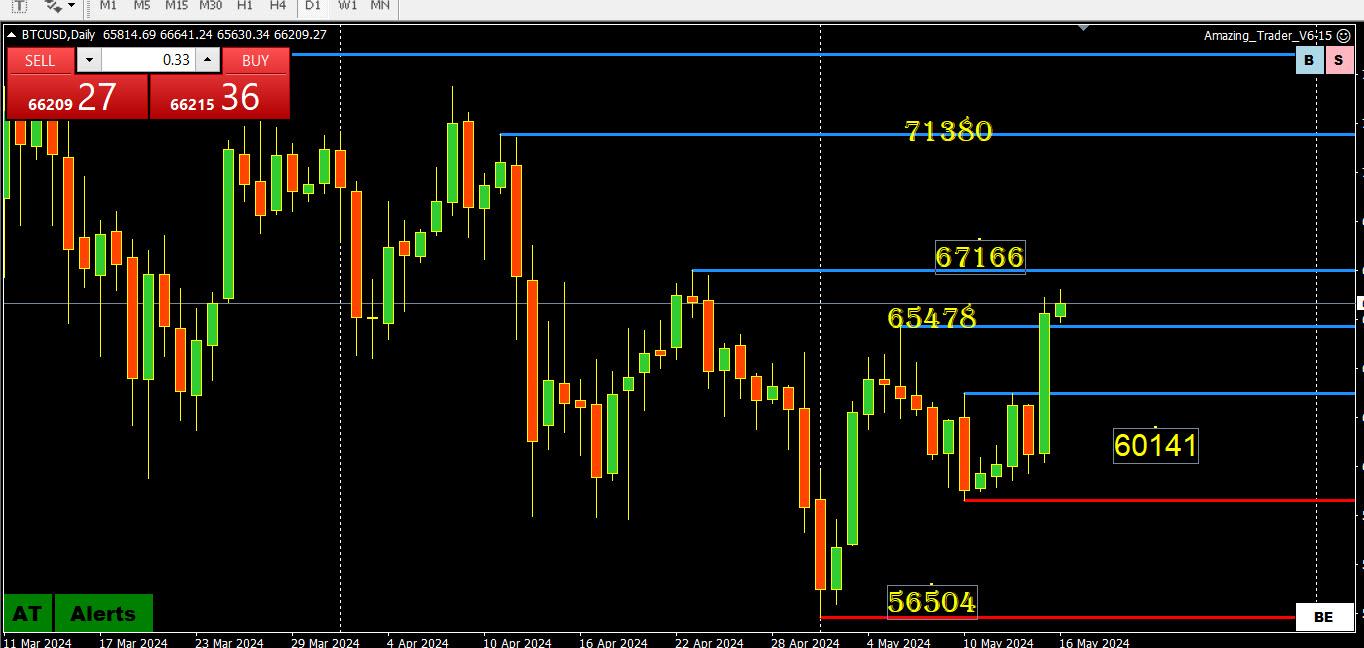
Technical traders may like this but I am not sure about how valid technical levels are in something that can move 5-10% in one day.
This is why I prefer to focus on psychological or what I call “magic” levels such as 60k,65k, and 70k.as well as the pattrtns formed on a chart
In this regard, 65000 is now a key level that needs to hold to put 70000 back on the radar.
If I was focusing on levels 65478 is support and 67166 is a key resistance.
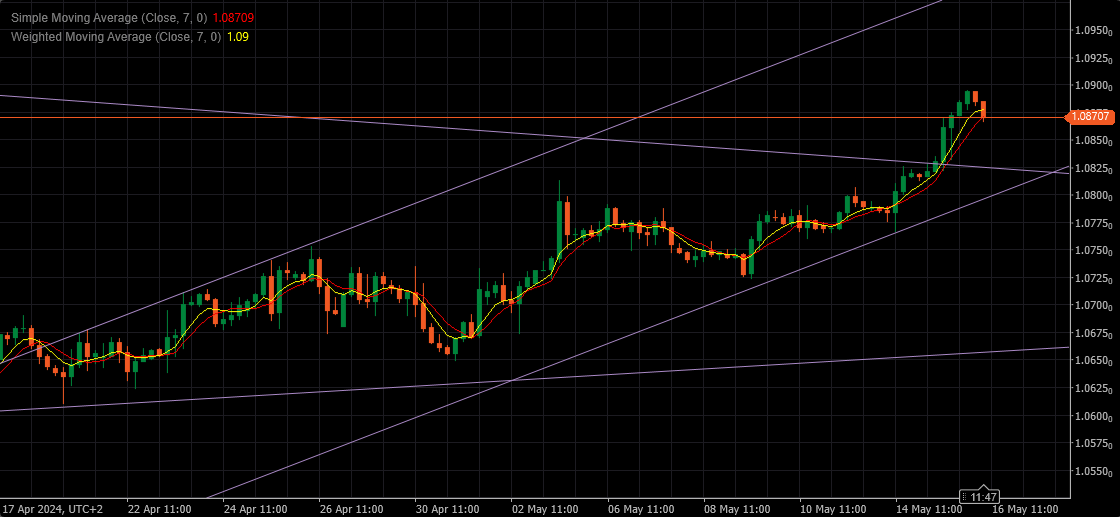
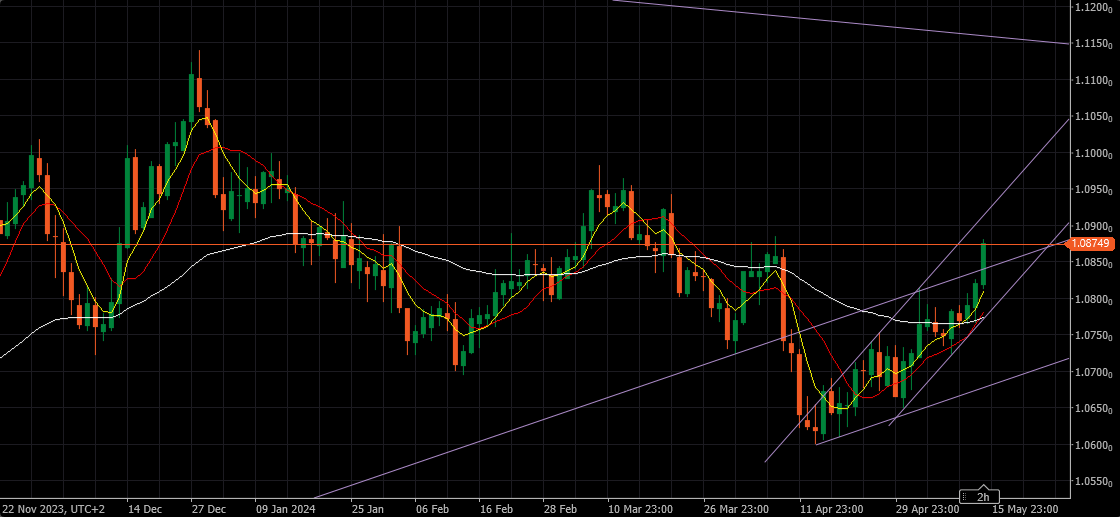
May 16, 2024 at 8:49 am #6366EURUSD 4h
The way I draw my charts
I am going to skip on levels – I want to explain few things here and I will elaborate at length in an article later on.
The trend lines that I come up with ( you probably have seen that sometimes they don’t have much sense in the beginning – there are no “at least two lows/highs to connect”, but later on they prove right…
For now please just bare with me, and look at this chart – I am sure you all have an urge to buy it right now , but is it the right thing to do?
Well, yes it can hit another leg up from here, but more probable is to have at least some kind of a correction first – be it a real wave down or just some sideways one with few downticks – and this is the game of probability and timing !
The trick is to wait for the right pattern to emerge and follow it . That much from me for now…
 May 15, 2024 at 11:46 pm #6365May 15, 2024 at 10:50 pm #6364May 15, 2024 at 10:44 pm #6363
USDX DAILY CHART – BREAKDOWN BUT..
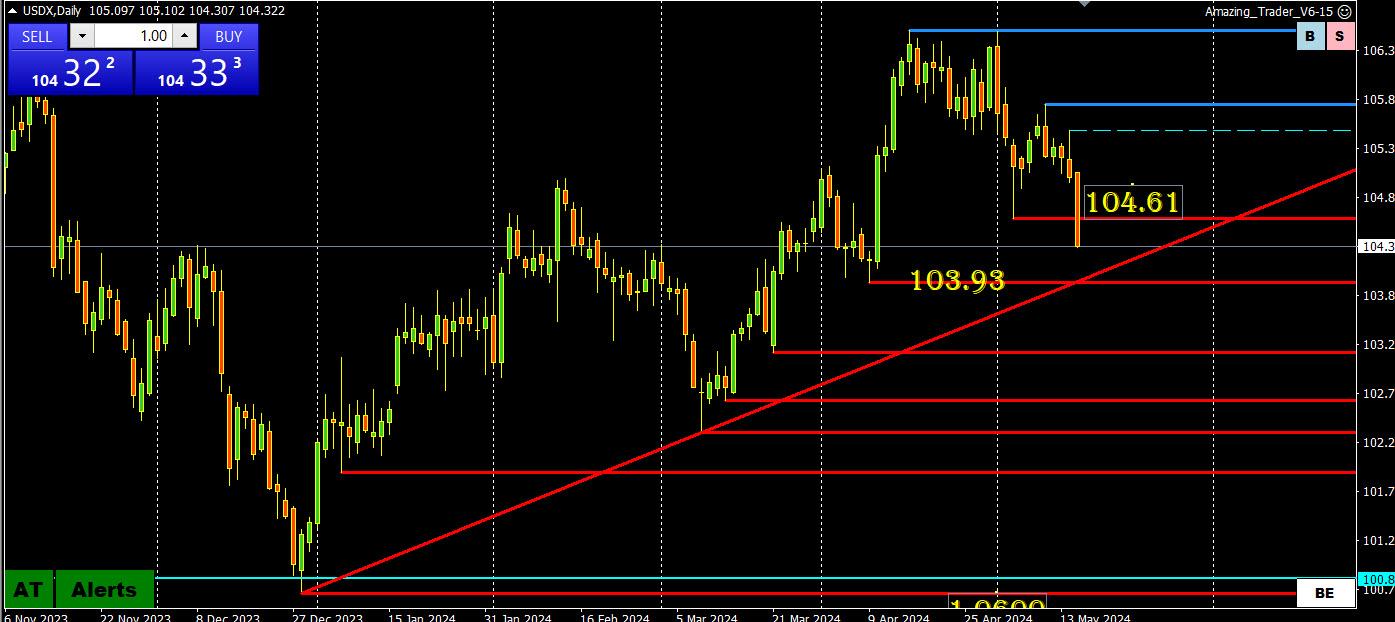
The break of 104.61 confirms a downtrend but to remove all doubts 103.93 and the trendline need to be taken oit.
On the upside, USDX needs to stay below 104.61 to maintain the breakdown.
NOTE THE USD DOWNMOVE STARTED LAST WEEK WITH A JUMP IN US WEEKLY JOBLESS CLAIMS. THIS ELEVATES THIS REPORT IN IMPORTANCE ON THURSDAY.
May 15, 2024 at 10:29 pm #6362May 15, 2024 at 10:10 pm #6361May 15, 2024 at 9:35 pm #6360May 15, 2024 at 8:11 pm #6359May 15, 2024 at 7:57 pm #6358May 15, 2024 at 7:50 pm #6357May 15, 2024 at 7:35 pm #6355May 15, 2024 at 7:24 pm #6354May 15, 2024 at 7:05 pm #6353May 15, 2024 at 7:00 pm #6352May 15, 2024 at 6:56 pm #6351May 15, 2024 at 6:55 pm #6350May 15, 2024 at 6:51 pm #6349May 15, 2024 at 6:47 pm #6348Michael. I never question someone’s trading, especially yours given how far ahead yiu were calling for a buy bias in EURUSD.
But if you don’t mind a discussion of trading, I focus on what side to trade and where there are stops to go after. In this regard, if you know the bottom and not the top, then in this case it is the upside that is at risk and I don’t look for a top until the Amazing Trader gives me a sign to do so.
Just passing on the way I look at trading.
-
AuthorPosts
 US500 DAILY CHART – UNCHARTERED WATERS

- You must be logged in to reply to this topic.
Search
© 2024 Global View