
- This topic has 28,062 replies, 54 voices, and was last updated 5 hours, 22 minutes ago by GVI Forex 2.
-
AuthorPosts
-
July 13, 2024 at 8:40 am #9091July 12, 2024 at 7:05 pm #9076July 12, 2024 at 6:50 pm #9075
Jay – further, it is why I often include notation of multiple instruments (neural network approach) to add perspective and hopefully be helpful. After reverse engineering seemingly a thousand indicators in coding, producing my own unique codes (some of which were visually stunning and some ridiculous in the visual output) the final product ended up like a high frequency algorithm with a very simple display. The original intent was to make it so simple to allocate upon you could do it when exhausted and unable to think with your usual clarity.
Bottom line is yes, like a magnet. Big money has to revisit certain areas with extremely few exceptions.
July 12, 2024 at 6:41 pm #9074Jay – it is order based so yes. There are occasional times it ends up being close to any number of indicators but absolutely not the same and extremely reliable. It will coincide at times with a moving average point, other times a stochastic point, other times options orders, other times bollingers, on occasion volume profile, other times you name it. But if you think you will manufacture by using those things you will not end up with the same result. My best version was done on Esignal, which you have to pay a lot of money for. Currently using a hybrid which is not as good but close enough.
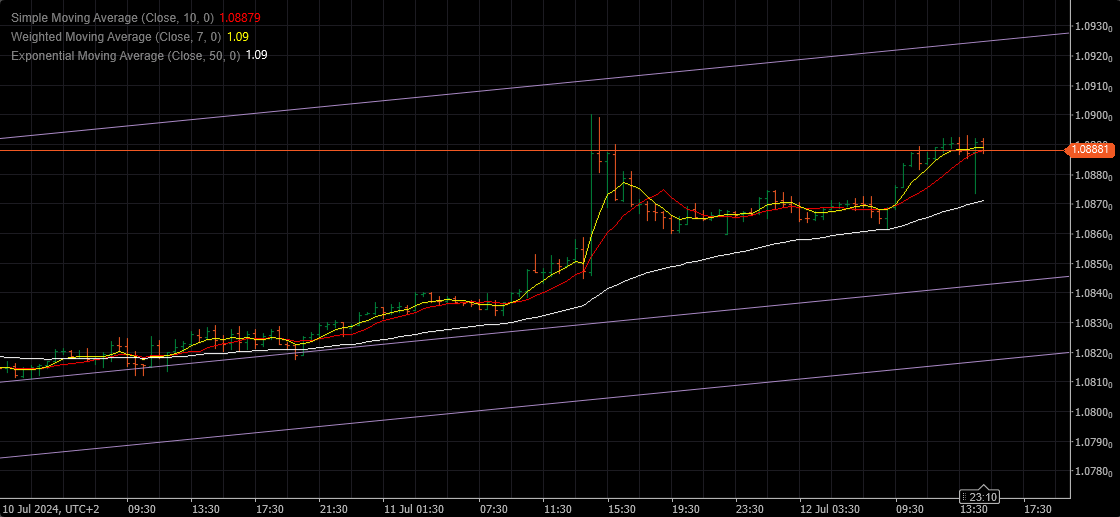
July 12, 2024 at 6:32 pm #9073EURUSD DAILY CHART – How bid?
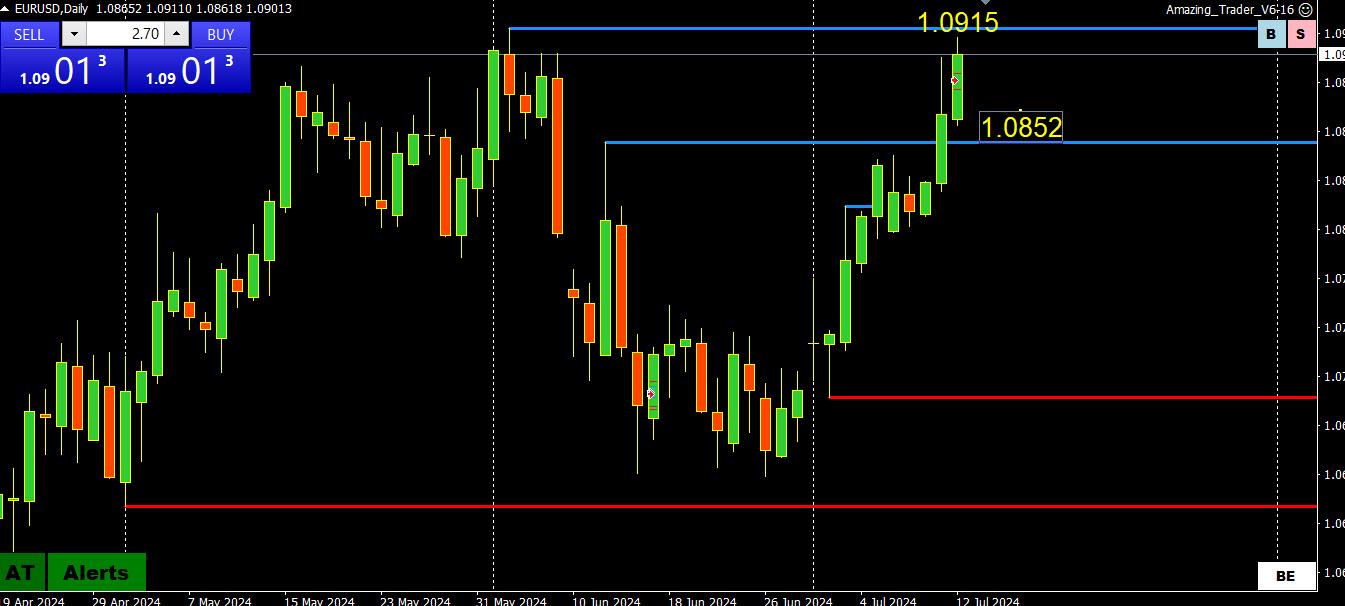
A bit if a disappointment as a break of a big figure is usually good for 20-35 pips. Instead it has been sideways watching paint dry afternoon.
Here’;s the story
Bid while above 1.0850
Stronger bid if above 1.09
If 1.0915 is firnly broken, then 1.0980 becomes a target
If 1.09 fails to hold, then it is 1.0850/60-1.0900-10
ECB meets next week
July 12, 2024 at 6:17 pm #9072July 12, 2024 at 5:51 pm #9071July 12, 2024 at 5:47 pm #9070Jay –
Point of control is where the more weighty transactions take place for any given instrument. While there is no guarantee that those areas will be revisited in the fashion I noted earlier, but the probabilities are very strongly weighted they will. That is due in part to the fact that large orders from large institutions/entities transact there. This is based on decades of factors of input for analysis, with the result being solid in terms of probability. One of the better forms of imagery I could compare it to is a volume profile. Be advised, this is not a volume profile and you will not find it there. But in some ways there are similarities. Having it is step one. Step two is application that actually works. Requires dedication.
July 12, 2024 at 5:15 pm #9069July 12, 2024 at 4:48 pm #9068UsdCad 3620 (which is current market) is the point of control in spot, with 7350 the point of control in futures for Canadian Dollar (which is current market). Regardless of how markets behave up or down, these price levels will be revisited in August. My preference is the sell side in spot in the 3680-90 zone at present if/when seen.
July 12, 2024 at 4:11 pm #9067July 12, 2024 at 3:28 pm #9066July 12, 2024 at 3:21 pm #9065I prefer to be on the sell side of UsdSwiss Franc for risk management purposes into the weekend.
A German defense industry executive of a major producer of tanks and weaponry, some of which has been shipped to Ukraine, was the target of a Russian assassination plan in recent weeks which did not play out. When I learned of this I made some phone calls to some old friends and there is legitimate unease within military/defense circles at present. Moscow has been engaged in cyber attacks, espionage, sabotage, and one aggressive act not publicized in media.
The situation is escalating in Eastern Europe and should be watched closely as it is clear Moscow has zero apprehension to escalate. One event would cause Euro to shock currency markets to the downside. At present, some NATO member countries are only paying 60% of their required defense contributions while the US has a dysfunctional Congress and no President or Vice President.
July 12, 2024 at 2:01 pm #9052July 12, 2024 at 1:52 pm #9045I will likely sell UsdCad around 3670/80 if seen.
The US and Canada signed revised the 60 year long standing treaty today whereby Canada received 50% of hydroelectric power generated by the Columbia River Dam and will receive 40% less of that amount going forward beginning in August. The revision was in response to population demand in the US over time. Hopefully this counters the graveyard of US oil/gas permits and related production in the US since 2020 and helps to reduce prices a small bit, which obviously soared virtually out of control in recent years. The treaty (get this) can be unilaterally revised or terminated by either country as of September and/or for the life of the new 20 year term. — One month. Oil/gas data up 10am PST.
EurGbp – staying on the sell side from 8920 holds good R/R, you can forgive yourself if the bias changes. It would require fierce buying over 8940 to change the bias.
July 12, 2024 at 1:46 pm #9044This is a good time to revisit this article assuming it was the BoJ intervening these past 2 days
Trader Alert: Will the Bank of Japan Intervene and Does Forex Intervention Work?
 July 12, 2024 at 1:34 pm #9042
USDJPY ONE HOUR CHART – INTERVENTION DOUBLE BOTTOM?

This is why I love The Amazing Trader
In the heat of battle, if inf act this was another round of intervention, I ran to the chart and as I posted, saw the low yesterday was 157.41
Last now at 158.12
July 12, 2024 at 1:11 pm #9040July 12, 2024 at 1:10 pm #9039July 12, 2024 at 12:43 pm #9037July 12, 2024 at 12:31 pm #9036July 12, 2024 at 12:25 pm #9035July 12, 2024 at 12:23 pm #9034July 12, 2024 at 12:16 pm #9033July 12, 2024 at 12:16 pm #9032July 12, 2024 at 12:07 pm #9031Data on deck
US PPI and Univ of Mich consumer sentiment where inflation expectations will be the focus
July 12, 2024 at 11:19 am #9030July 12, 2024 at 11:00 am #9026What is sectior rotation?
Sector rotation is an active investing strategy that involves moving money between stock sectors to keep it in the best-performing sectors. Investors and traders use this strategy in anticipation of the next stage of the economic cycle, when most industries and their companies will either thrive or struggle….AI Overview
July 12, 2024 at 10:59 am #9025July 12 (Reuters) – A look at the day ahead in U.S. and global markets from Mike Dolan
A violent rotation from Big Tech into small cap stocks followed the surprisingly benign June U.S. inflation report, while U.S. borrowing rates and the dollar plunged and Japan’s yen stole the currency show.
July 12, 2024 at 10:56 am #9024EURUSD DAILY CHART – POWER OF 50
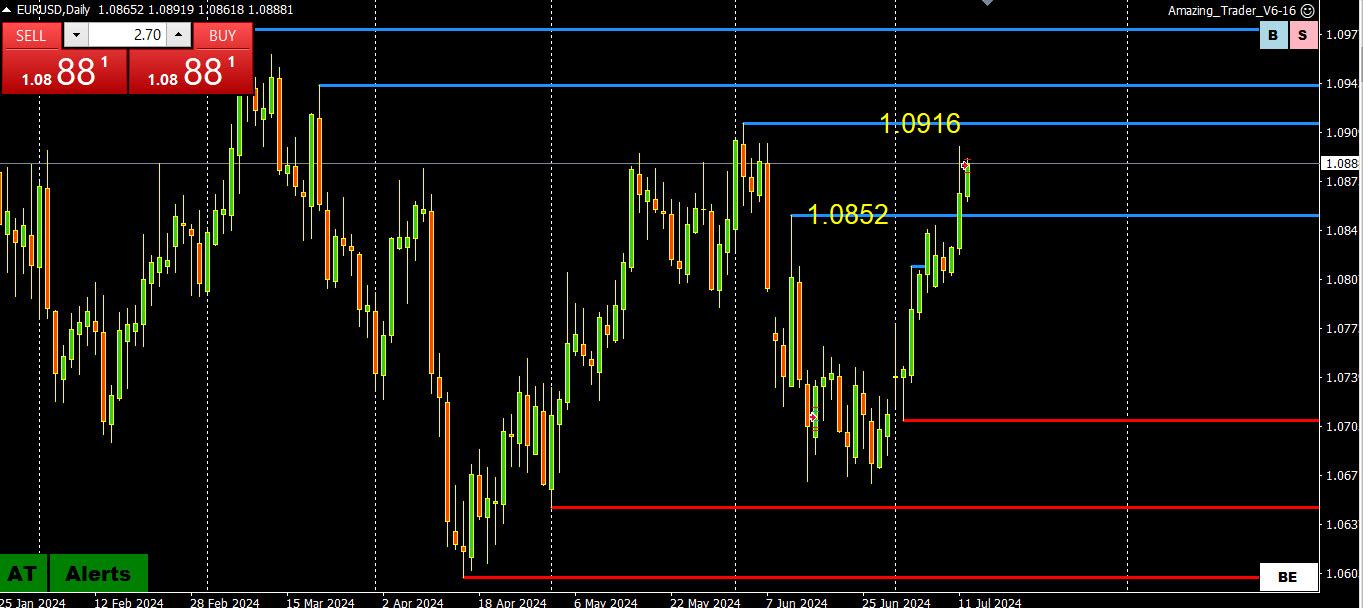
1.0852 breakout targets 1.0916 next as long as it stays above this level.
It is why I csaid earlier 1.0850 sets the bias.
Only below 1.0850 would postppne the threat
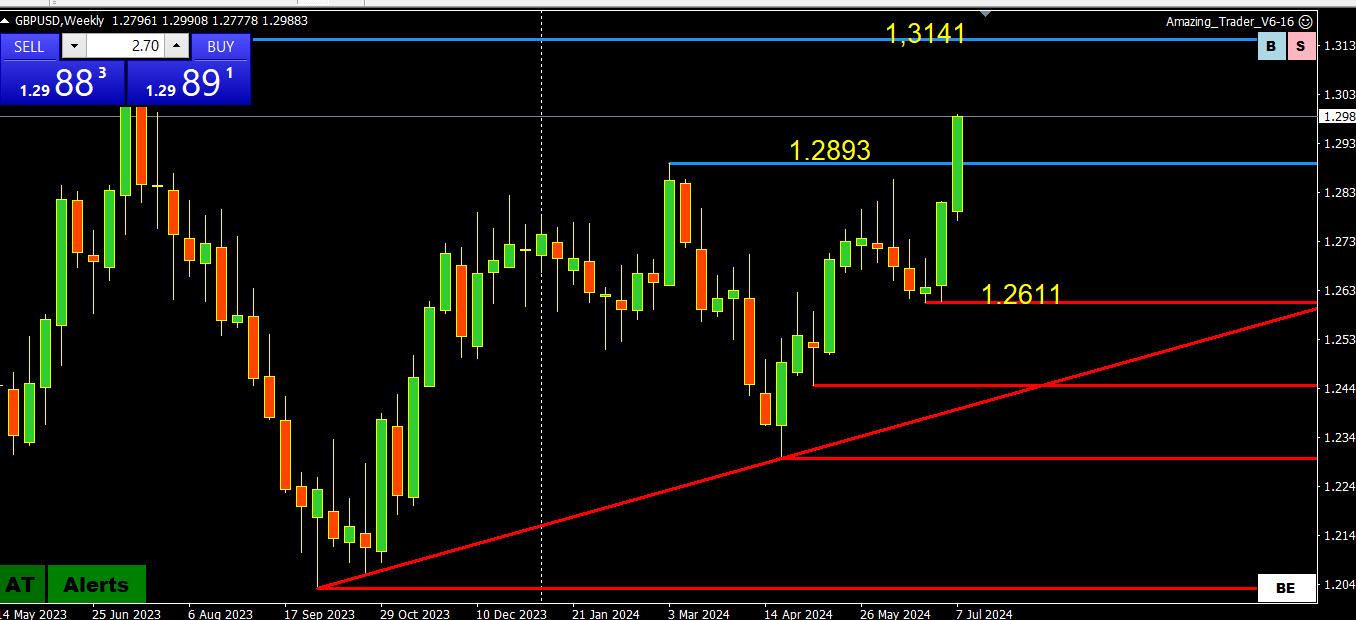
The high so far has been 1.0899, only GBPUSDD has so far extended its high..
Above 1.0916 would expose potential for 1.10
-
AuthorPosts
- You must be logged in to reply to this topic.
Search
© 2024 Global View