
- This topic has 28,090 replies, 54 voices, and was last updated 7 minutes ago by GVI Forex 2.
-
AuthorPosts
-
July 28, 2024 at 9:11 pm #9726July 28, 2024 at 9:09 pm #9725July 28, 2024 at 9:04 pm #9724
BTCUSD Weekly Chart
Resistances at : 70.750 , 73.850 & 78.400
Supports at : 65.500 , 64.250 & 54.150
 July 28, 2024 at 11:05 am #9710July 27, 2024 at 10:22 pm #9709
I can’t remember a week chock full of key events like this one: 3 key monetary policy meetings, US data, CPI, and month end.
The best I can guarantee is there will be voatility around these key events,
How markets end the week will give a clue how they might trade going fotwards.
See full detailed previews
‘
Newsquawk Week Ahead 29th July-2nd August: Highlights include FOMC, BoJ, BoE, NFP, ISM Mfg. PMI and OPEC+ JMMC July 26, 2024 at 11:40 pm #9693
AN ACHIEVEMENT Called “Success”
TAX THE BILLIONAIRES
G20 countries agree on need to tax the super-rich — but later
Brazilian Finance Minister Fernando Haddad welcomed what he called an “historic” agreement.
U.S. Treasury Secretary Janet Yellen, who in Rio said the U.S. doesn’t “see a need or really think it’s desirable to try to negotiate a global agreement on that.”July 26, 2024 at 7:34 pm #9690Tesla – TSLA
Tesla’s stock dropped 12.3% after second- quarter earnings missed expectations, highlighting a weak quarter for the company.
Tesla, Inc. was upgraded by President Capital to Buy, price target now $255, up from $185. Fubon Securities also increased their target to $282. Analyst targets range $85-$310, showing mixed views.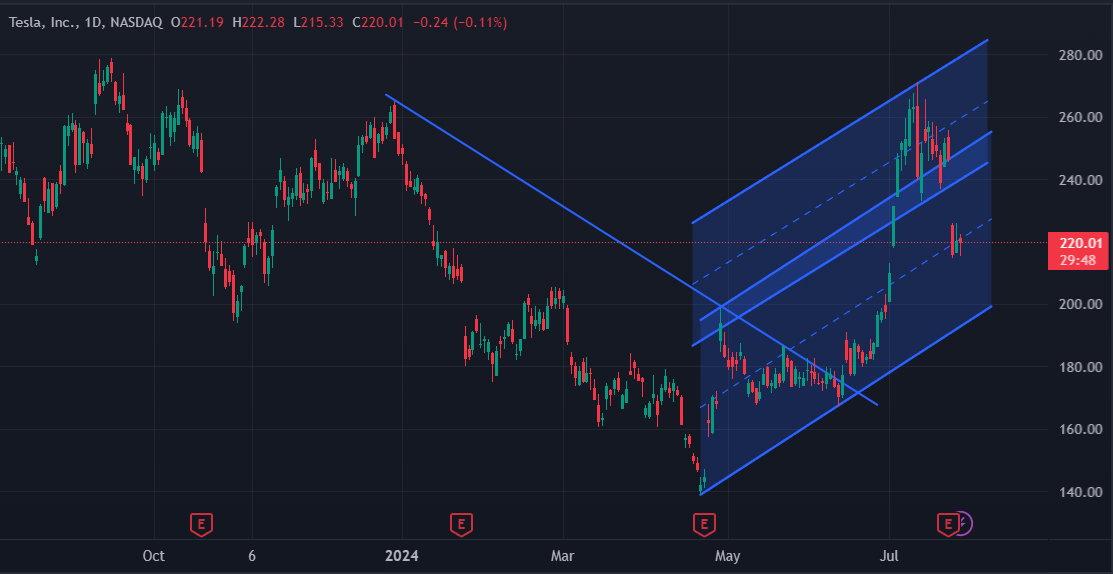 July 26, 2024 at 7:29 pm #9689
Nvidia – NVDA
Nvidia among chip stocks clawing back. What investors should watch for.
Nvidia Corp. shares (NVDA) are up 2.9% in morning action, while Advanced Micro Devices Inc. shares (AMD) are ahead 1.8%. Micron Technology Inc.’s stock (MU) is ahead 1.8% as well. All three had staged three consecutive sessions of declines prior to Friday.
Too much depends on how [Nvidia’s] earnings and guide looks in a month.” Nvidia earnings are due on Aug. 28.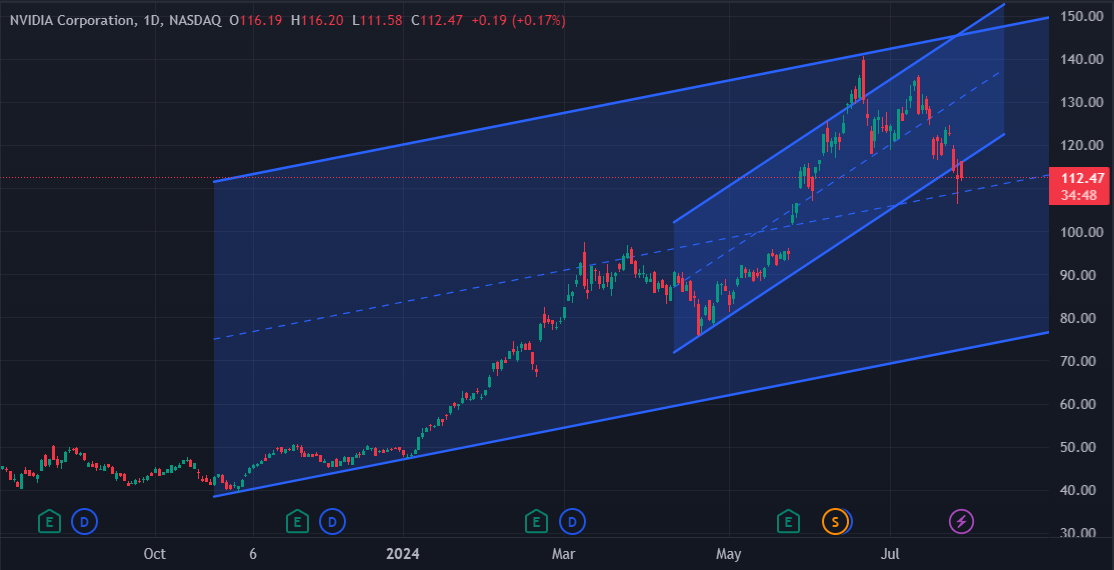 July 26, 2024 at 7:24 pm #9688
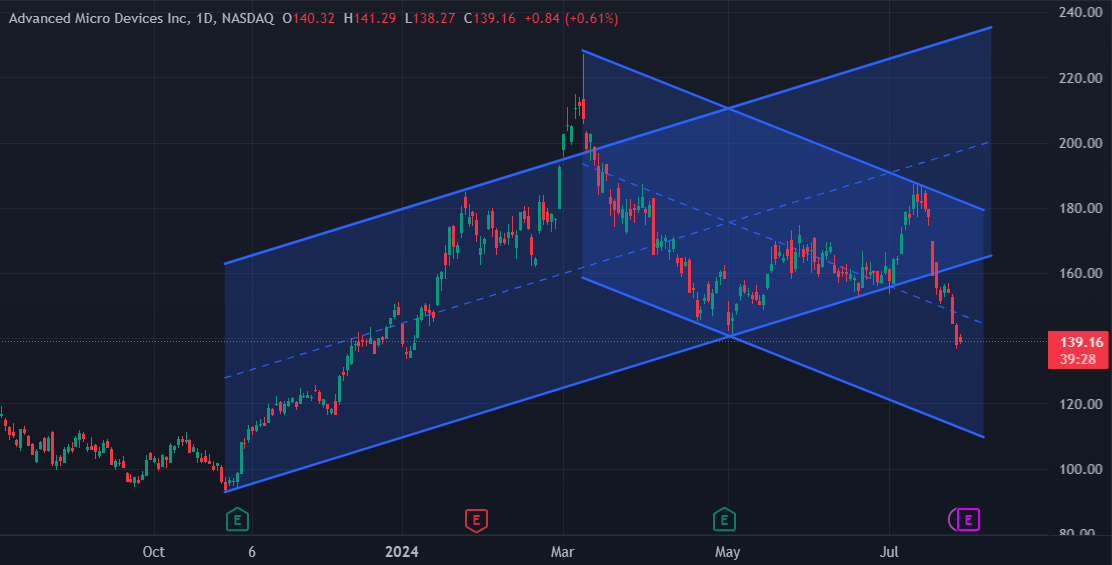
Advanced Micro Devices, Inc. (AMD) Is a Trending Stock: Facts to Know Before Betting on It
Shares of this chipmaker have returned -13.3% over the past monthFor the current quarter, Advanced Micro is expected to post earnings of $0.67 per share, indicating a change of +15.5% from the year-ago quarter.
 July 26, 2024 at 7:19 pm #9687July 26, 2024 at 7:17 pm #9686July 26, 2024 at 7:11 pm #9685July 26, 2024 at 4:32 pm #9684
Over a $50 Trillion demand increase is expected for H2 of this year in Gold. If your preference is stocks instead of futures or spot correlated currencies, but you want to spread your allocation with relation to gold related holdings, consider defense related stocks which significantly require gold for product production. An example would be Raytheon, which builds missiles and radar systems among other things, or other entities involved with satellites or other dependent systems. Its also a decent addition to hedge against sudden market shocks.
Q: Do I suspect pending sudden shocks looking outward? A: Very stupid and bad people exist.
July 26, 2024 at 2:11 pm #9683July 26, 2024 at 2:06 pm #9682July 26, 2024 at 1:49 pm #9681July 26, 2024 at 1:45 pm #9680July 26, 2024 at 1:25 pm #9679July 26, 2024 at 1:02 pm #9678July 26, 2024 at 11:46 am #9675On the day of alleged FED’s prefered inflation gage
–
US 10-YR 4.232%
DLRx 104.11 /// 200d ma 104.33players are panting at prospect of FED easing. Not this time around but in Sep.
meaning tghat the current implication is that DLR upside is / should be limited if not outright softFOMC and BoJ on the 31, BoE on Aug 1.
DLRJPY 151.90 appears meaningfully meaningful, if only to carry and leverag playes.
Res 155July 26, 2024 at 11:15 am #9674July 26, 2024 at 11:05 am #9673July 26, 2024 at 10:07 am #9669July 26, 2024 at 10:03 am #9668July 26, 2024 at 9:39 am #9666AUDUSD DAILY CHART – GREEN CANDLE

I AM ALWAYS ON THE LOOKOUT FOR PATRTERNS.
I have been watching AUDUSD and AUDJPY for signs of carry trade unwind pressures.
AUDUSD so far has first green candle after 9 red ones in a row.
AUDJPY has second green canbdle in Past 12 session (other green candle was abrief one day pause).
This has implications for markets in general.
With that said, THIS IS STILL JUST A BOUNCE SO watch .6550 as it will set the tone in AUDUSD (i.e. needs to trade above it to give it a bid).
July 26, 2024 at 9:31 am #9664USDJPY 4 HOUR CHART – WATCH THE TRENDLINE
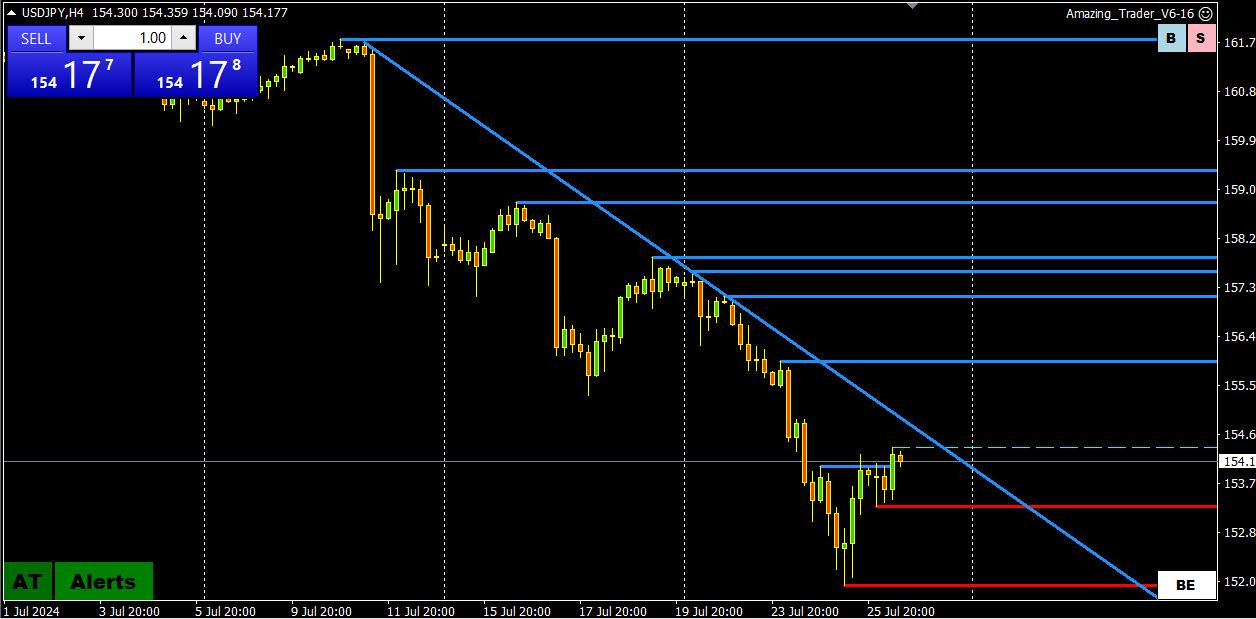
Key BOG FIGURE LEVELS levels 152 and 155 after 152 held
Key line on the chgart is the trendline at around 154.84, if broken it would ease some technical pressure but 155+ would be needed as well.
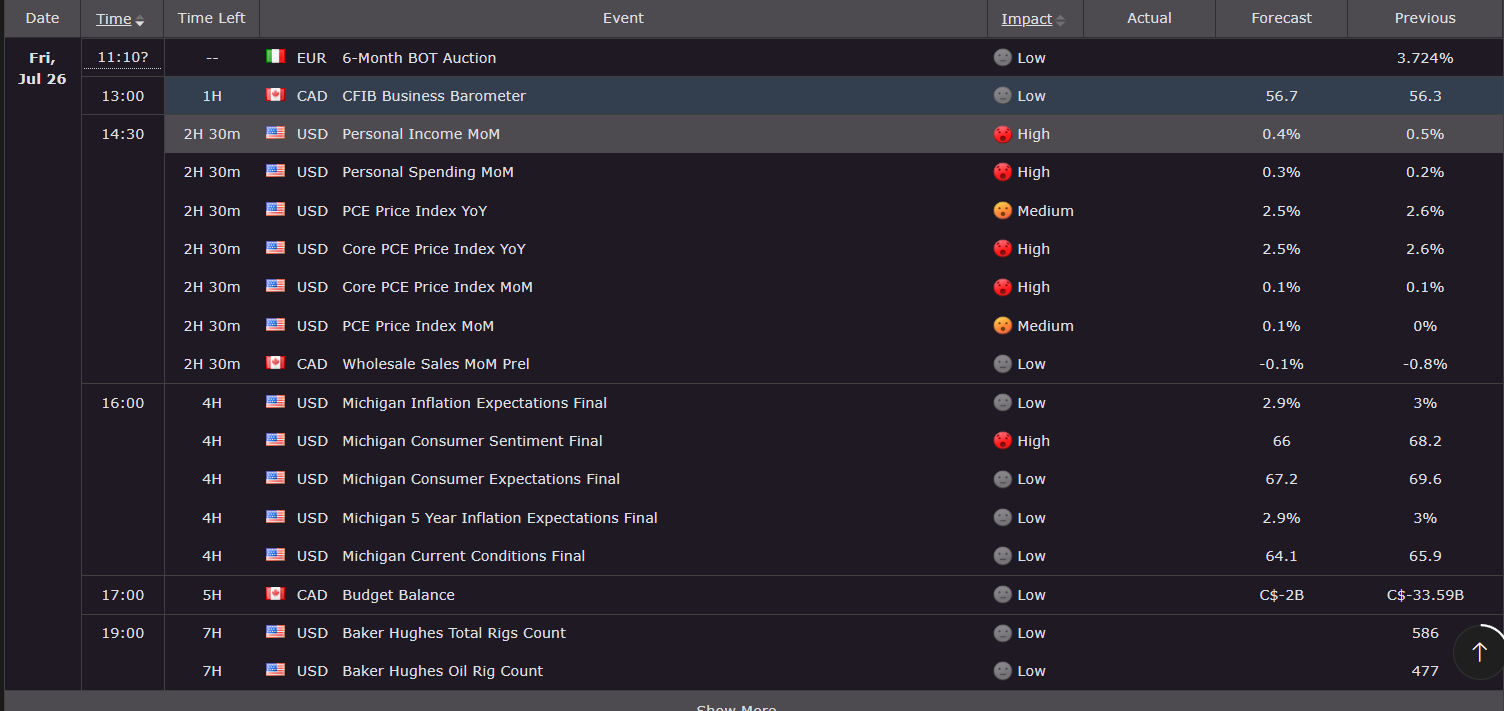
Focus next on US PCEm the Fed;s favored inflation indicatpr.
REMINDER, BOJ MEETING NEXT WEEK.
July 26, 2024 at 9:31 am #9665USDJPY 4 HOUR CHART – WATCH THE TRENDLINE

Key BOG FIGURE LEVELS levels 152 and 155 after 152 held
Key line on the chgart is the trendline at around 154.84, if broken it would ease some technical pressure but 155+ would be needed as well.
Focus next on US PCEm the Fed;s favored inflation indicatpr.
REMINDER, BOJ MEETING NEXT WEEK.
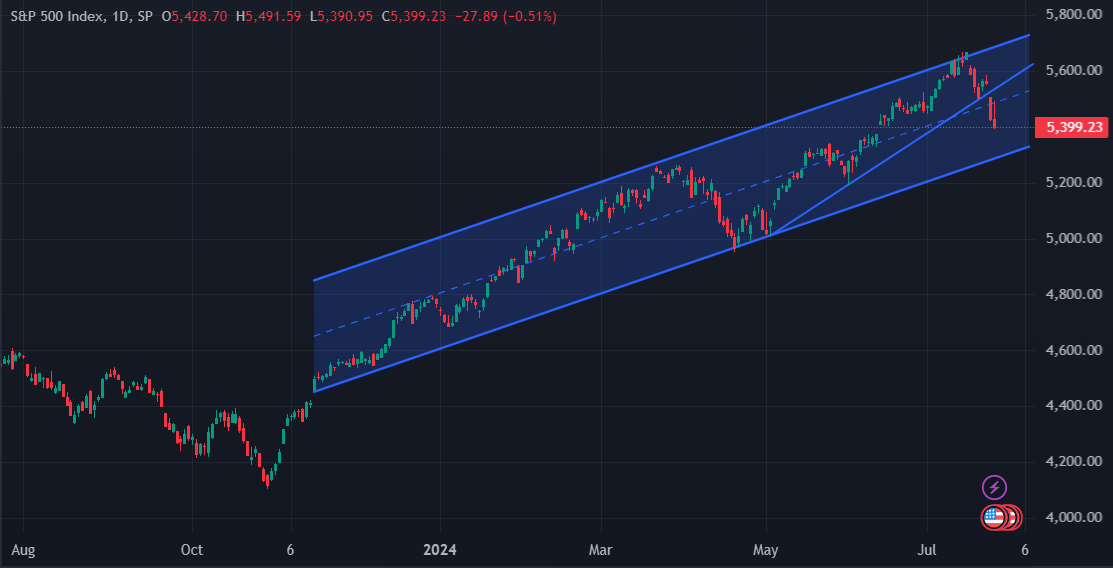
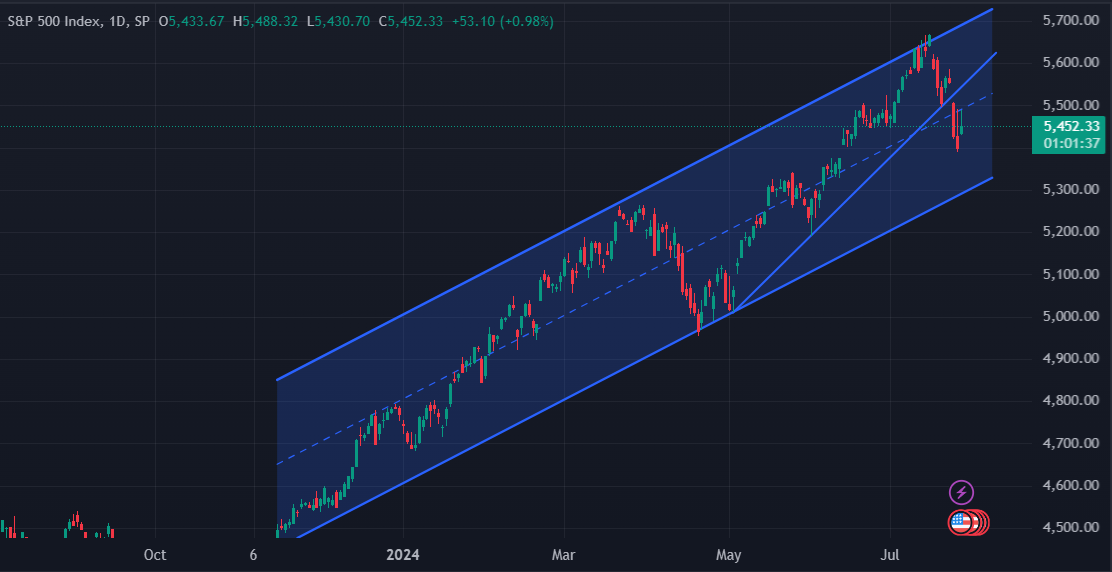
July 25, 2024 at 8:21 pm #9663S&P 500 index
After sharp slide, seeking to stabilize – Major News Media
But looking at the chart, things are not even close to stabilizing – Guess they are trying to go with some self fulfilling prophecy of a kind…Last line of Defence for S&P is in 5.300 area. If it holds, I’ll call it as I see it…
So far I see a deeper correction and a violent one, but no need to wake up Bears – Yet.
 July 25, 2024 at 8:12 pm #9662
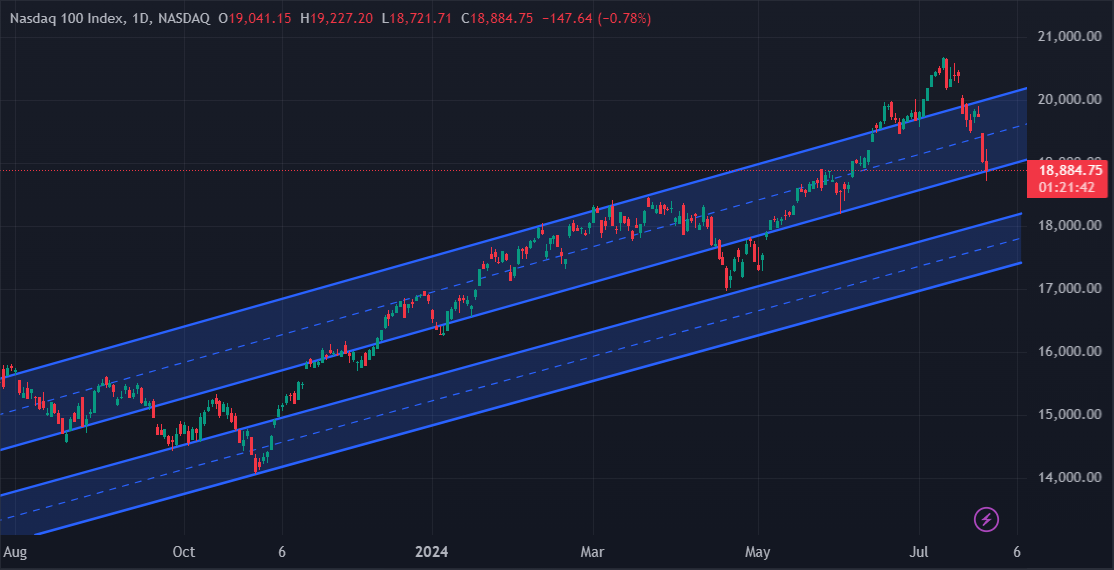
Nasdaq 100 – NDX
Tech-led selloff drives record volume in NDX options
The selloff in U.S. stocks is driving record trading options on the Nasdaq 100 Index NDX as the tech-heavy gauge is battered by turbulence in giant tech stocks.
The index – in which about 70% of the companies represented are tech – has slipped 7% from its July 10 record high in a tumble that has rattled the megacap names which have powered markets higher this year. By comparison, the S&P 500 is off 4% from its record, also set earlier this month.
 July 25, 2024 at 8:04 pm #9661
-
AuthorPosts

- You must be logged in to reply to this topic.
Search
© 2024 Global View