
- This topic has 28,383 replies, 54 voices, and was last updated 13 minutes ago by GVI Forex 2.
-
AuthorPosts
-
August 6, 2024 at 12:28 pm #10152August 6, 2024 at 12:22 pm #10151
further to “the FED as biggest problem”
blame game by Myles Udland, Head of News at yahoo
…” last week’s market turn had a clear catalyst: the Federal Reserve. this remains the cleanest way to understand why the stock market’s year of smooth sailing has come to an abrupt end. When the Fed held interest rates steady last week, investor reactions suggested the central bank had made a policy mistake by not taking the chance to lower rates before the economy showed signs of weakness.which , really, is not news but hind-sight rehash of what is now history
probably more useful opinion is JMP’s musing that things carry-trade are only half done
August 6, 2024 at 11:23 am #10150better late than not at all ?
gimme a break !! … by early afternoon(Bloomberg) — Retail brokerages Charles Schwab Corp. and Fidelity Investments reported outages amid a global stock-market selloff Monday, though both said their issues were resolved by the early afternoon.
More than 15,000 users had reported an outage at Schwab at 9:50 a.m. in New York
“We apologize for the inconvenience,” SchwabAugust 6, 2024 at 11:15 am #10149Headlines digest
and, allegedly, “the biggest problem”
–
Reuters Futures recover on positive Fed rate remarksJapan Officials Strive to Restore Calm After Market Whipsaws
(Bloomberg) — Japan’s government and central bank sought to show a united front and restore calm to financial markets, after blablablaJPMorgan Says Unraveling of Carry Trade Is Only Half Complete
(Bloomberg) — The recent unwinding in carry trade has more room to run as the yen remainsStocks still have the same problem after a wild Monday in markets: Morning Brief
The stock market was rocked Monday, but a third straight day of selling pressure didn’t change the biggest problem for investors right now: the Federal Reserve. (hahahahaha, rofl)(Bloomberg) — Buying US stocks after a slump of the scale witnessed over the past month has usually been profitable, according to a Goldman Sachs Group Inc. analysis of four decades of data.
Since 1980, the S&P 500 Index has generated a median return of 6% in the three months that followed a 5% decline from a recent high, according to the Goldman strategy team led by David Kostin. The benchmark has slumped 8.5% from its mid-July peak.
“Corrections of 10% have also been attractive buying opportunities more often than not,” although the track record is not as strong as after a smaller drop, Kostin wrote in a note. Returns after a 5% decline have been positive in 84% of episodes, the research shows.
August 6, 2024 at 10:57 am #10148A look at the day ahead in U.S. and global markets from Mike Dolan
The speed and scale of Tuesday’s 10% Tokyo bounce after its worst day in 37 years suggests the wild global market swings of the past week are more rooted in speculative churn than economic fright.
August 6, 2024 at 10:39 am #10147August 6, 2024 at 10:13 am #10146August 6, 2024 at 10:03 am #10145August 6, 2024 at 9:58 am #10144GBPUSD 4 HOUR CHART – UNDERPERFORMER
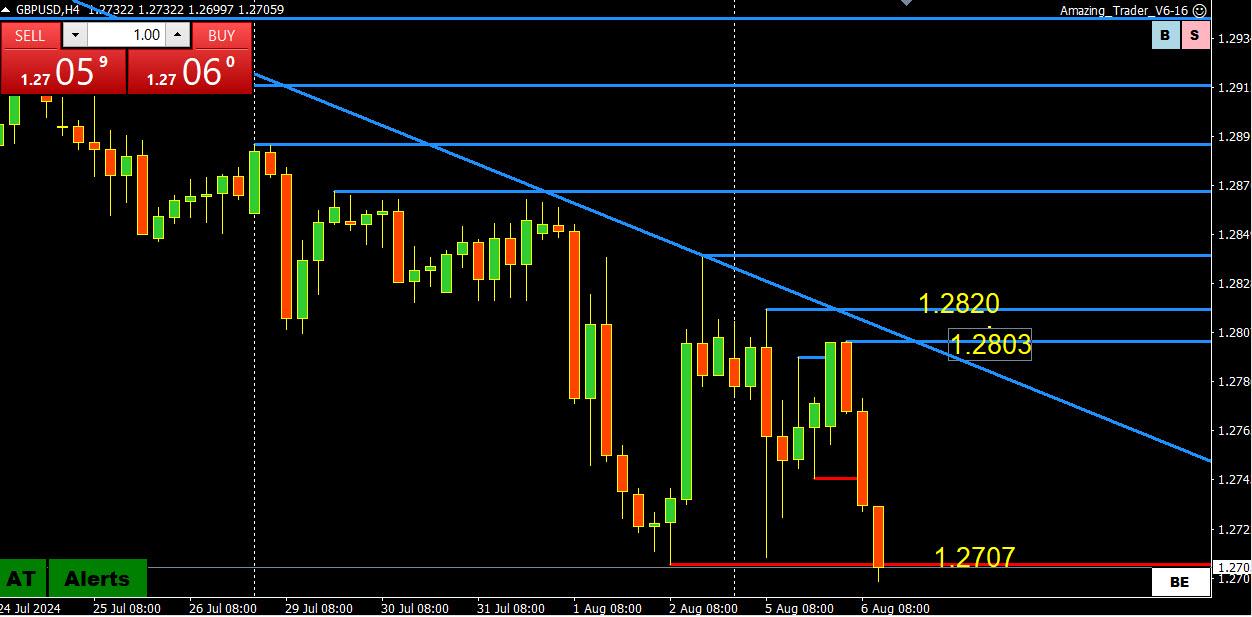
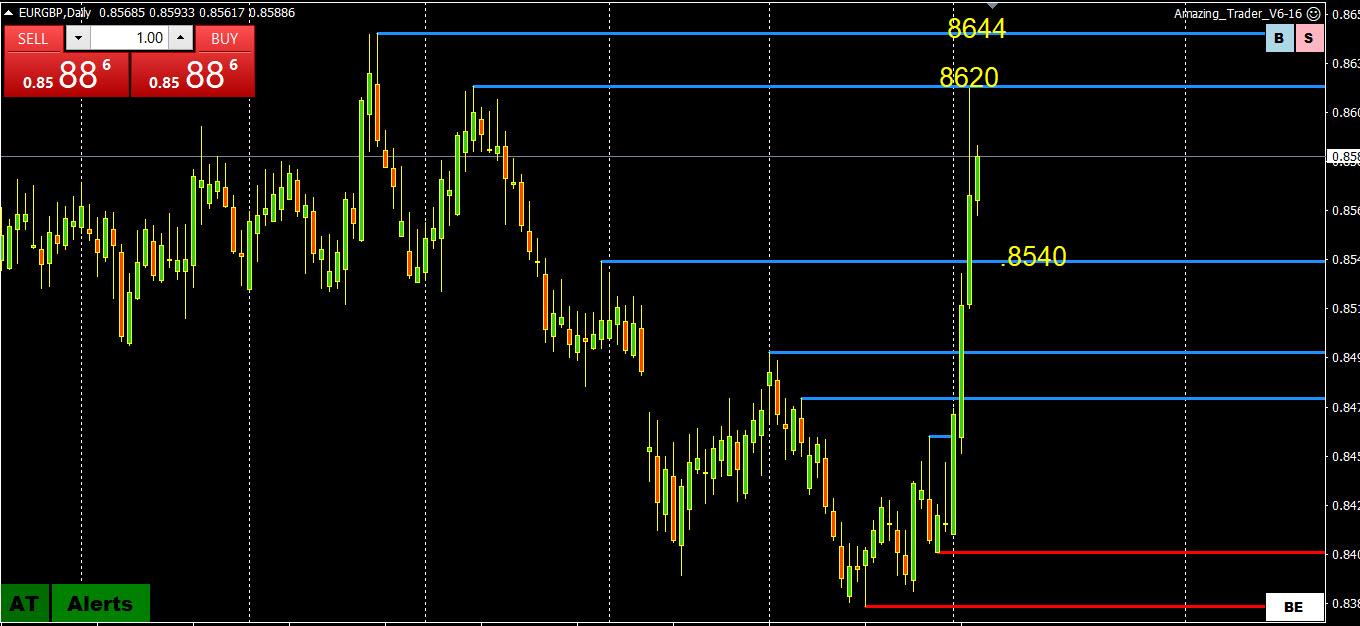
GBP continues to underperform, with weakness SEEN not only vs. the USD but on its crosses (note firmer EURGBP).
Chart wise, key support is not until 1.2612, the base of the move to 1.3044.
Needs to trade below 1.2700-07 to expose it, so far 1.27 is holding,
On the upside, 1.2800-20 would need to be regained to neutralize the risk
August 6, 2024 at 9:36 am #10143USDJPY 4 HOUR CHART – RETRACEMENT?
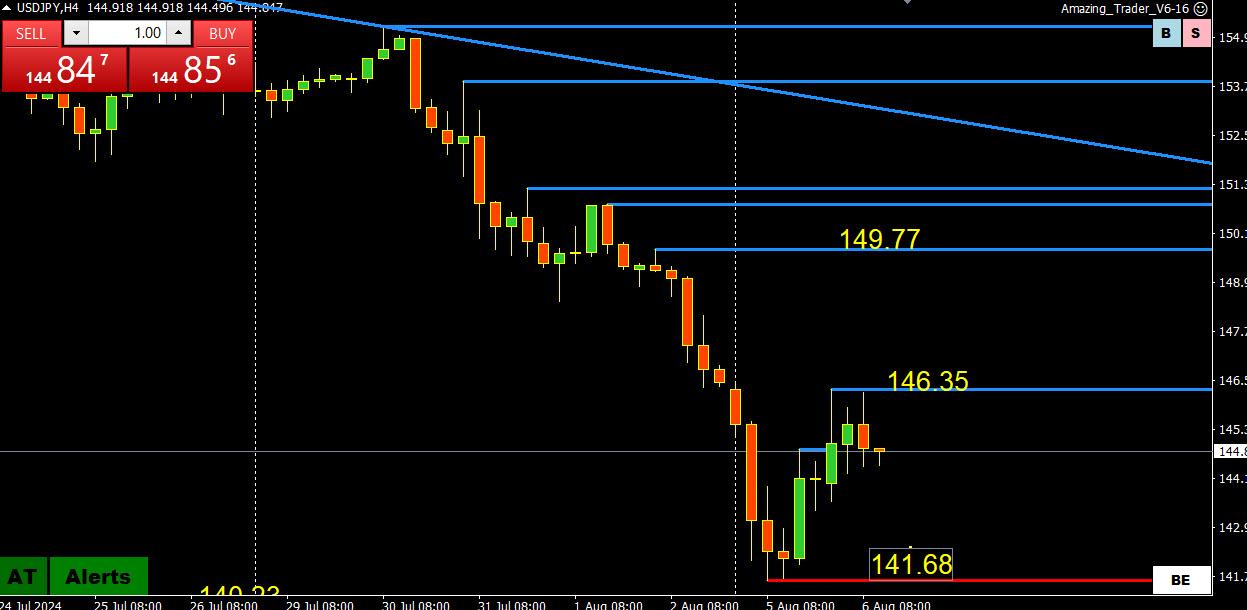

Assuming the big part of the JPY carry trade unwind is over, the market will need to find a fresh catalyst to push USDJPY even lower, especially with the BoJ likely lurking to prevent an avalanche of selling.
In any case, USDJPY is clearly pivotal and will eventually dictate whether there is a serious run at either side of 140-150. Note any correlation with how US stocks are trading.
Using retracements, today’s high bounced off the 23,6% FIBO as shown below.

 August 6, 2024 at 9:36 am #10142
USDJPY 4 HOUR CHART – RETRACEMENT?
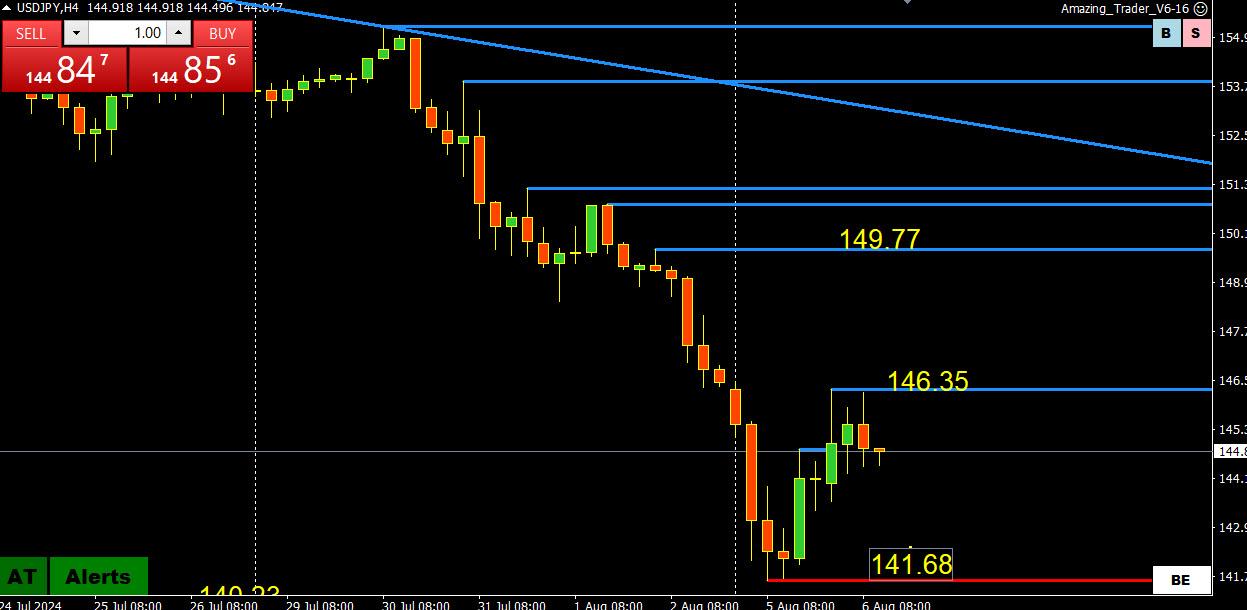
Assuming the big part of the JPY carry trade unwind is over, the market will need to find a fresh catalyst to push USDJPY even lower, especially with the BoJ likely lurking to prevent an avalanche of selling.
In any case, USDJPY is clearly pivotal and will eventually dictate whether there is a serious run at either side of 140-150. Note any correlation with how US stocks are trading.
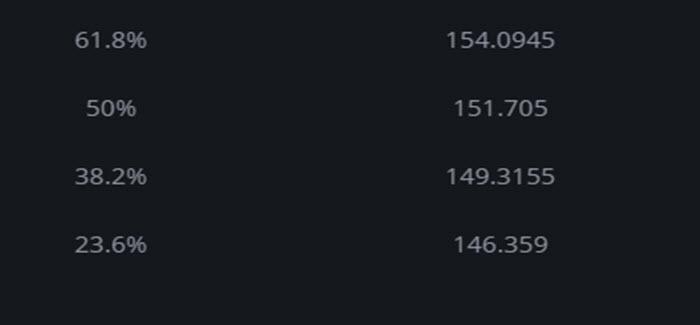
Using retracements, today’s high bounced off the 23,6% FIBO as shown below.
 August 6, 2024 at 7:46 am #10141August 6, 2024 at 12:43 am #10139August 6, 2024 at 12:21 am #10138August 6, 2024 at 12:09 am #10137August 6, 2024 at 12:03 am #10136August 5, 2024 at 10:28 pm #10134
Summary
U.S. data doesn’t support scale of market meltdown – analystsHuge carry trade unwind a better explanation
Further pain likely short-term
LONDON, Aug 5 (Reuters) – A meltdown in world equity markets in recent days is more reflective of a wind-down of carry trades used by investors to juice their bets than a hard and fast shift in the U.S. economic outlook, analysts say.
Global market rout has more to do with end of cheap funding than US economy
August 5, 2024 at 10:28 pm #10133Summary
U.S. data doesn’t support scale of market meltdown – analystsHuge carry trade unwind a better explanation
Further pain likely short-term
LONDON, Aug 5 (Reuters) – A meltdown in world equity markets in recent days is more reflective of a wind-down of carry trades used by investors to juice their bets than a hard and fast shift in the U.S. economic outlook, analysts say.
Global market rout has more to do with end of cheap funding than US economy
August 5, 2024 at 10:16 pm #10132AUDUSD 4 HOUR CHART – RBA ON DECK
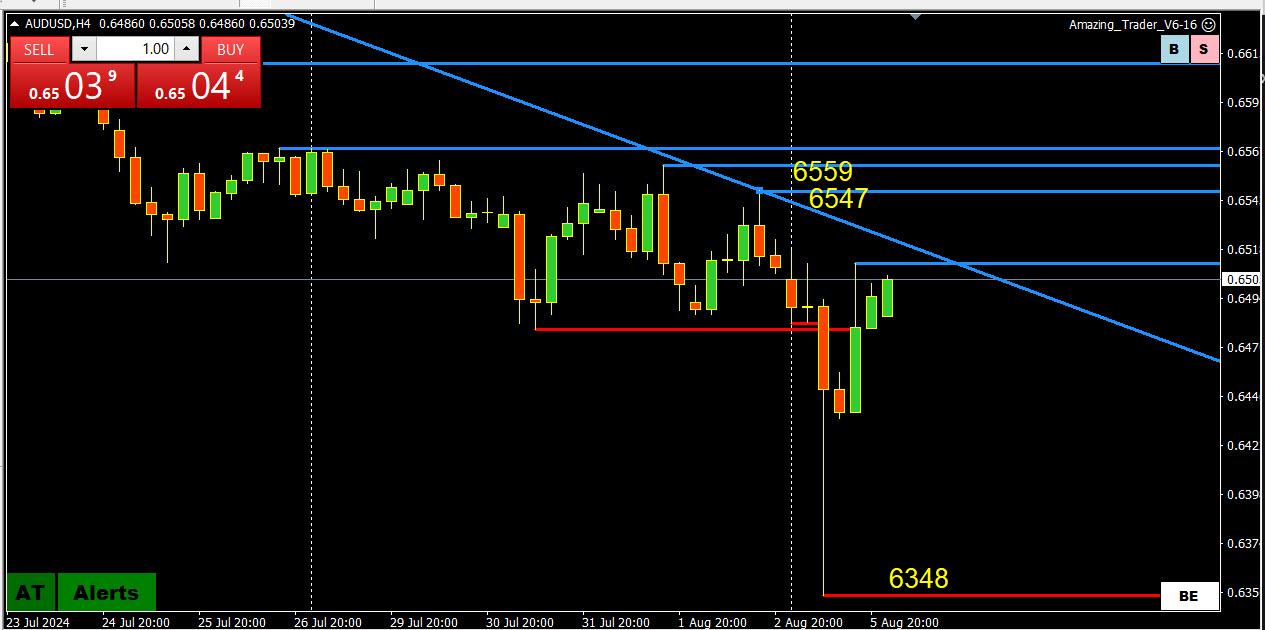
The spike down to .6348 has wiped the deck of stops on the downside.
On the upside, a move above .6547-59 (use .6545-60) would be needed to confirm the low is in and shift the risk to the upside..
Next up is the RBA decision where ,6500 will dictate whether this rebound has legs.
August 5, 2024 at 9:41 pm #10131August 5, 2024 at 9:28 pm #10130August 5, 2024 at 9:22 pm #10129August 5, 2024 at 7:17 pm #10128August 5, 2024 at 7:00 pm #10127August 5, 2024 at 6:36 pm #101268-5
The Taiwan Stock Index saw its lowest level since 1976 in the Asian session.
In conditions of cross-markets capitulation one might generally expect the US Dollar to benefit from safe haven flows. On a session to session basis, that has not happened during this three day selloff. That and other conditions support the argument that this is not a market wide capitulation but rather an extreme readjustment to match intense geopolitical, fundamental and economic deterioration. I find it appropriate to price in allocations accordingly and that is what the market is doing, albeit a bit later than expected and in more dramatic fashion.
Things to watch are the Chinese stock market, if we see the addition of $1 Trillion is US debt added every 100 days as has been the case for 3 years running, and deteriorating employment conditions.
I have trouble understanding how people did not see this developing 2 years ago, let alone 2 weeks ago.
I still like Australian Dollar overall when it sells off, and Australian stocks.
US Bonds let us know weeks ago we would see selling. Were you paying attention?
August 5, 2024 at 6:03 pm #10125August 5, 2024 at 5:34 pm #10124“key data this week”
—
Well … “Putin’s Top Defense Officials Are In Tehran Amid Countdown To Zero Hour
And US CENTCOM chief is in Tel Aviv” … – zh
So here is the known known : they are talking
And the known unknown: we don’t know how belligerent their talk is.So as long as they are only talking there is little opp for profit from geopolitical risk
I have alerts on gold and crude.
August 5, 2024 at 5:04 pm #10123You could see this coming a quarter ago with the variance in commodities vs stocks and the politicization of the FED resulting in questionable management/mis-management of rates.
The prior Asian session saw the worst drawdown in Asian stocks since the Fukushima nuclear facility meltdown in 2011. Asian stocks have seen the worst 3 day route on record.
Earlier in the year, corn dropped to the lowest price levels since 1974. Commodities have been showing disconnect with some imaginary gold medal economic performance touted by politicians. The reality is something very different.
There has also been Natural Gas only recently saw record high levels of gas for power generation in the US, which was politically hamstrung the prior 3 years to nearly zero output growth in various respects. Natural Gas production dropped to the lowest levels since 1990. Demand only moderately declined and will increase as will price. The lack of production became a genuine national security weakness of substantial weight until now. As were oil leasing permits. There is a considerable difference between leases and actual permits.
Gold rose in contrast to other commodities due to geopolitical structural malaise. Basically, the people in charge are a mess and so are their cheerleaders.
US Rates should have seen a .25 reduction 2 meetings ago.
I see the S/P 500 possibly declining 200-300 hundred points further before stabilizing. The only real rotation in stocks has been to MSCI emerging and Russel type low cap stocks in the search for growth.
That equates to more risk off environment overall for a bit further.
1. There will be no emergency rate cut.
2. There will be no .50 rate cut.
3. There will be a .25 rate cut in September.
4. There will be no rate hike.
Performance Grade on current political and finance officials: D.
August 5, 2024 at 5:03 pm #10122August 5, 2024 at 4:12 pm #10121 -
AuthorPosts
- You must be logged in to reply to this topic.
Search
© 2024 Global View