
- This topic has 28,070 replies, 54 voices, and was last updated 8 minutes ago by GVI Forex 2.
-
AuthorPosts
-
August 20, 2024 at 8:50 pm #10746August 20, 2024 at 7:22 pm #10743
TRADER ALERT
A downward revision of 1 million jobs would reduce employment creation to 1.6 million jobs for the year, from 2.6 million, said Marc Chandler, chief market strategist at Bannockburn Global Forex in New York.
“That’s why I think that the market is still pricing in about a 25% chance of a 50-basis-point cut in September,” Chandler said. “People thought the Fed was behind the curve in raising rates, and now many people think the Fed is behind the curve in cutting rates.”
August 20, 2024 at 5:57 pm #10742August 20, 2024 at 4:38 pm #10741Greta … where tfk ARE you ?!
August 20, 2024 at 4:30 pm #10740August 20, 2024 at 4:28 pm #10739August 20, 2024 at 4:23 pm #10738August 20, 2024 at 4:22 pm #10737August 20, 2024 at 4:15 pm #10736August 20, 2024 at 3:17 pm #10733August 20, 2024 at 2:49 pm #10732Yesterday I posted (factually per Reuters) that hundreds of millions of individual social security and sensitive data had been hacked and sold on the black market in the dark web in recent weeks. Almost a billion actually. The place to go to see if your data has indeed been hacked and sold is https://npd.pentester.com/.
August 20, 2024 at 2:38 pm #10731August 20, 2024 at 2:37 pm #10730August 20, 2024 at 2:32 pm #10729Reuters poll: S&P 500 to end 2024 at 5600 (May poll 5302, currently 5600); sees 5900 be end-2025
Source: Newsquawk.com
August 20, 2024 at 2:10 pm #10727I could say something egomaniacal like “Euro is now officially a sell” but that would be an absurdly arrogant means of verbiage. I wonder how many of them said something almost verbatim this morning in other forums. When a CTA, I learned to be more realistic and responsible than that with one’s language.
August 20, 2024 at 2:02 pm #10726There is zero reason to be long UsdJpy today unless some unusual dominant fundamental or market activity condition suddenly arises. Eu metrics are dominant on the buy side in some metrics but there is clear positioning in other metrics on outside months which shows sell side interest building so current levels are producing a pivot level as I type. When this happens usually a sustained shift takes place lasting for one week minimum.
August 20, 2024 at 1:53 pm #10725Bloomberg – Goldman Sachs Group Inc. and Wells Fargo & Co. economists expect the government’s preliminary benchmark revisions on Wednesday to show payrolls growth in the year through March was at least 600,000 weaker than currently estimated — about 50,000 a month.
Has the FED has become a veiled political arm and not a FED? Many are more than satisfied that is the case. Regardless, the hidden figures alters the interest rate outlook and the presents the likelihood they are behind the curve in reducing rates which ultimately will cause highly chaotic economic results for quite some time.
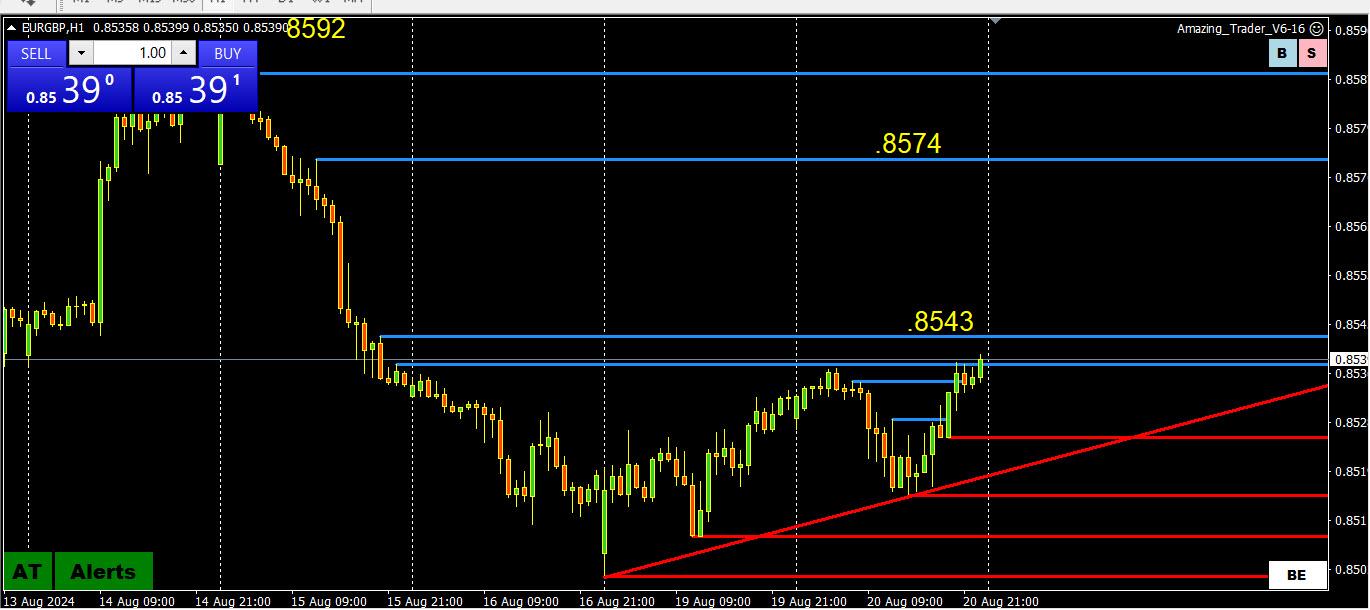
August 20, 2024 at 1:18 pm #10724I do not know why my charts sometimes change the high/low. Now it is showing 1.1134 on a weekly (was showing 1.1137) but I will always go for the “50” level as a key one to watch..
Brief spike just now through 1.11 sets this as the pivotal level to watch (options level?) as that can often lead to being a top.
Has to hold 1.1092 or risk shifts to 1.1082.
August 20, 2024 at 1:18 pm #10723August 20, 2024 at 1:17 pm #10722USD’s slide into the toilet is likely a reflection of player high expectations of upcoming Jerome yikyak on Friday about accommodating (assuaging?) them with a signal of sept Fed easing. The one element that may be in for some correcting is whether what-ever easing maybe gifted upon the market is a start of a process.
The degree of perception of any Powell dovishness will likely determine how much more the DLR will weaken or not.
Market is a bit too giddy about Fed’s easing expectations.August 20, 2024 at 1:03 pm #10721August 20, 2024 at 12:56 pm #10720August 20, 2024 at 12:42 pm #10719August 20, 2024 at 12:26 pm #10718August 20, 2024 at 12:00 pm #10716August 20, 2024 at 11:11 am #10713A look at the day ahead in U.S. and global markets by Alun John, EMEA breaking news correspondent, finance and markets.
It’s been quite a recovery for the S&P 500 stock index since early August’s turmoil. The benchmark has risen for the past eight trading sessions, its longest streak of 2024, and is now just 1% off its mid-July record high.
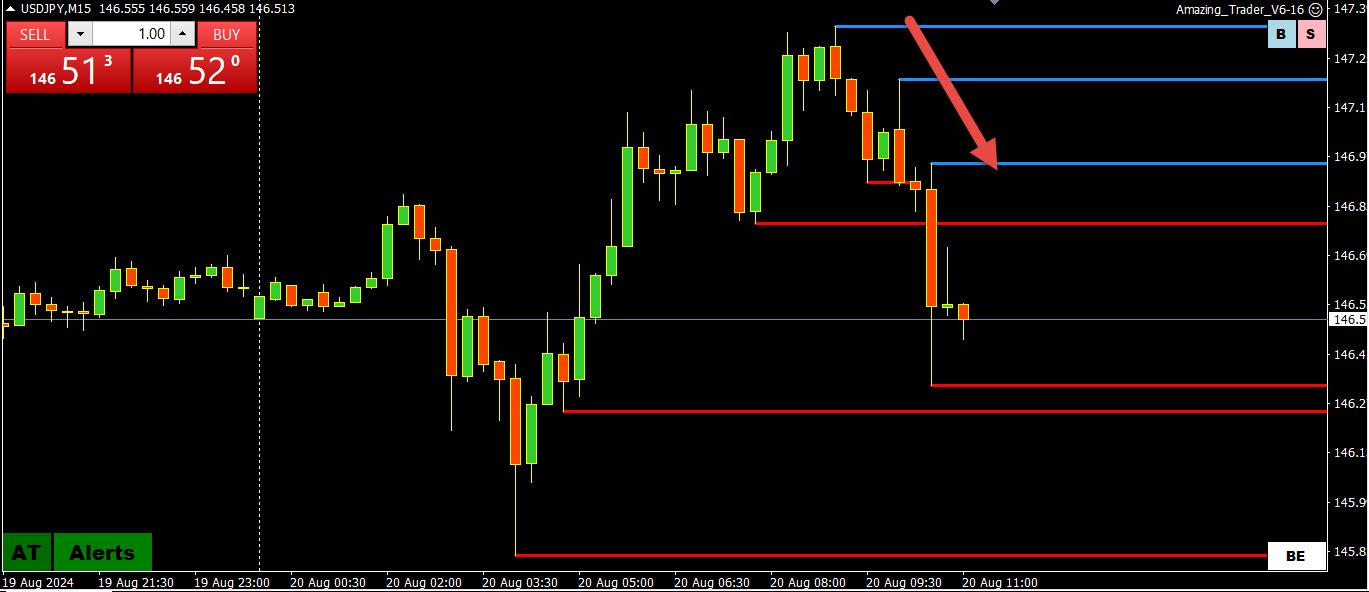
August 20, 2024 at 8:05 am #10712USDJPY 15 MINUTE CHART
Source: The Amazing Trader
This is what I meant when I said use short-term charts to trade USDJPY (note Amazing Trader logic pointed down).
August 20, 2024 at 8:00 am #10711“[Israel=Hamas ceasefire] negotiations scheduled in Cairo are expected to be postponed until the end of the week due to a lack of progress in contacts.”, according to Sky News Arabia citing Israel official and dip;omats via Israeli Broadcasting Corp
Source: Newsquawk.com
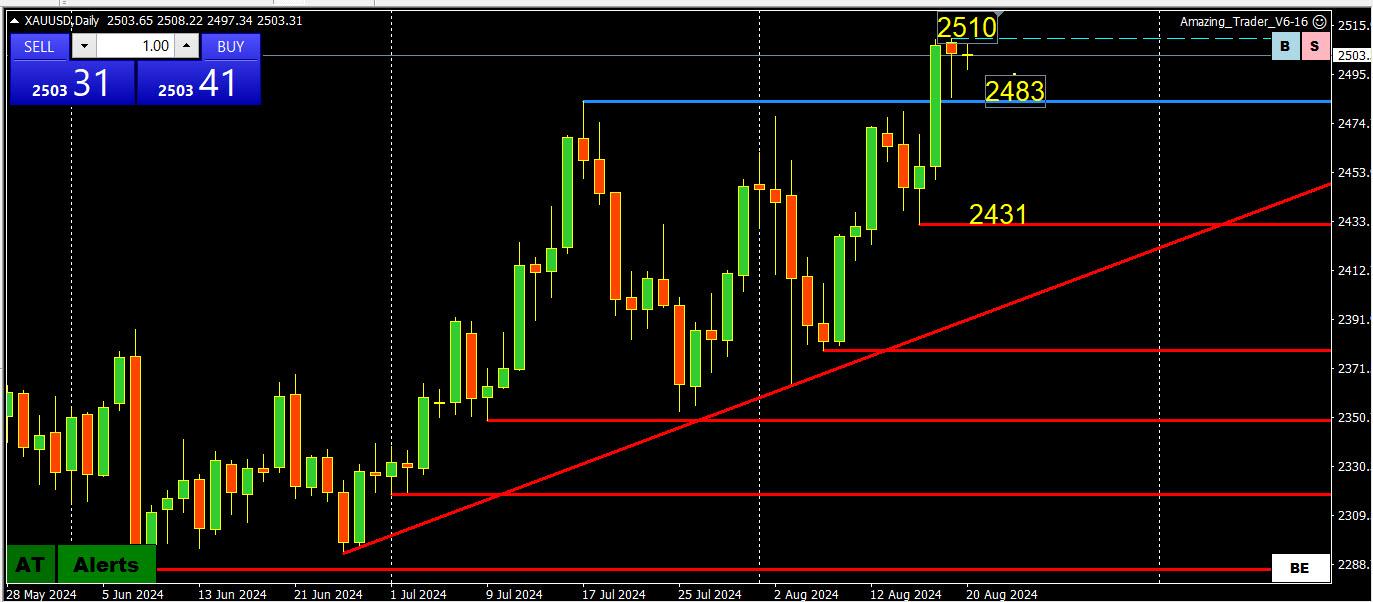
XAUUSD extends record high above 2510. No sign of concern in other markets.
August 20, 2024 at 7:11 am #10707August 20, 2024 at 6:49 am #10704 -
AuthorPosts
- You must be logged in to reply to this topic.
Search
© 2024 Global View