
- This topic has 28,407 replies, 54 voices, and was last updated 17 minutes ago by GVI Forex 2.
-
AuthorPosts
-
September 24, 2024 at 5:04 pm #12025September 24, 2024 at 4:59 pm #12024September 24, 2024 at 4:12 pm #12021
I use a very cycle driven algorithm model. In that model for UsdJpy the key areas are 143.10 and 144.10 (ironically) at present. 143.60 is the price magnet (at present) and is right in the middle.
I sold 143.80, I bought 143.55 and then sold 143.69. Already out of the sell but if I see 143.40 break I will likely jump on it for 143.
September 24, 2024 at 4:01 pm #12019September 24, 2024 at 3:55 pm #12018September 24, 2024 at 3:52 pm #12017September 24, 2024 at 3:38 pm #12016September 24, 2024 at 3:14 pm #12015September 24, 2024 at 3:07 pm #12014September 24, 2024 at 2:59 pm #12013September 24, 2024 at 2:58 pm #12012September 24, 2024 at 2:44 pm #12011DX 100.50 is a long standing value magnet in my model in recent times and the post data price activity bounced right off of it. Forwards and other components are decidedly negative UsdJpy and so if that area is compromised and holds it is curtains for that pair. If not it will likely see 100.90 in coming days.
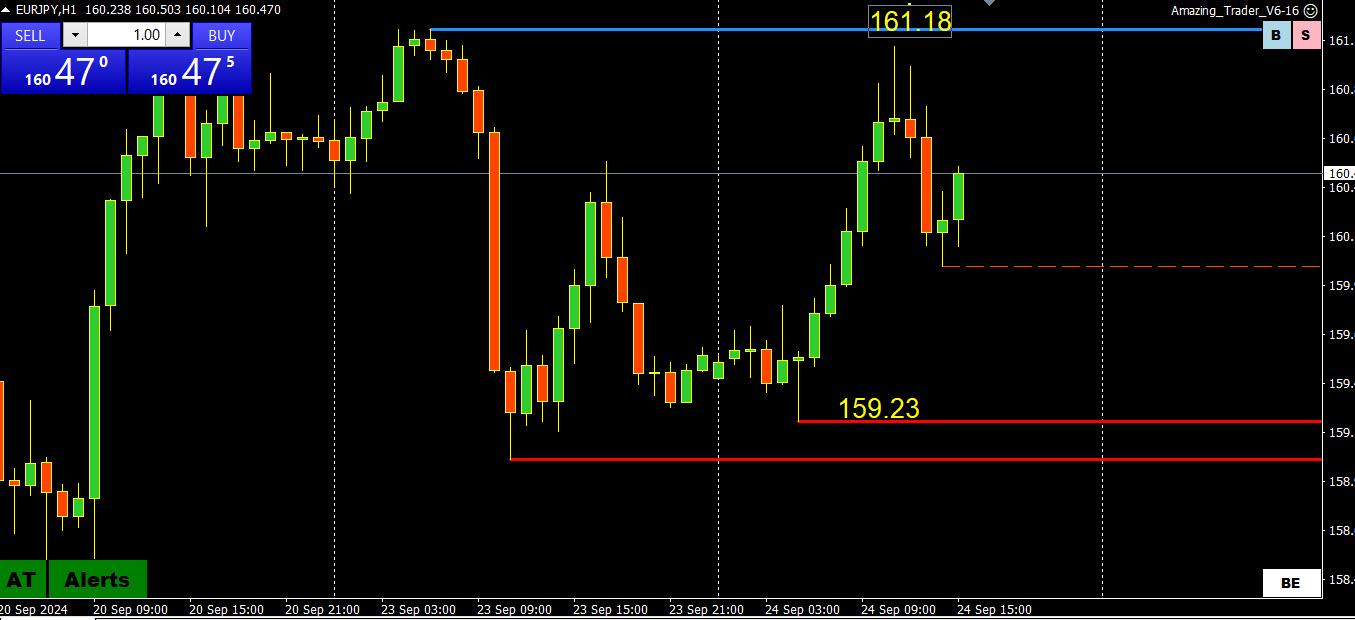
September 24, 2024 at 2:33 pm #12010September 24, 2024 at 2:05 pm #12009September 24, 2024 at 1:48 pm #12008September 24, 2024 at 1:07 pm #12007September 24, 2024 at 12:43 pm #12006September 24, 2024 at 12:30 pm #12005September 24, 2024 at 12:21 pm #12004EurJpy 161.40 has been an ongoing value magnet in my view and one where I have keyed positions on when price activity returns there after being active at other levels. Price failed to breach it 3 times now since Friday after pulling up from lows. As a standalone, the pattern of participation is forming what usually amounts to a breakout uphill from there toward 163. But that is only a pattern, albeit an ongoing and repetitive pattern across currencies. If not it looks like it might head for 158.
September 24, 2024 at 11:07 am #12003September 24, 2024 at 10:26 am #12002September 24, 2024 at 10:24 am #12001A look at the day ahead in U.S. and global markets from Mike Dolan
Wall Street looks set to grind out another record on Tuesday as world markets were enlivened by long-awaited monetary easing in China – rate cuts aimed at underpinning a wobbling economy that’s sowing weakness across the world, not least in Europe.
Chinese stock indexes surged more than 4% on Tuesday and the offshore yuan hit its strongest level against the dollar in 16 months after a series of moves by the People’s Bank of China to loosen lending conditions.
Morning Bid: New highs beckon as China eases, Europe sneezes
September 24, 2024 at 10:11 am #12000September 24, 2024 at 10:07 am #11999September 24, 2024 at 9:52 am #11998GBPISD MONTHLY CHART – New high

GBPUSD extended its high to 1.3383, highest level since early 2022.
With the next key level not until above 1.37, use the most recent high as the closest key resistance.
To dent the upward momentum, Monday’s low at 1.3248 would need to be broken.
Note, keep an eye on EURGBP (downtrend), and the tug-of-war between a lagging EURUSD and a firmer GBPUSD
September 24, 2024 at 9:35 am #11997EURUSD 4 HOUR CHART

Is the glass half full or half empty?
1) Failed to test its 1.1201 key high
2) This followed a failure to test 1.10
3) If range is 1.10-1.12 until broken, then 1.11 remains its bias setting level
4) On the other side, while with 1.11-1.12, 1.1150 is clearly pivotal as well for day trading
5) Using 1.1002-1.1189, using our Fibonacci Calculator, Monday’s low (1.1083) paused above the 61.8% level
 September 24, 2024 at 9:19 am #11996
USDJPY 4 HOUR CHART – WATCH THE MOVING AVERAGE BAND

Trading within the moving average band bounded by the 200 4 hour (yellow) on top and 4 hour 100 4 hour (blue) on the bottom, both still sloping down.
On the other side, technicals are tilting positive (rising red AT lines) but only a solid move above 144.50 ( high today 144,68) would suggest more scope to this retracement.
September 24, 2024 at 7:15 am #11995A look at the day ahead in European and global markets from Ankur Banerjee
Investors have long clamoured for China to unleash broad-based stimulus measures to help turn sentiment around, and while Tuesday’s measures are well short of a ‘big bazooka’ move, it may still be a step in the right direction.
Morning Bid: No bazooka, but China’s latest stimulus is a relief
September 24, 2024 at 6:40 am #11994September 23, 2024 at 10:44 pm #11993 -
AuthorPosts


- You must be logged in to reply to this topic.
Search
© 2024 Global View