
- This topic has 28,407 replies, 54 voices, and was last updated 24 minutes ago by GVI Forex 2.
-
AuthorPosts
-
September 25, 2024 at 2:10 pm #12059September 25, 2024 at 1:32 pm #12056September 25, 2024 at 1:31 pm #12055September 25, 2024 at 1:19 pm #12054September 25, 2024 at 1:11 pm #12053September 25, 2024 at 1:06 pm #12052
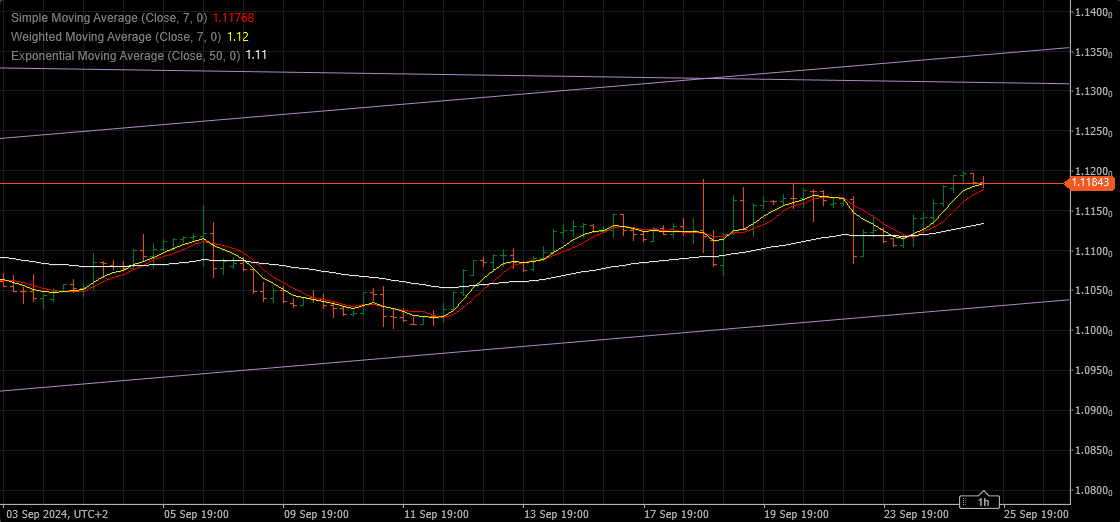
EURUSD 5 MINUTE CHART – WHY I LOVE THE AMAZING TRADER
Look at the bounce off AT support at 1.11918… this is no coincidence…why it is called “Amazing”… same support on a 15 minute chart
 September 25, 2024 at 12:49 pm #12051September 25, 2024 at 12:46 pm #12050September 25, 2024 at 12:41 pm #12049September 25, 2024 at 12:36 pm #12048
Case in point on market internals – Yields opened up strongly moments ago but immediately began pulling back which carried over to UsdJpy seeing a sudden, albeit small shot downhill. I would pay attention to those internals today, which are mixed with a slight tint to the downside in the pair. Again, however, the geopolitical element today should have stocks apprehensive and buoy USD unless it becomes dramatic and we see safe haven flows into CHF and such.
September 25, 2024 at 12:12 pm #12046UsdJpy remains dominant on the buy side until 143.95 is compromised definitively. Why not just 143? This time, only this time, my cycle oriented system simply has that number this time. It is not stagnant. Entering the US day stock markets are apprehensive with the geopolitical turmoil and rightfully so. What could change that? Either some significant development or global markets simply revisiting the rate reduction effect in my view. Right now some components behind the scenes are negative Dollar so entirely possible. Yesterday they were decidedly positive but there was a delay in those orders filling through the market, which caused UsdJpy to run uphill overnight.
September 25, 2024 at 12:01 pm #12045September 25, 2024 at 11:30 am #12044September 25, 2024 at 11:09 am #12043September 25, 2024 at 11:02 am #12042A look at the day ahead in U.S. and global markets from Mike Dolan
The unexpected downturn in U.S. household confidence this month and growing anxiety about jobs has spurred aggressive interest rate cut bets anew – dragging Treasury yields, the dollar and stock futures lower into Wednesday’s open.
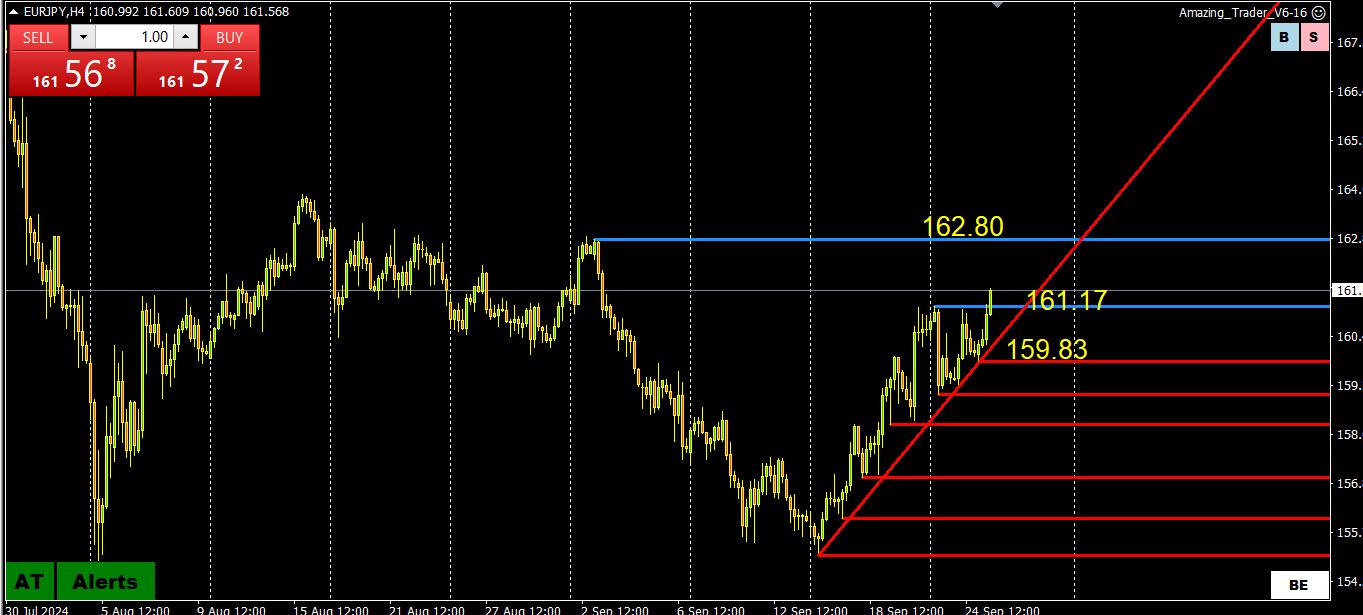
Morning Bid: US confidence wobble weighs, China buoyedSeptember 25, 2024 at 10:21 am #12041USDJPY WEEKLY CHART
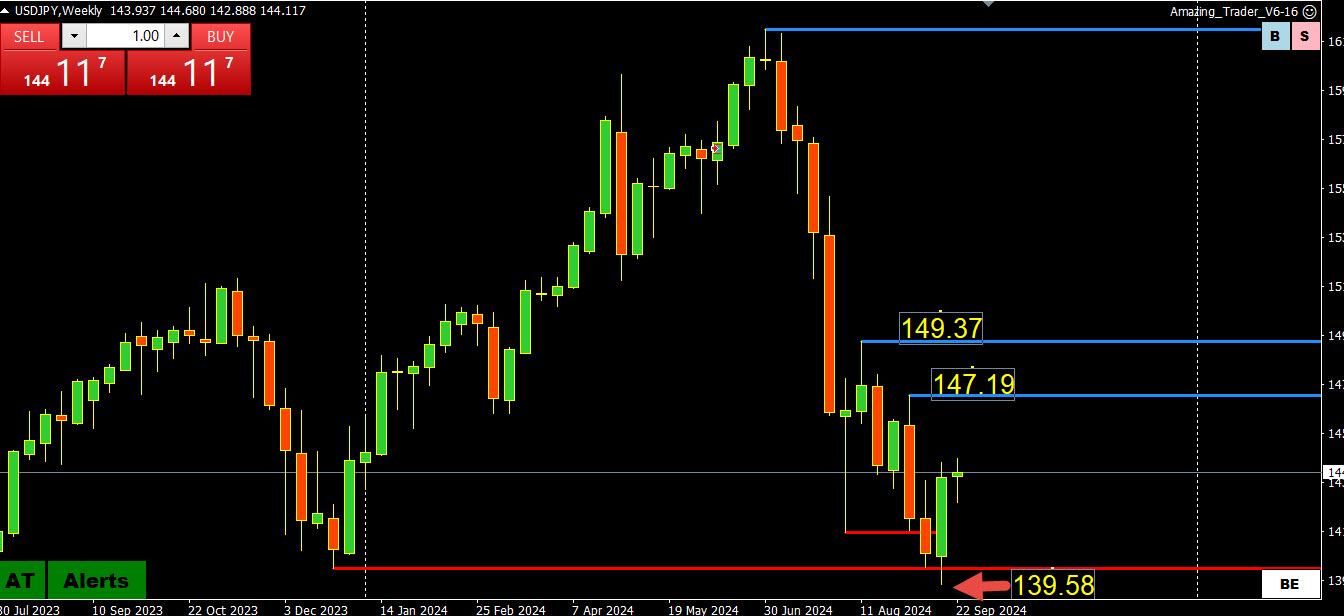
Let’s take a look at what technical traders are looking at.
Last week was an outside week and close to an outside week key reversal although I was told many years ago that it doesn’t work well with currencies.
I just took a look at a broker’s sentiment and it shows 50% of trader positions are short USDJPY.
So, looking at the COT report as well, short USDJPY positions no longer look extended so it might take a move outside of 140-145 to expose key levels.
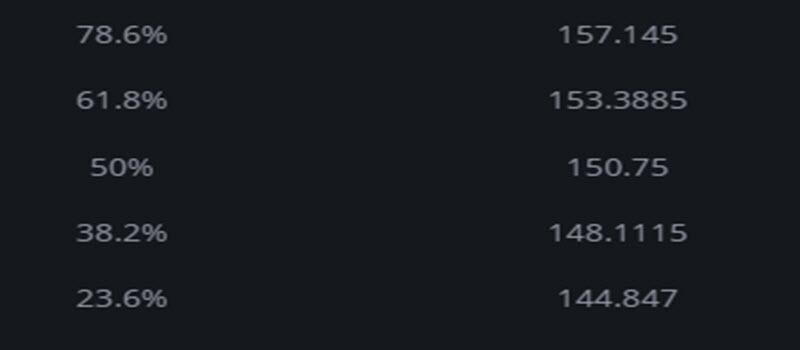
In any case, this can still be considered a retracement phase with FIBOS for 161.93-139.58 shown below
 September 25, 2024 at 9:47 am #12039
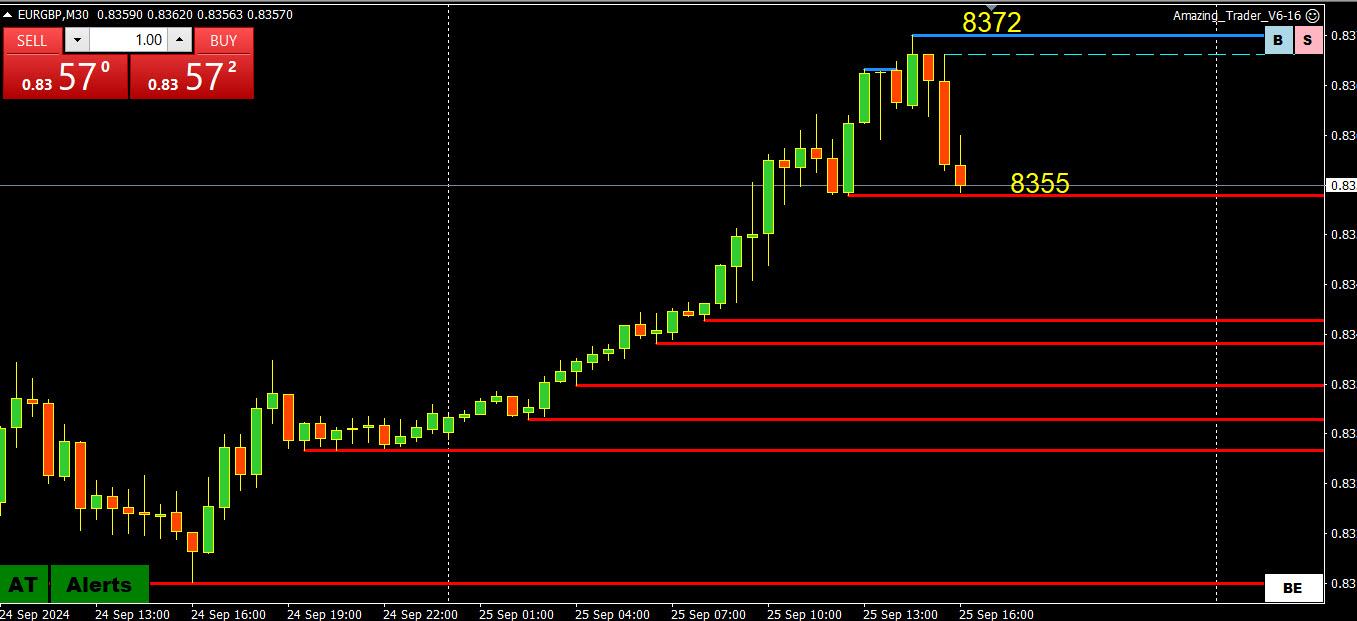
EURGBP 4 HOUR CHART – BOUNCE FROM MULTI-YEAR LOW
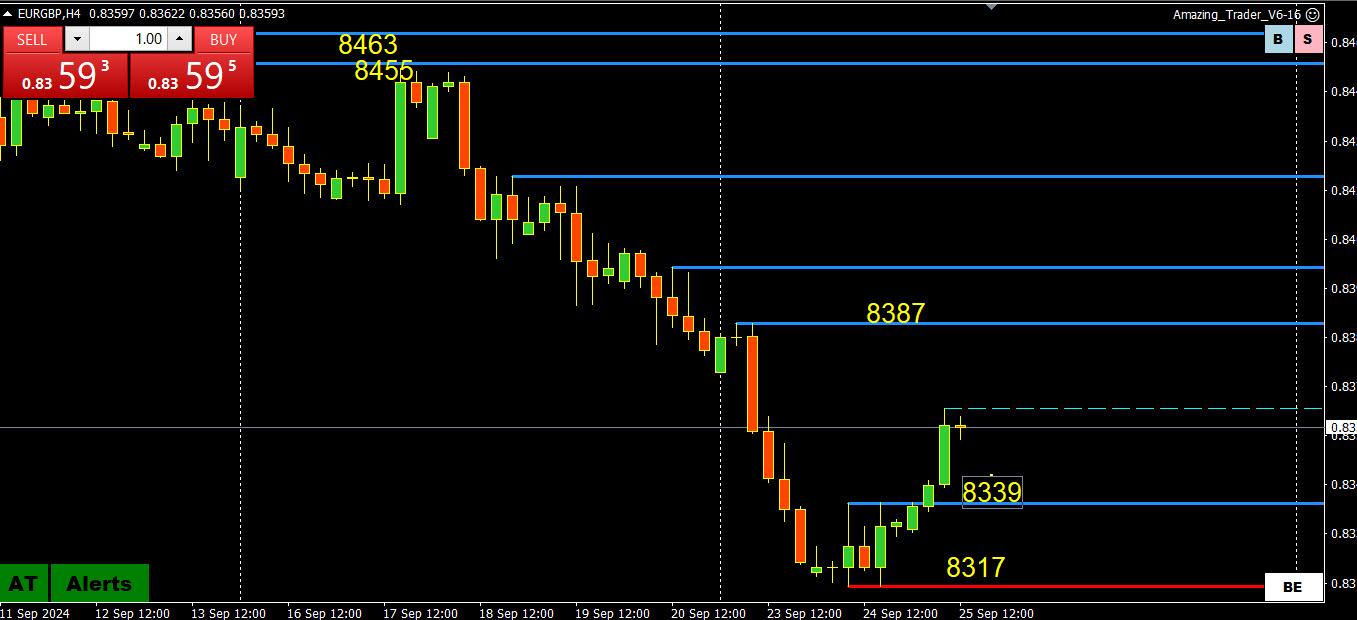
If trading EURUSD and GBPUSD, it pays to keep an eye on EURGBP, which is firmer today… weighing on GBPUSD while EURUSD follows with a lag
This follows a bounce from ,8317, lowest level since early 2022.
Supports: .8339, .8317
Resistance: .8389 (this week’s high)
September 25, 2024 at 9:37 am #12038September 25, 2024 at 9:14 am #12037September 25, 2024 at 8:48 am #12036I have been scanning the news looking for reasons for the bounce in USDJPY back to 144
I have so far come up empty but this caught my eye
The COT (futures) report showed a huge drop in long positions, which explains some of the recent USDJPY support
Open interest fell -47%, fastest weekly pace on record
177k contracts closed
Open interest at 376.5k contracts in the prior week was its second highest level on record
The Commitment of Traders (COT) report is a weekly market report that summarizes the holdings of participants in the US futures market. The Commodity Futures Trading Commission (CFTC) publishes the report every Friday at 3:30 PM Eastern Time, and it covers the previous Tuesday’s trading day.
(AI Overview)
September 25, 2024 at 8:48 am #12035I have been scanning the news looking for reasons for the bounce in USDJPY back to 144
I have so far come up empty but this caught my eye
The COT (futures) report showed a huge drop in long positions, which explains some of USSDJPY support
Open interest fell -47%, fastest weekly pace on record
The -177k contracts closed
Open interest at 376.5k contracts in the prior week prior was its second highest level on record
September 24, 2024 at 11:47 pm #12034The forex market is largely controlled by interest rates. In fact, the interest rate is generally the single most important factor when it comes to determining the value of that specific currency. Investors will constantly look at how the interest rate on one currency compares to another, and they will use this information to take action in the markets.
Interest Rates and Why they Matter to Forex Traders
 September 24, 2024 at 9:13 pm #12033September 24, 2024 at 8:11 pm #12032September 24, 2024 at 7:17 pm #12031September 24, 2024 at 7:04 pm #12030
When I mention price/value magnets these are either reoccurring values or range related values of importance to large firms. You won’t find that with an Macd it comes from experience in banking (Jay of GVI) or as a CTA. With Yen much of that is import/export related entities, especially in the Asian session. UsdJpy 143.20 and 142.90 are medium term cycle magnets. If the latter is definitively compromised then look out below. If it holds we see likely see 146 in time.
September 24, 2024 at 6:53 pm #12029September 24, 2024 at 6:26 pm #12028September 24, 2024 at 6:20 pm #12027XAUUSD 4 HOUR CHART – Another day, another record high
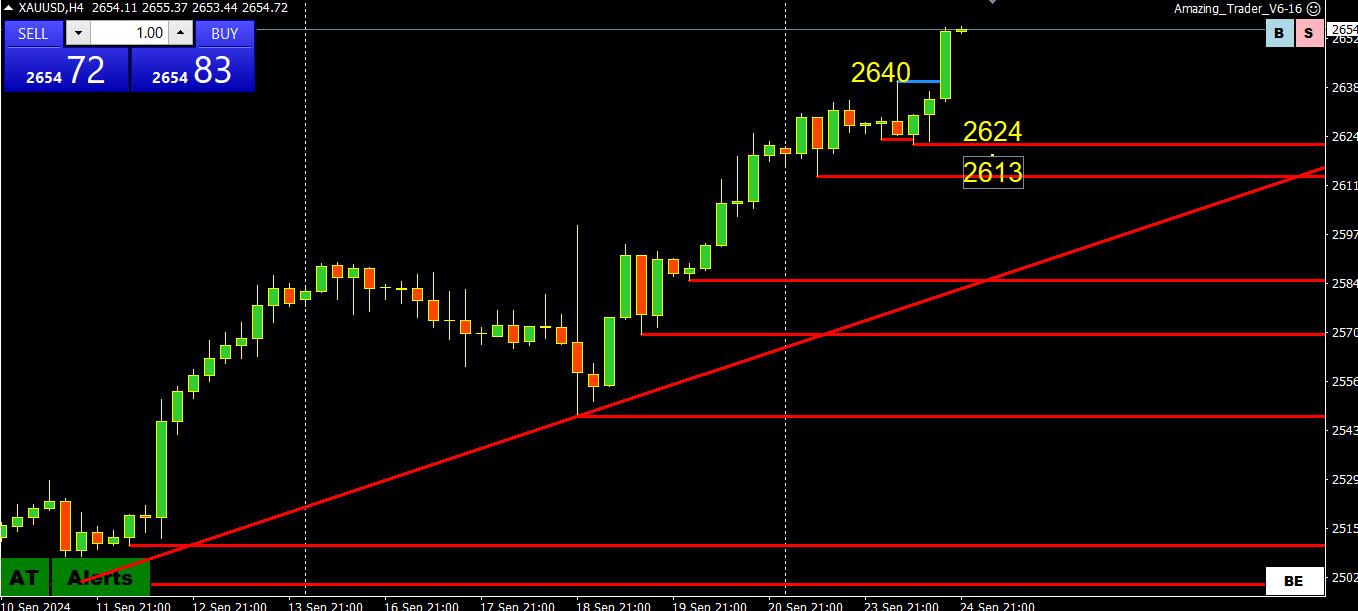
With another record high day, there is no change to:
When in unchartered record territory, resistance is only a guess so use the latest high as the only level that matters,
Otherwise, look for a strong bid if it stays above 2640, scaled down buy interest as long as it trades above 2600.
To suggest a pause, it would need a day without a new high.
September 24, 2024 at 6:15 pm #12026US500 4 HOUR CHART – RESISTANCE?
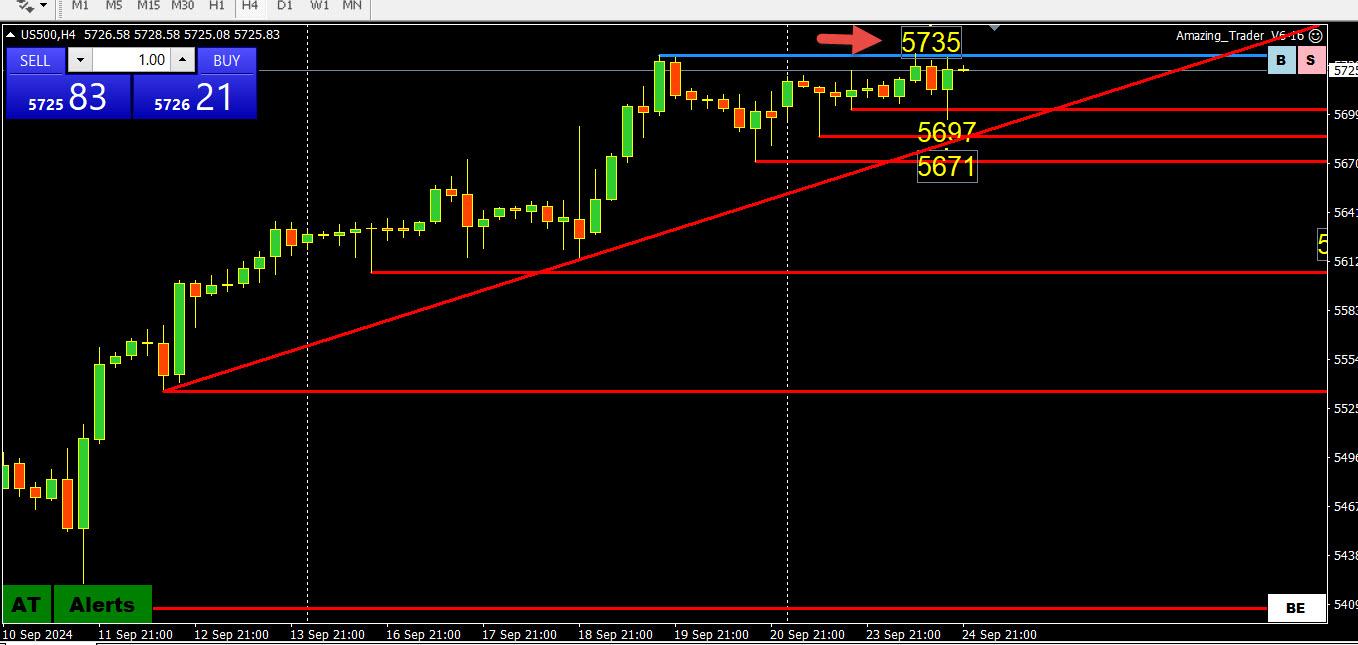
Note that CFD price feeds can differ between broker, even those using the same symbol. Ss, look at the chart pattern if the levels below do not line up with the prices on your chart.
US500 ran into resistance at yesterday’s record high (5735 on this chart).
As I have said, there is no reason to guess at a top when in record high territory but it pays to keep an eye on the high to see if it holds.
Supports 5697, 5671
Resistance, 5735, ?
-
AuthorPosts
- You must be logged in to reply to this topic.
Search
© 2024 Global View