
- This topic has 28,266 replies, 54 voices, and was last updated 16 minutes ago by GVI Forex 2.
-
AuthorPosts
-
October 22, 2024 at 8:32 am #13186
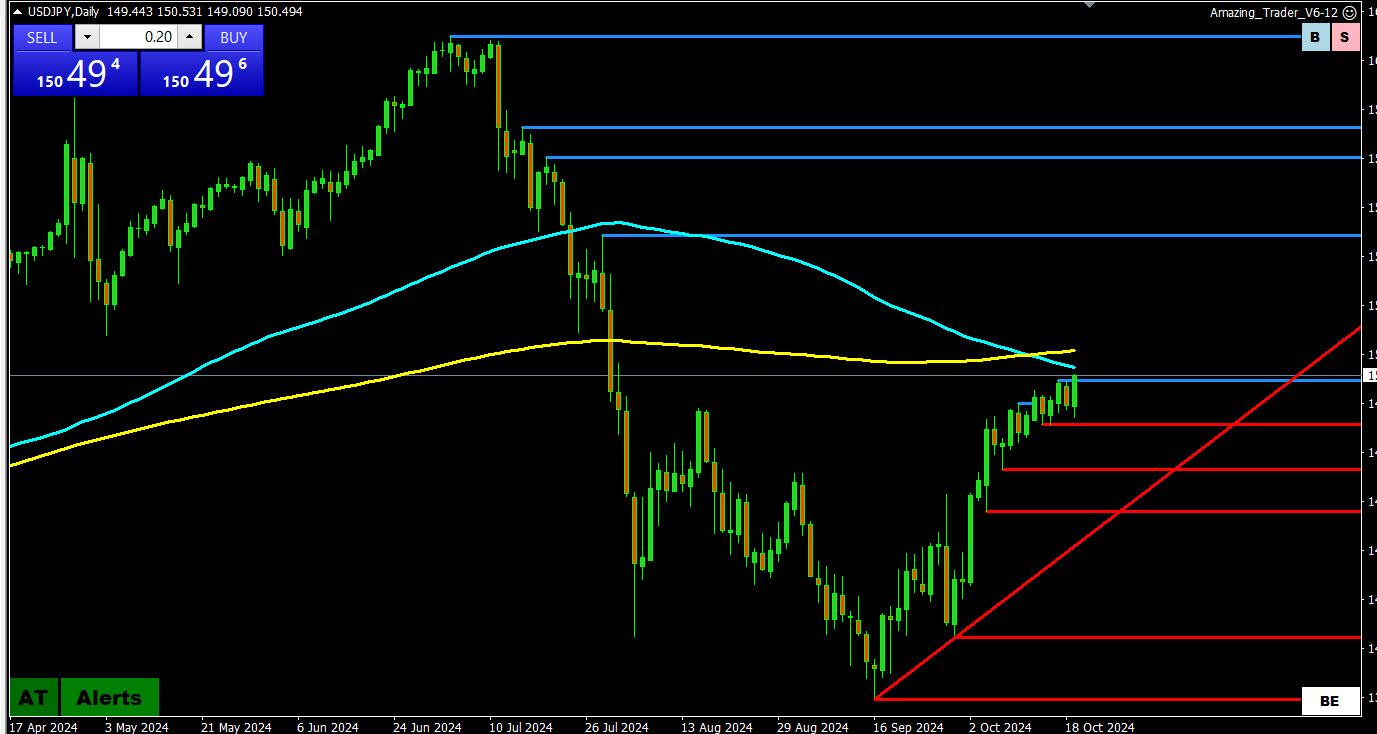
USDJPYDAILY CHART – TESTING MOVING AVERAGE BAND

With next key resistance not until 155.20, key moving averages become the focus.
150.78 = 100 day mva (blue)
151.35 = 200 day mva (yellow)
What caught my eye is the overnight low at 150.50, a Power of 50 level… expect support as long as it holds.
Below 150.50 would put 150 in play again.
October 22, 2024 at 8:26 am #13185October 22, 2024 at 8:14 am #13184October 22, 2024 at 8:04 am #13182Japan’s general election outcome could muddle BOJ plans
Summary
Recent poll shows risk of ruling coalition losing majority
New coalition could include party favouring easy policy
Messy election outcome could hurt Ishiba’s hawkish streak
Political disorder risks causing delay in BOJ rate hikes
TOKYO, Oct 22 (Reuters) – The risk of Japan ending up with a minority coalition government after the upcoming general election is raising concerns that the central bank could face complications in its quest to gradually wean the nation off decades of monetary stimulus.October 22, 2024 at 8:04 am #13183Japan’s general election outcome could muddle BOJ plans
Summary
Recent poll shows risk of ruling coalition losing majority
New coalition could include party favouring easy policy
Messy election outcome could hurt Ishiba’s hawkish streak
Political disorder risks causing delay in BOJ rate hikes
TOKYO, Oct 22 (Reuters) – The risk of Japan ending up with a minority coalition government after the upcoming general election is raising concerns that the central bank could face complications in its quest to gradually wean the nation off decades of monetary stimulus.October 22, 2024 at 7:54 am #13181October 21, 2024 at 11:57 pm #13180October 21, 2024 at 9:50 pm #13179October 21, 2024 at 8:22 pm #13178October 21, 2024 at 8:14 pm #13177AUDUSD DAILY CHART – KEY LEBEL LOOMS BELOW
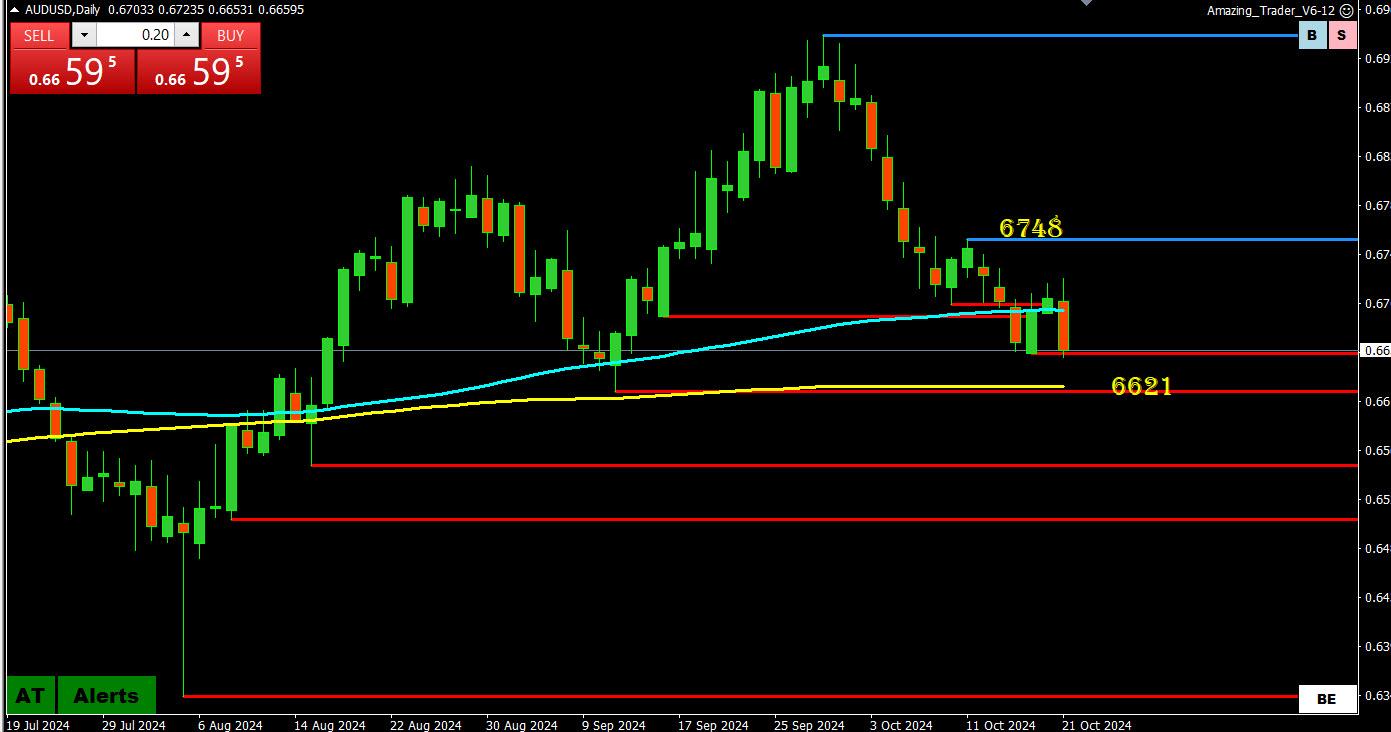
As noted in our Weekly FX Chart Outlook
Trend down but above key level
Key level is clear at .6621, which is also around the 200 day mva. As long as AUFUSD stays above it, the downside risk is limited.
On the upside, a move above 6758 would be needed to suggest a reversal of fortune.
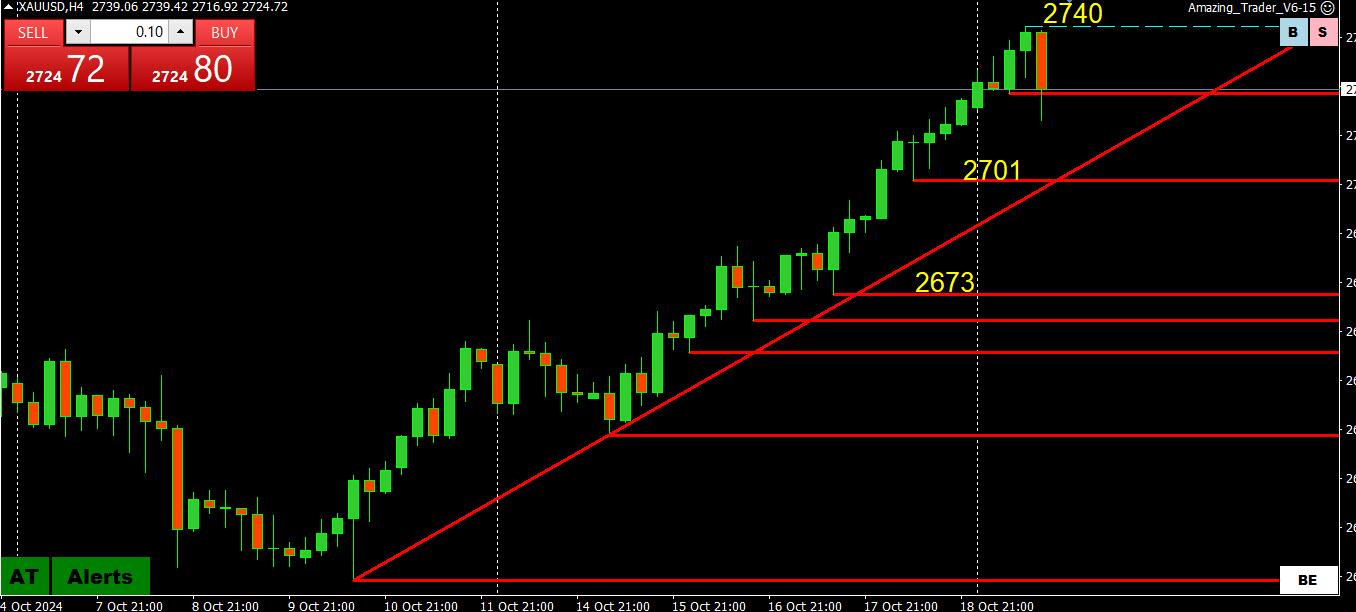
October 21, 2024 at 8:07 pm #13176October 21, 2024 at 5:33 pm #13175October 21, 2024 at 5:30 pm #13174October 21, 2024 at 5:19 pm #13173October 21, 2024 at 4:46 pm #13172October 21, 2024 at 4:39 pm #13171October 21, 2024 at 3:46 pm #13170October 21, 2024 at 3:22 pm #13167October 21, 2024 at 3:22 pm #13166October 21, 2024 at 2:58 pm #13165October 21, 2024 at 2:49 pm #13164October 21, 2024 at 2:43 pm #13163October 21, 2024 at 2:35 pm #13159October 21, 2024 at 1:30 pm #13157October 21, 2024 at 1:03 pm #13156I have been searching for reasons why GOLD has been rising to record levels so I can get a clue how to react to any news. Here are the most commonly cited reasons
Economic uncertainty (not reflected in US stocks but China struggles)
Geopolitical (Ongoing Middle East tensions and waiting for Israel to retaliate v. Iran)
Central bank demand (this may be the strongest factor?)
No mention of upcoming US election but could be a contributing factor.
October 21, 2024 at 12:16 pm #13141USDJPY 4 HOUR CHartT
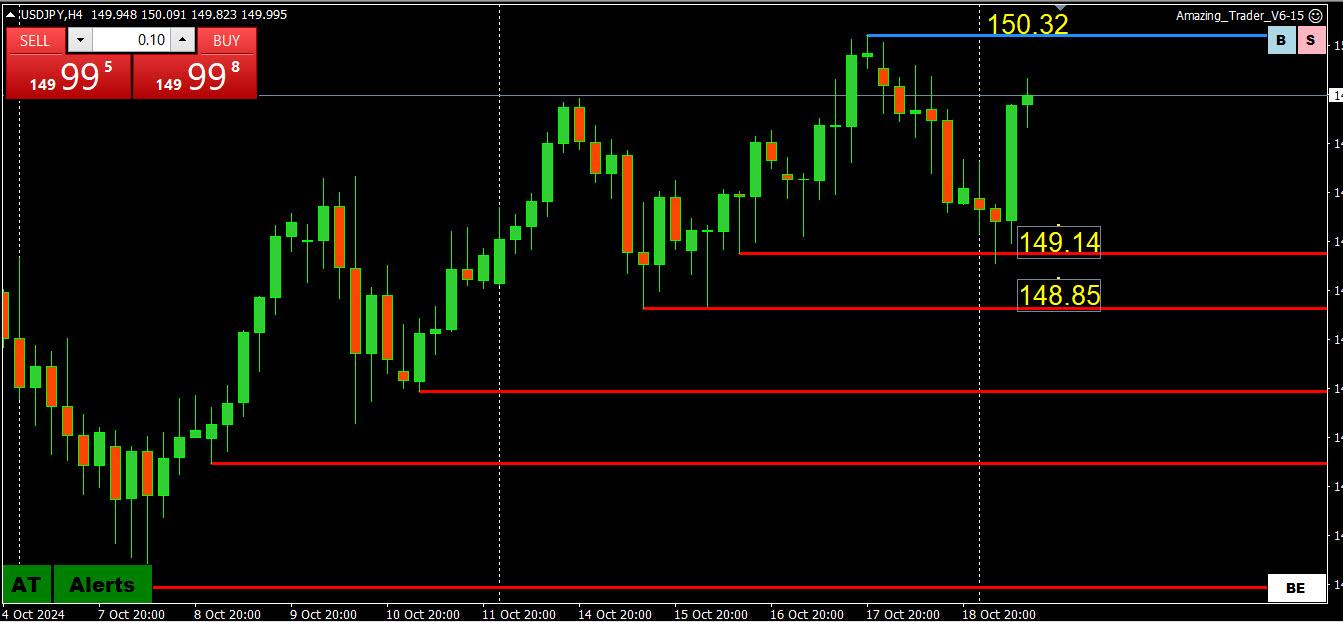
From Our Weekly FX Chart Outlook’
Short-Term Trend up but…
Market got its taste of the long forgotten 150+ level but failed to maintain it.
To put 150+ in the rear-view mirror, back below 148.82 would need to be broken.
To suggest this is more than a retracement of the broader 161.93-139.58, moves above the 100 and 200 daily mvas (blue and yellow lines) are needed.
October 21, 2024 at 10:39 am #13138What is a yield curve? Note, the US yield curve iu
s positive.Key Takeaways
Yield curves plot the interest rates of bonds of equal credit and different maturities.
Normal curves point to economic expansion.
Downward-sloping curves point to economic recession.
Yield curve rates are published on the U.S. Department of the Treasury’s website each trading day.
(Investopedia)
October 21, 2024 at 10:27 am #13137Newsquawk US Open
US futures mixed ahead of Fed speakers; dollar firmer and bonds pressured
Good morning USA traders, hope your day is off to a great start! Here are the top 4 things you need to know for today’s market.
(Click below to read the full report and listen to the guys doing the podcast)
4 Things You Need to Know
European bourses are generally trading in negative territory, but the FTSE 100 remains afloat owning to gains in Energy/Mining names; US futures are mixed.
Dollar is firmer, JPY underperforms with USD/JPY attempting to test 150 to the upside.
Bonds are entirely in the red, Bunds were initially lifted by soft German producer prices, but ultimately succumbed to selling pressure.
Crude climbs higher attempting to recoup some of the prior week’s losses, XAU & base metals continue to advance.
October 21, 2024 at 10:24 am #13136A look at the day ahead in U.S. and global markets from Mike Dolan
A relatively quiet start to the week for world markets leaves Wall Street pondering the sustainability of the recent record highs as corporate earnings updates pour in, the S&P500 index nears 6,000 and the election looms.
The peculiar sight of a risk-loving rally in U.S. equity markets and corporate high yield debt alongside new records for the traditional safe haven of gold may speak something of the hedged outlook, with geopolitical and electoral risks coloring the booming domestic economy.
October 21, 2024 at 9:56 am #13135There is a mini debate whether markets (stocks, bonds, fx) reflect a market leaning towards Trump (and the Trump Trade) or reflects the outperformance of the US economy.
With polls showing a tossup and the composition of Congress a factor in getting anything meaningful passed, I would argue for the latter but what do I know? I must say this is a rare time predicting is beyond my pay grade.
A GV member has been asking me
I have been asking you if / when politics will be trading theme —- is it starting?
-
AuthorPosts



- You must be logged in to reply to this topic.
Search
© 2024 Global View