
- This topic has 27,907 replies, 54 voices, and was last updated 13 hours, 12 minutes ago by Mtl JP.
-
AuthorPosts
-
May 22, 2025 at 12:40 pm #25245May 22, 2025 at 12:32 pm #25244
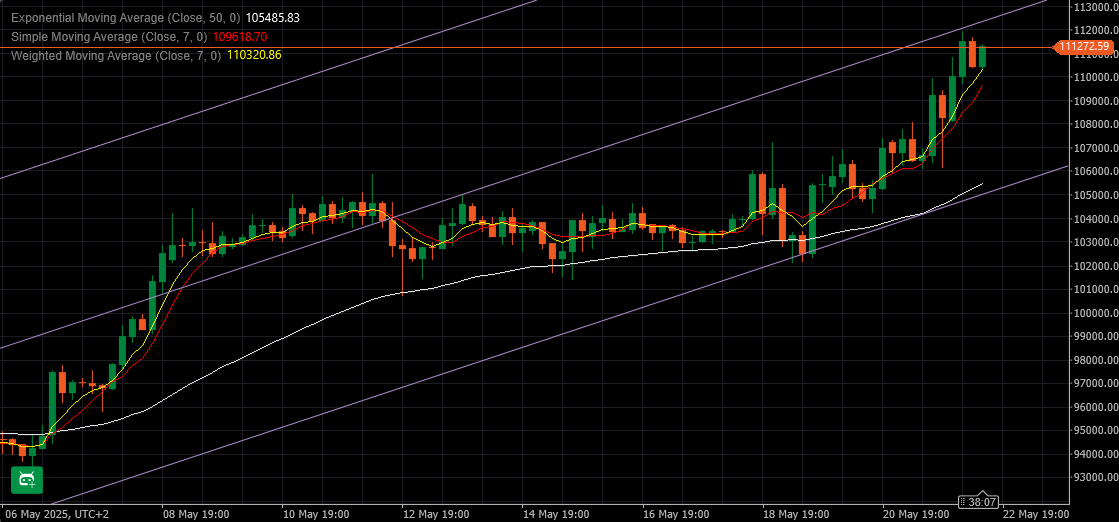
BTCUSD 4h
So Bitcoin has reached and breached 110K overnight, and went 2K pips above it so far.
112.325 is a rising resistance line that is separating BTC from upper channel – one that is leading first to resistance at 114.600 (115K) and if conquered opens space for run all the way to 120K
Supports: 110.300, 109.950 & 109.450
If BTC slows down now ( starts making just a bit higher highs), it will need some consolidation – but yet again be aware of savages – profit takers with low level of courage 😀
115K is an important level – if BTC fails on first attempt, we are within the range of 90-115K then – corrections can be brutal.
 May 22, 2025 at 12:18 pm #25243
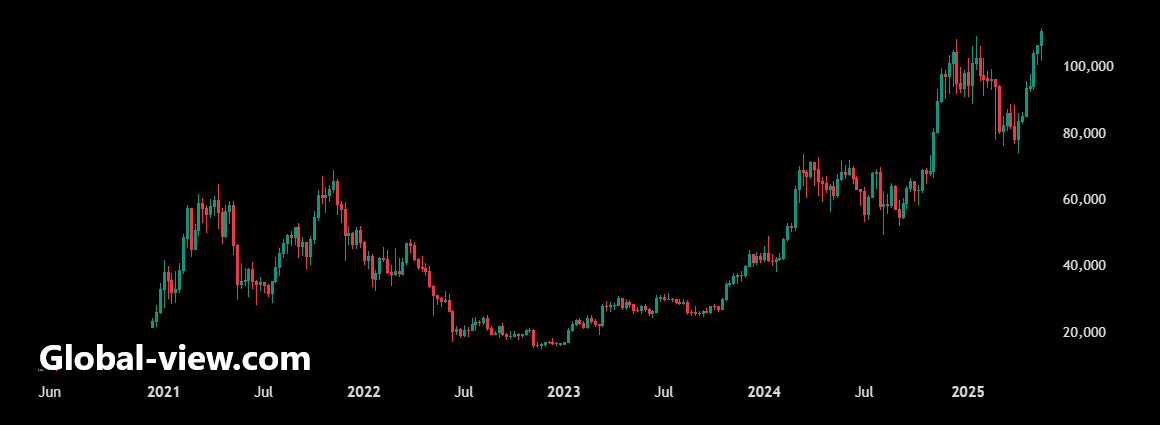
BTC/USD: Bitcoin Goes Nuclear Above $111,000 — Where’s It Going Next?
Key points:
· Bitcoin extends cosmic journey
· Prices hit new record high
· All that’s helping power the flight
Freely floating in the stratosphere, the OG coin is looking for its next place to find some rest. When’s that coming? And where?
💫 Bitcoin in Orbit
· Bitcoin BTCUSD was roaming around in the stratosphere Thursday after the token blasted above $109,500 on Wednesday, marking a fresh all-time high.
· In early trading today, Bitcoin shot above $111,000 with a session high of $111.900 per token, setting yet another record as crypto markets were still hyped about all that was happening. While the red-hot rally cooled off slightly, prices were still gyrating above $110,000.
·
The latest move higher is being fuelled by a mix of favourable macro conditions, bullish regulatory tailwinds, and growing institutional interest in digital assets. Simply put: the environment has rarely looked more Bitcoin-friendly.
What’s special about this next price bracket? It could very well be the start of an entirely new bull cycle driven by major policy developments in the US.· Looking ahead, traders are already bracing for next week’s US GDP and PCE inflation reports — key economic events that could influence the Fed’s tone and, by extension, Bitcoin’s next leg.
· A cooler-than-expected read could clear the runway for Bitcoin to test the next psychological barrier at $115,000… or even aim higher. But, as you very well know, always DYOR.
 May 22, 2025 at 12:11 pm #25242
US Dollar Rises Early Thursday Ahead of Busy Data Schedule
The US dollar rose against its major trading partners early Thursday, except for a further decline versus the yen, ahead of a busy day of economic data releases, starting with weekly jobless claims and the Chicago Federal Reserve’s national activity index for April at 8:30 am ET.
The S&P Global flash purchasing managers’ index estimates for May are due at 9:45 am ET followed by existing home sales data for April at 10:00 am ET, weekly natural gas stocks inventory at 10:30 am ET and the Kansas City manufacturing reading for May at 11:00 am ET.
New York Fed President John Williams is due to speak at 2:00 pm ET.
A quick summary of foreign exchange activity heading into Thursday:
EURUSD fell to 1.1302 from 1.1319 at the Wednesday US close and 1.1342 at the same time Wednesday morning. Eurozone manufacturing and services PMI both declined in May and now indicate contraction for both sectors, data released overnight showed. European Central Bank policy board member Frank Elderson is due to speak at 11:00 am ET, followed by ECB Vice President Luis de Guindos at 11:35 am ET. The next European Central Bank meeting is scheduled for June 4-5.
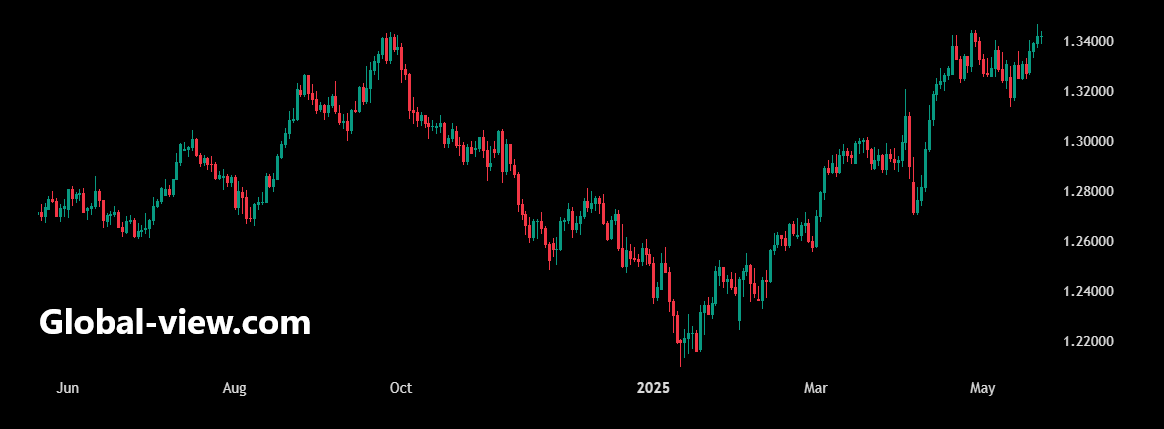
GBPUSD fell to 1.3412 from 1.3417 at the Wednesday US close and 1.3413 at the same time Wednesday morning. UK manufacturing PMI declined in May while the services reading advanced, according to data released earlier Thursday. Bank of England policy board member Huw Pill is due to speak at 8:30 am ET. The next Bank of England meeting is scheduled for June 19.
USDJPY fell to 143.6276 from 143.6921 at the Wednesday US close and 143.6327 at the same time Wednesday morning. Bank of Japan manufacturing PMI improved in May but remained below the breakeven point while the services PMI declined but still indicated expansion, data released overnight showed. The next Bank of Japan meeting is scheduled for June 16-17.
USDCAD rose slightly to 1.3864 from 1.3863 at the Wednesday US close but was below a level of 1.3882 at the same time Wednesday morning. Canadian industrial product and raw materials prices for April are due to be released at 8:30 am ET, followed an appearance by Bank of Canada Governor Tiff Macklem at 2:30 pm ET. The next Bank of Canada meeting is scheduled for June 4.
GBPUSD Chart
 May 22, 2025 at 11:56 am #25241May 22, 2025 at 11:32 am #25240May 22, 2025 at 11:15 am #25239
In our blog – It pays to be prepared
How a Ukraine-Russia Ceasefire Could Impact the EURUSD Exchange Rate
 May 22, 2025 at 11:03 am #25238May 22, 2025 at 10:18 am #25233
EURUSD 15 MINUTE – What AT is showing
1.1291 => 1.1303 => 1,1290 =>
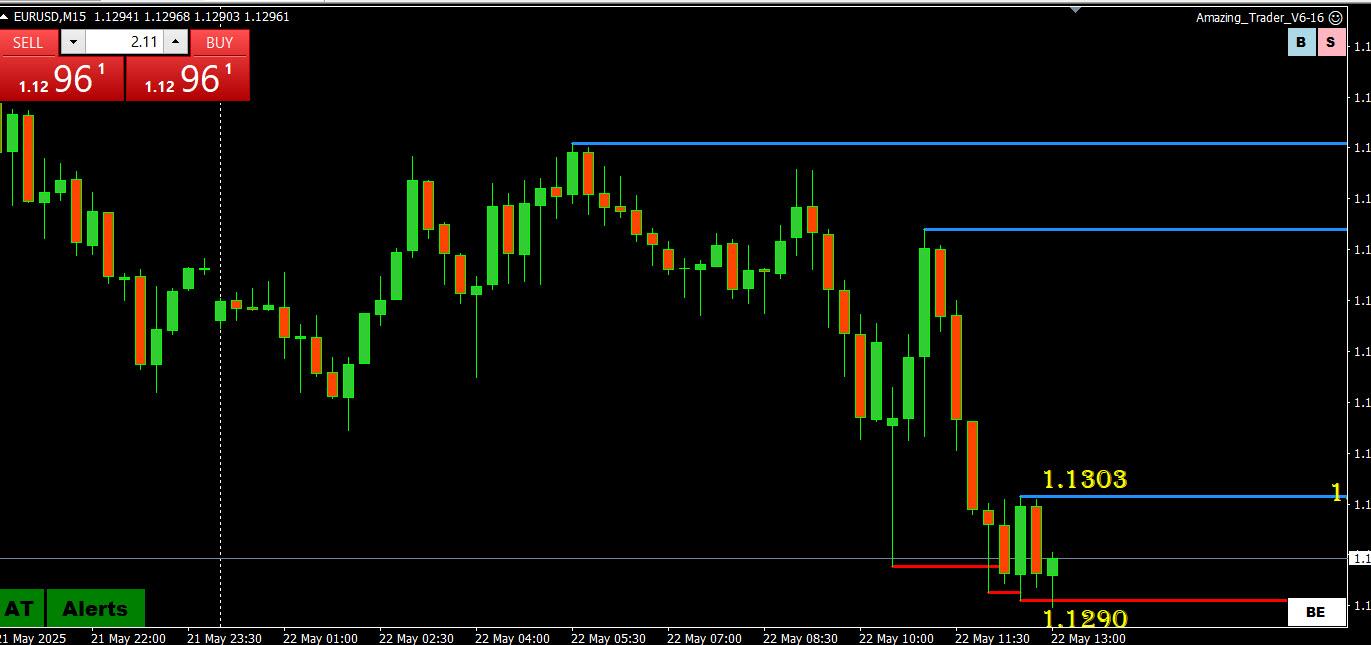
Market is probing for sell stops but so far running into bids.
You can see my earler post why AT is more than just a charting algp… not on;y are its levels consistently “amazing” but the logic of how to use then along with the patterns they form make AT invalubale for any type of trader.
AT = The Amazing Trader
Get your 30 day trial by clicking on this Amazing Trader link
May 22, 2025 at 10:03 am #25231May 22, 2025 at 9:40 am #25230May 22, 2025 at 9:38 am #25229May 22, 2025 at 9:33 am #25228EURUSD 1 HOUR – What AT is saying
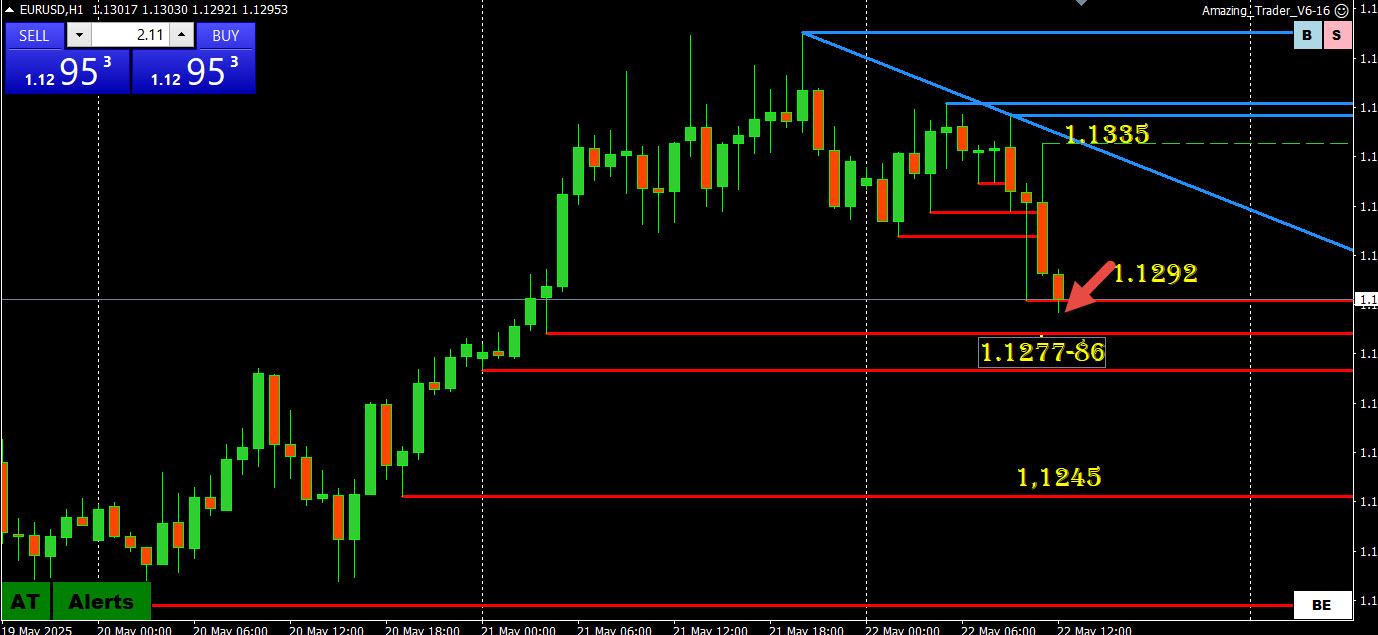
Once again, reaction to news is what matters (i.e. EURUSD weaker on dip in flash PMIs)
Low so far 1.1292, which if you look in search I have been citing it as AT’s
“Key level: 1.1292… firm break would confirm end of the current downtrend”
Chart shows 1.1286, 1.1277, 1.1245 should 1.1292 give way
May 22, 2025 at 9:20 am #25227May 22, 2025 at 9:12 am #25226USDJPY 4 HOUR – What AT is showing
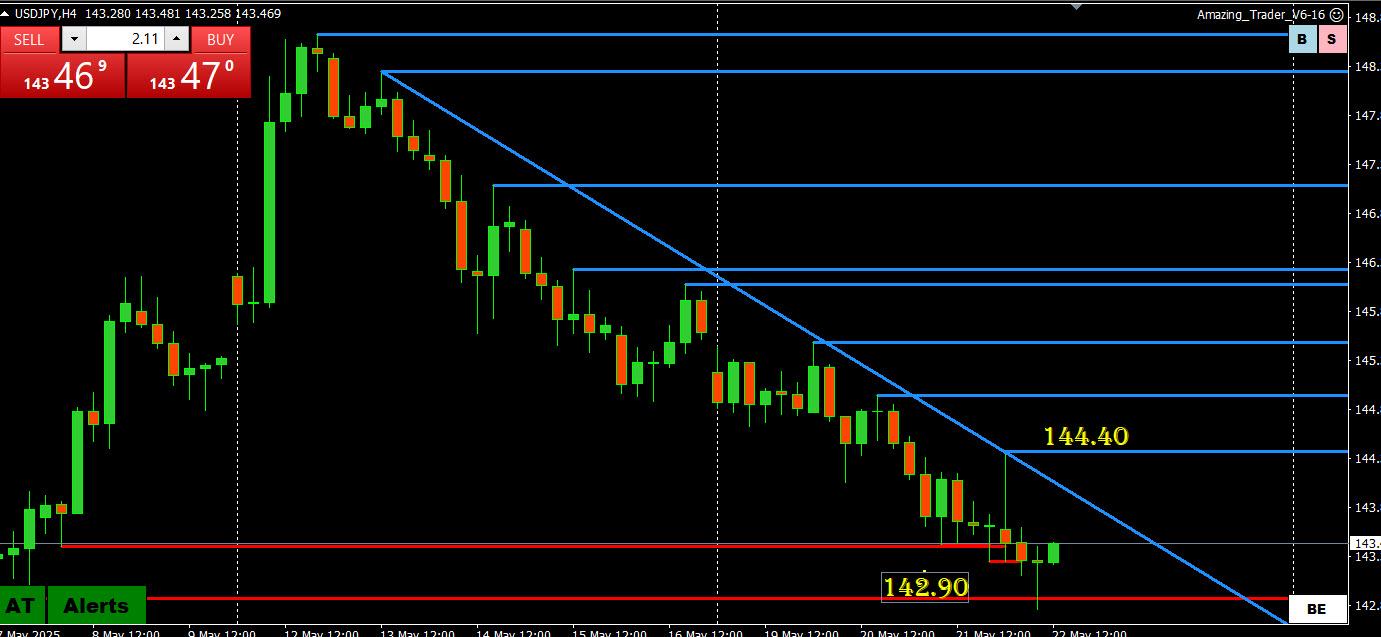
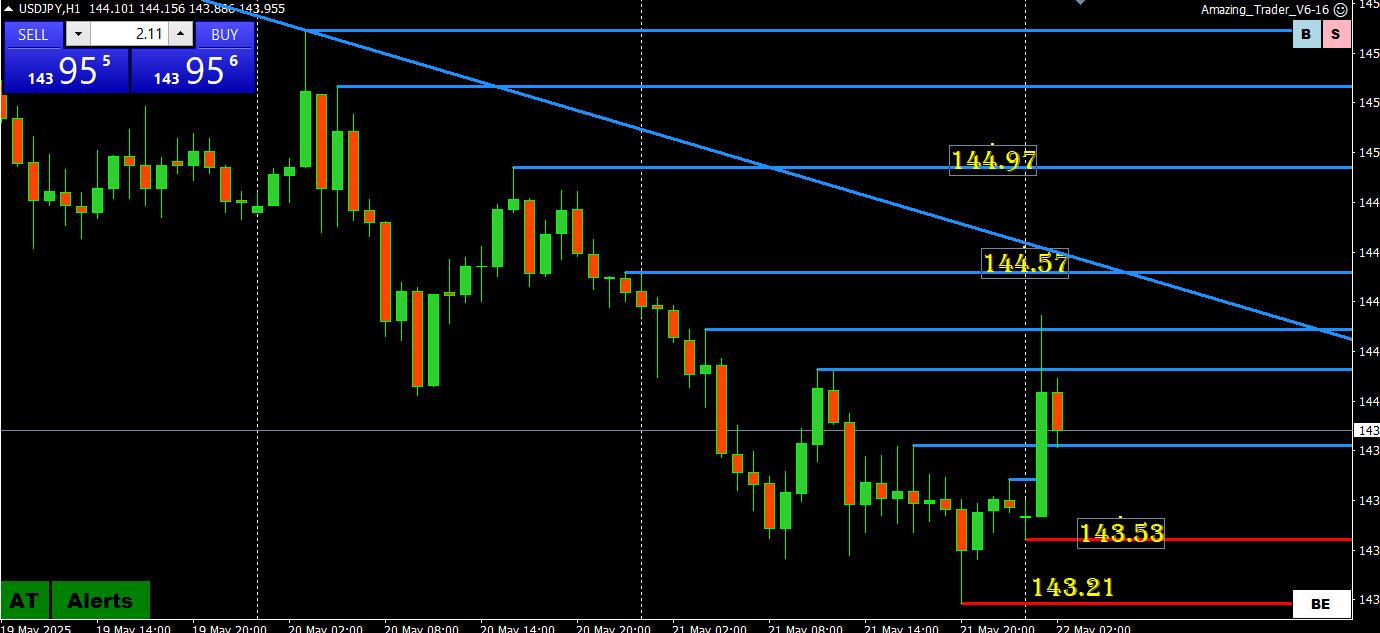
Classic case of a phantom spike as Tokyo opened (high 144.40) made a mess of charts by stopping out weak shorts, which in turn made it harder to absorb fresh selling that saw 142.90 briefly broken (low 142.80). before a bounce.
Going strictly by the chart,
Range is 142.80-144.40
Risk is on the downside while below 144.40
143-144 is a no man’s land (no stops to go after within it_
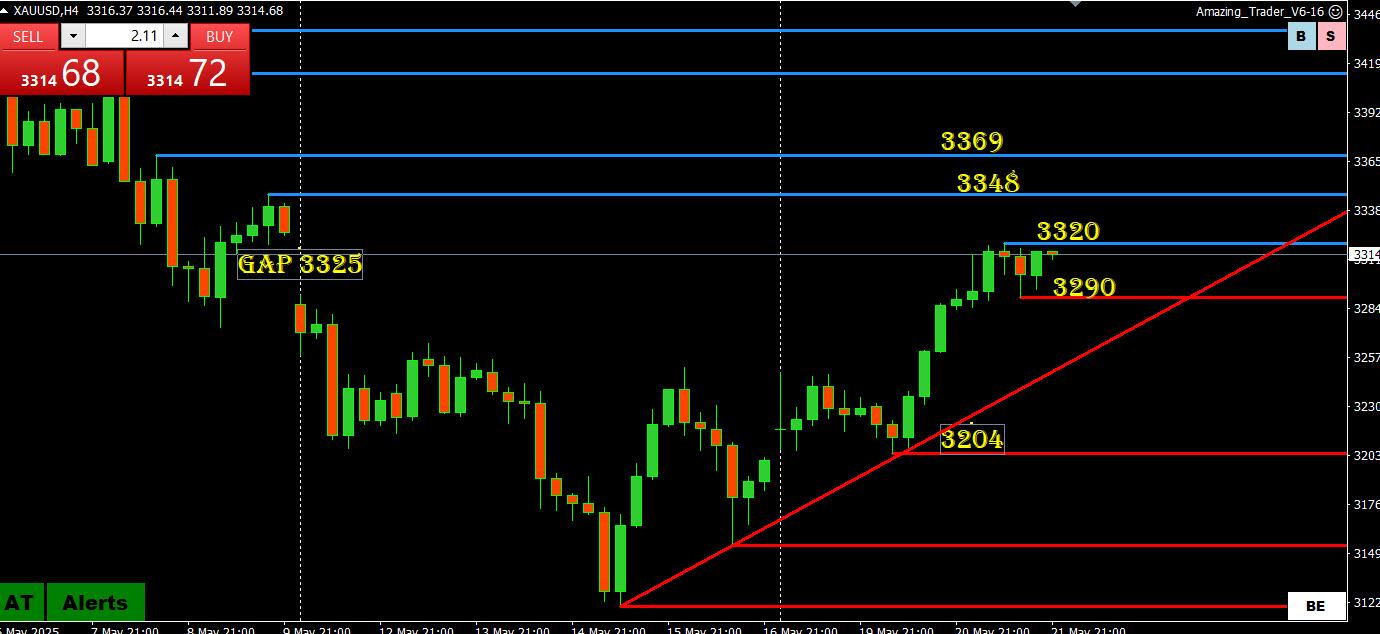
May 22, 2025 at 8:56 am #25225XAUUSD (GOLD) 4 HOUR CHART – What AT is showing?
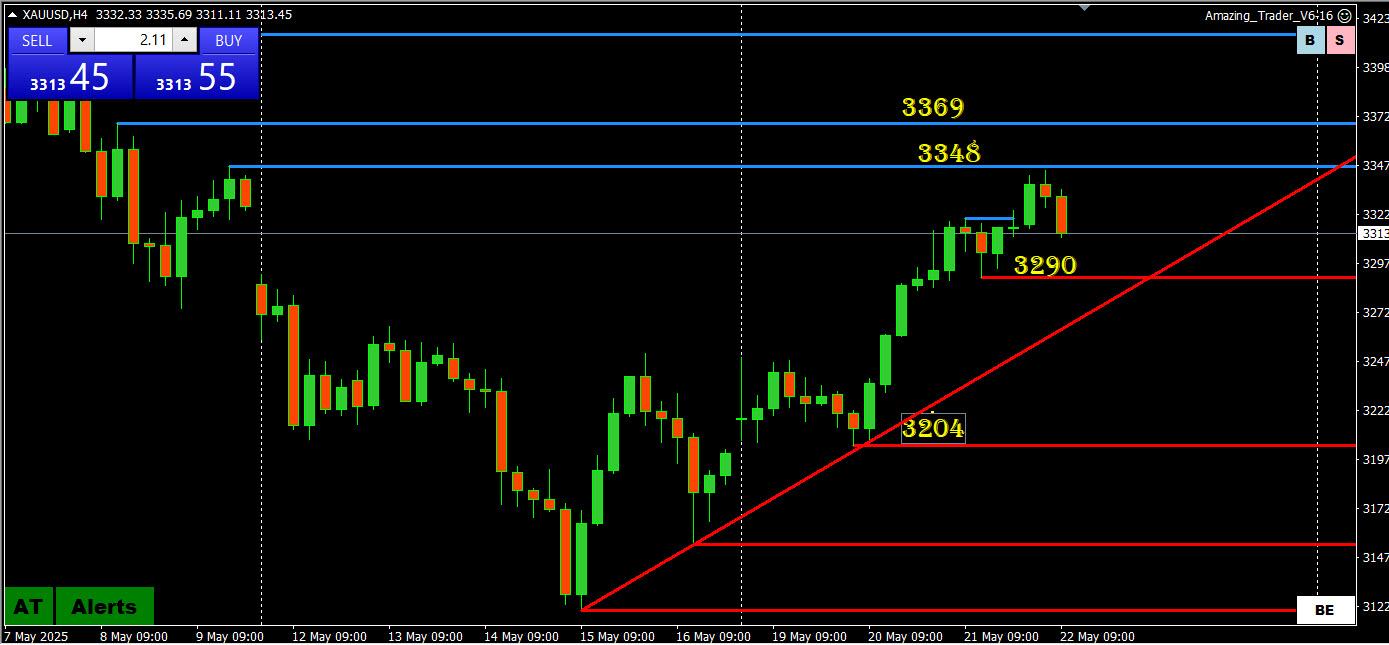
This AT chart looks like a textbook pocture…
Breakout to the upside filled the old gap and came within a hair of testing its 3348 target (high 3345).
On the downside, 3290 needs to hold yo keep a bid although only a break of the trendlkine would change the picture.
AT = The Amazing Trader
Get your 30 day trial by clicking on the Amazing Trader link un the menu bar at the top of this page)
May 22, 2025 at 8:49 am #25224Using my platform as a HEATMAP shows…
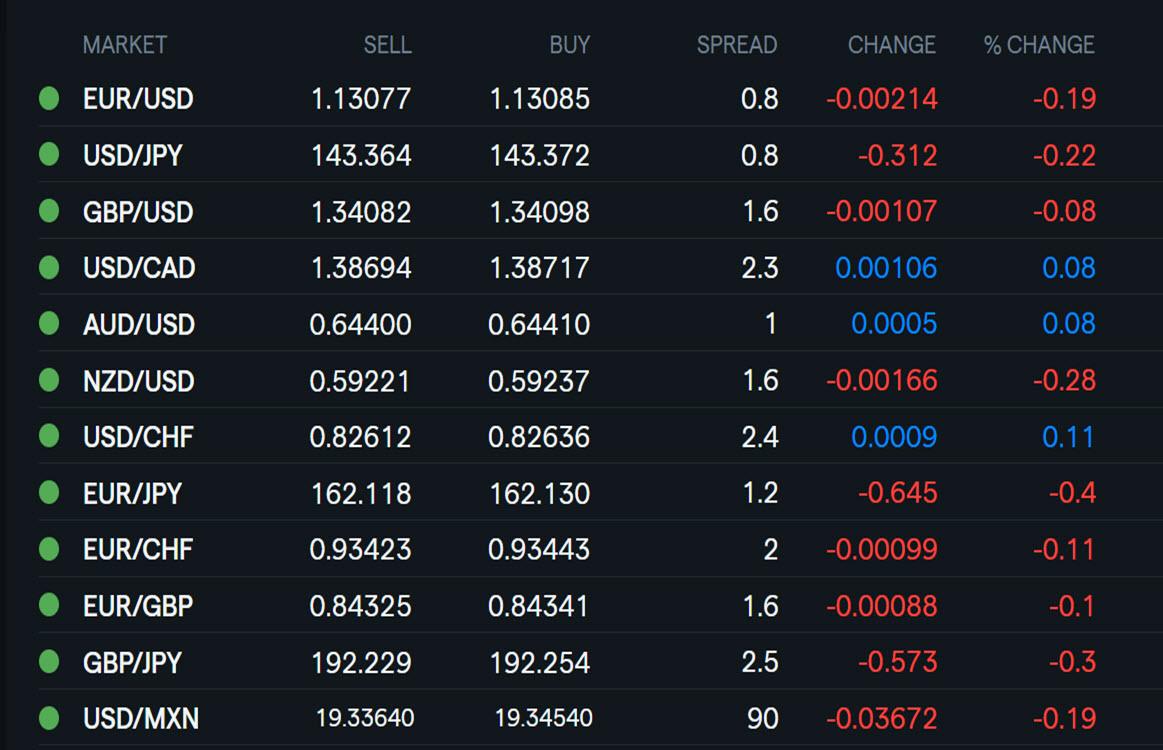
Markets taking a breather
… the dollar trading mixed USDJPY weaker but off its lowlow, EURUSD softer after flash PMIs
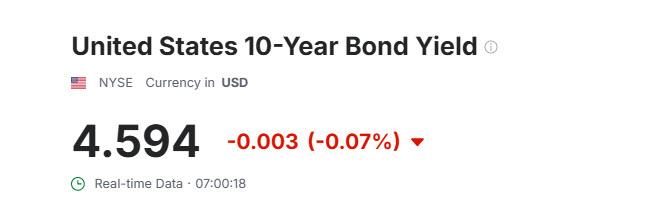
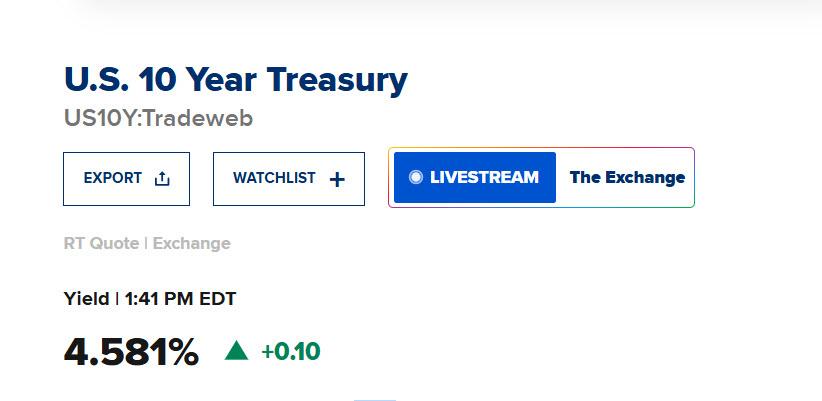
US bond yields remain elevated but 10-year so far resisting 4.60%
US stocks consolidating after yesterday’s sell-off
Gold a touch lower but above 3300
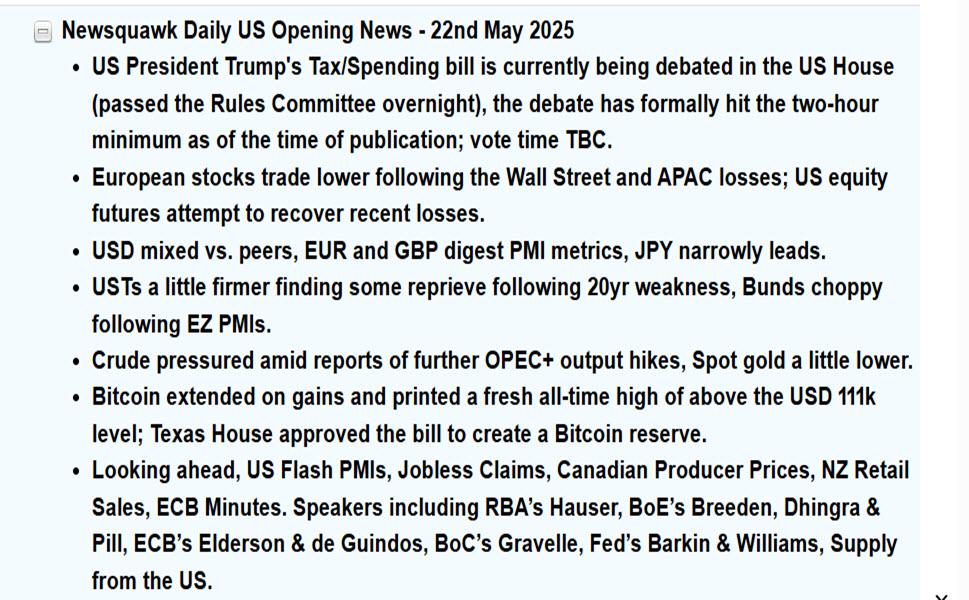
US data: Weekly jobless claims S&P global flash PMI, Expected House vote on tax bill
May 21, 2025 at 11:22 pm #25222May 21, 2025 at 11:03 pm #25220May 21, 2025 at 9:19 pm #25219Very timely article in our blog
Why Falling Stocks and Rising Bond Yields Are a Red Flag for Markets
 May 21, 2025 at 8:58 pm #25218May 21, 2025 at 8:01 pm #25217May 21, 2025 at 7:57 pm #25216
US500 (SP500) 4 HOUR – What AT is showing

The AT ladder strategy says when there are 3 lines (in this case blue) it often indicates the risk of an acceleration in the direction of the lines (in this case down).
This has seen 5875 broken, which confirms the end of the latest leg up.
While below 5875, then 5847 (briefly broken so far) and 5796-5816 are targeted. Note there is still a lingering opening week gap below 5786.
AT = The Amazing Trader
Get your 30 day trial by clicking on the Amazing Trader link un the menu bar at the top of this page)
May 21, 2025 at 6:48 pm #25212May 21, 2025 at 6:43 pm #25210EURUSD Daily
Supports: 1.13200, 1.12850 & 1.12650
Resistances: 1.13650, 1.13850 & 1.14600
For more serious advances EUR needs to break into that channel above the head , but not stay long in it – obnoxious banana slide – either you leave it behind you or you slip back where you came from…
Pattern is bullish for tomorrow and should result in next leg Up
 May 21, 2025 at 6:31 pm #25208May 21, 2025 at 6:30 pm #25207May 21, 2025 at 5:59 pm #25206May 21, 2025 at 5:47 pm #25205May 21, 2025 at 4:15 pm #25204
 -
AuthorPosts






- You must be logged in to reply to this topic.
Search
© 2024 Global View