
- This topic has 28,268 replies, 54 voices, and was last updated 6 minutes ago by GVI Forex 2.
-
AuthorPosts
-
June 9, 2025 at 2:25 pm #26009June 9, 2025 at 1:56 pm #26008June 9, 2025 at 1:14 pm #26007June 9, 2025 at 1:11 pm #26006
Today is a classic illustration of what is explained in this insightful blog article:
What is the one word that makes the forex market move?
 June 9, 2025 at 12:53 pm #26005June 9, 2025 at 12:29 pm #26004June 9, 2025 at 12:12 pm #26003June 9, 2025 at 12:01 pm #26002June 9, 2025 at 11:15 am #26000
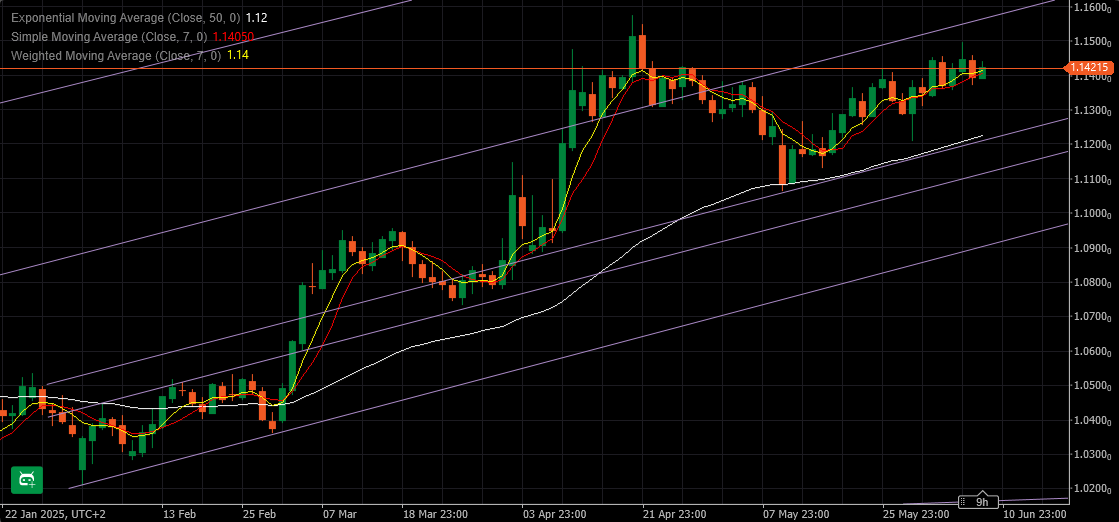
EURUSD
Direction Up at the moment , with supports that have to hold at: 1.14100 & 1.13950
Resistances: 1.14400, 1.14550 & 1.14950
Failure and return below 1.13950 would put EUR on defensive , and now time is of essence – if it wants to go more up, it has to start moving or risk a deeper correction towards 1.12450
 June 9, 2025 at 11:13 am #25999
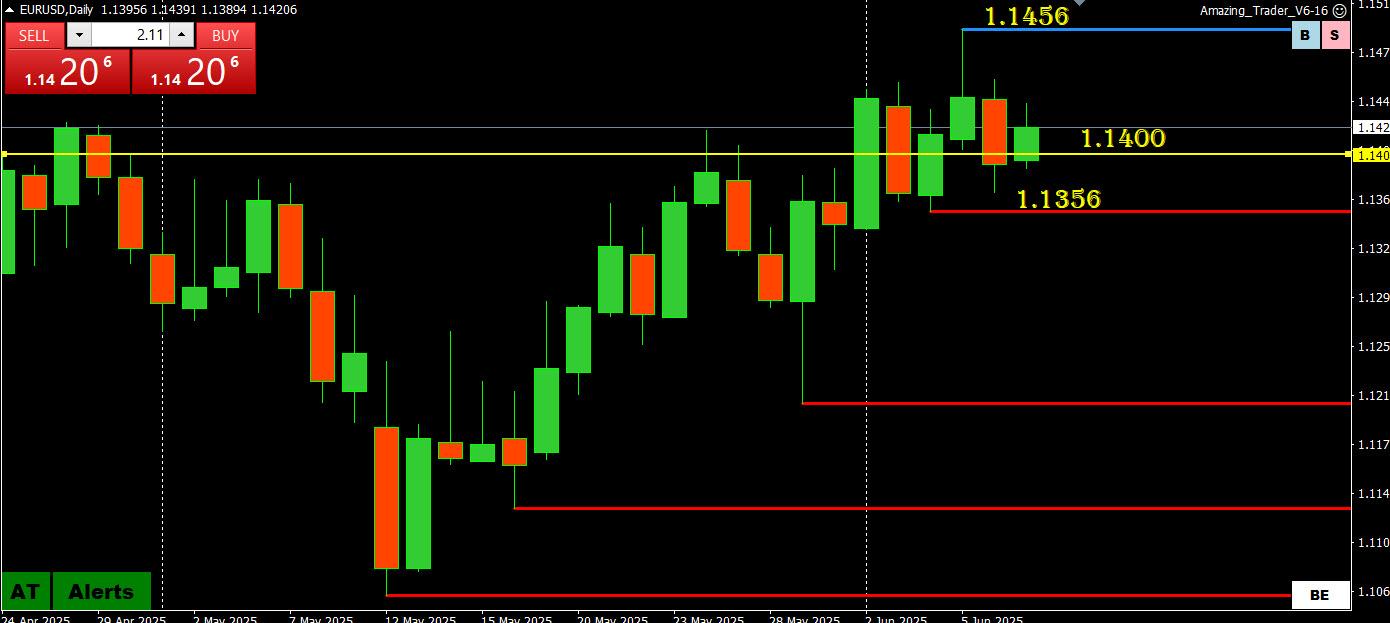
EURUSD
Momentum: Consolidating but daily chart risk still up while above 1.1356
Pattern: 1.1400 has traded 5 out of the past 6 days (exception was one day with a 11404 low so essentially 6 days in a row)
1.14 is not one of my magic levels but the longer this pattern goes on the greater the chance of a directional move once it is broken (in the direction of the breakout)
Broad range: 1.1356-1.1405
intermediate range: 1.1371-1.1457
EURUSD DAILY CHART
 June 9, 2025 at 11:08 am #25997
BTCUSD
OK – BTC managed to overcome that resistance at 106.985 and now the new picture is forming.
That picture points Upwards and possible levels that hasn’t been seen, yet.
Supports: 106.750, 105.625 & 103.000
Resistances: 109.700, 110.850 & 112.000
Before this day ends, I am not going to start auctioning levels that can be reached – for now it is going Up, so let’s see how high right now.
Close tonight is important.
 June 9, 2025 at 10:33 am #25996June 9, 2025 at 10:06 am #25995June 9, 2025 at 10:02 am #25994June 9, 2025 at 9:48 am #25993June 9, 2025 at 9:31 am #25992
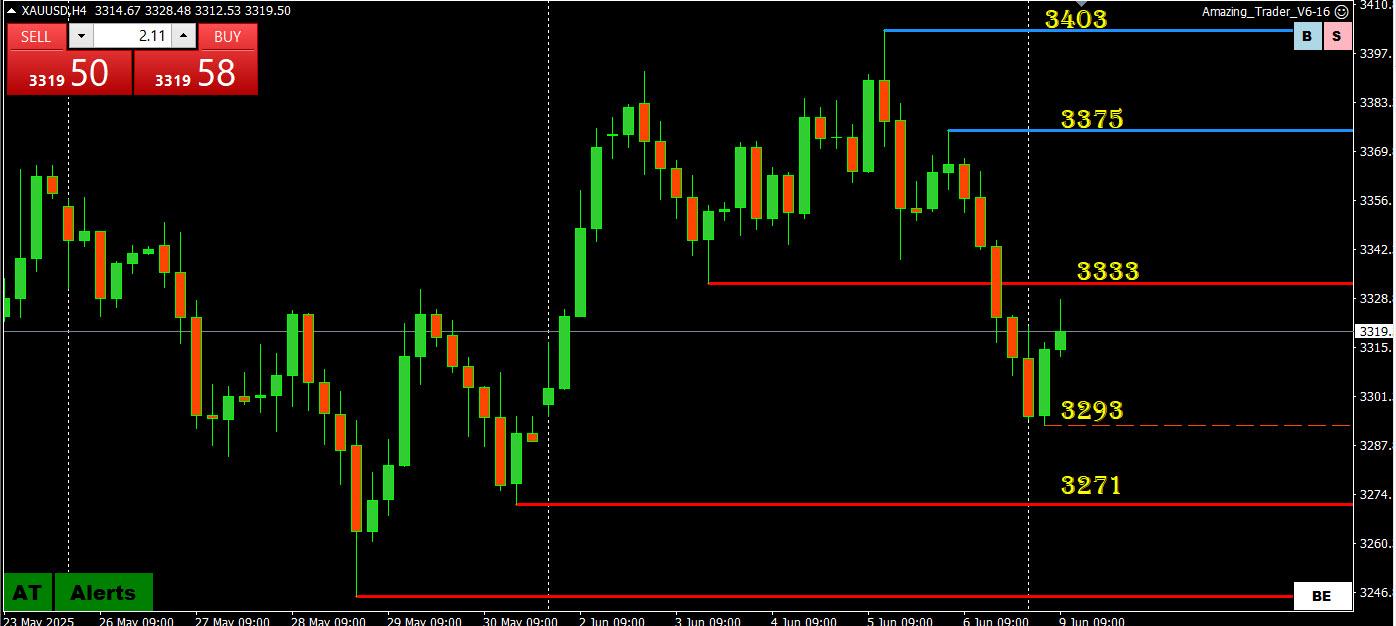
XAUUSD
Momentum: Tilted down while below 3333 but consolidating
Bounce from sub-3300 after last week’s failure above 3400 sets the current range at 3293=3403
Upside is limited while below the 3333 breakdown level so back above would be needed to shift risk back to 3375-3403
On the downside, 3293/3271 block 3245
XAUUSD 4 HOUR CHART
 June 9, 2025 at 9:14 am #25991
Using my platform as a HEATMAP shows…
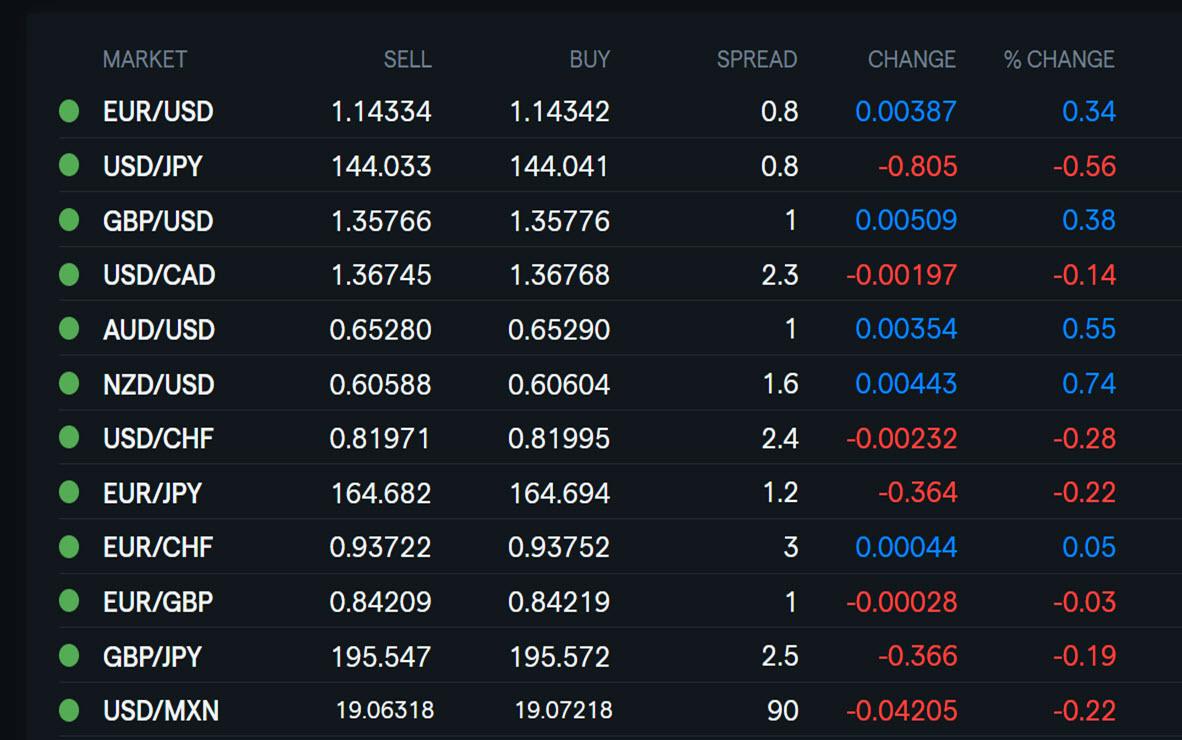
…the dollar trading weaker led by the NZD, AUD and JPY
Gold is up but still well off last week’s high
Stocks are steady after firming to close last week.
Focus is on U.S.-China trade talks in London.
In the U.S. focus is on troops deployed in response to immigration protests in Los Angeles
Partial holiday in parts of Europe in celebration of Whit Monday (Germany, France, and Switzerland) closed)
June 9, 2025 at 7:28 am #25990THIS WEEK’S MARKET-MOVING EVENTS (all days local)
Global trade tensions are visibly affecting economic data across major regions. In Europe, newly imposed US tariffs led to a sharp contraction in German exports to the US (-10.5%) and a narrowing of Germany’s trade surplus. France also posted a wider trade deficit due to export declines. The European Central Bank acknowledged tariff-related risks while lowering policy rates, warning that prolonged trade disputes could dampen growth and inflation prospects. Industrial output in Germany and France is already weakening, signaling further struggles ahead for the Eurozone.
In the US, this week’s CPI report will be critical for the Federal Reserve’s upcoming policy decisions. The labor market is softening, but inflation dynamics remain uncertain due to staggered tariff impacts and pre-tariff stockpiling by businesses. Asia faces its own challenges; Chinese and Indian inflation data remain subdued, while weakening trade conditions hint at broader regional slowdowns. Japan’s economy posted its first contraction in a year, driven by declining net exports and cautious domestic demand. Across all regions, trade disruptions are reshaping economic forecasts and raising uncertainty for the months ahead.
Econoday
June 9, 2025 at 7:14 am #25988June 9, 2025 at 7:14 am #25989June 8, 2025 at 11:13 pm #25987June 8, 2025 at 11:09 pm #25985USDHKD Monthly View
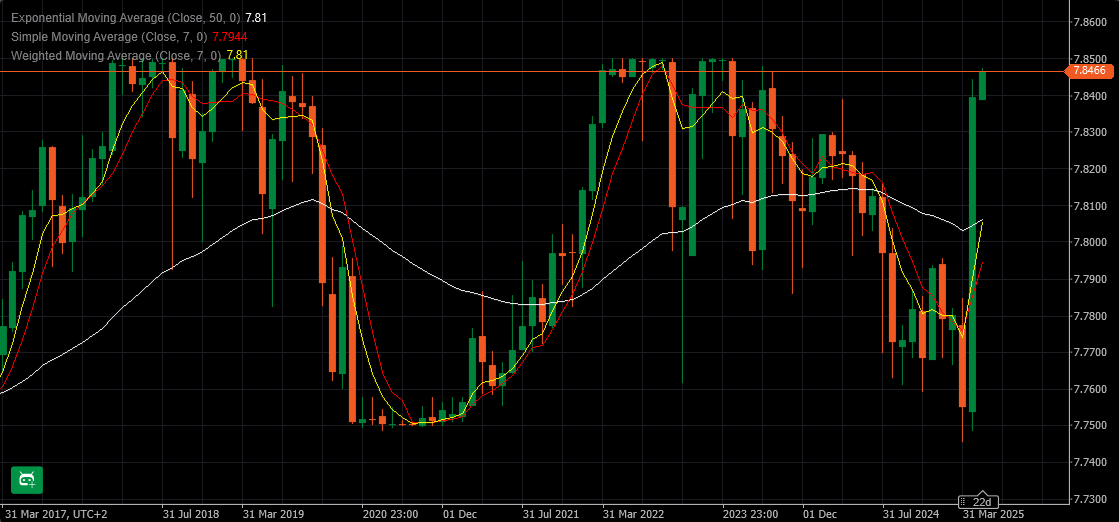
As we all know ( or maybe not 🙂
The USD/HKD exchange rate has been loosely pegged since 1983, which maintains an exchange rate between 7.75 and 7.85. This peg is set by the Hong Kong Monetary Authority and is designed to limit risk.
And right now we are just below the upper set limit at 7.85
This is just a reminder
 June 8, 2025 at 11:08 pm #25984June 8, 2025 at 11:07 pm #25983
Nikkei 225 Daily
Nikkei moved higher on Friday, but just above the head lies resistance – 38.340
Even if it manages to go over it, there is a more important ( and stronger one) at 39.330 – declination resistance line dating back to July 2024.
Supports are coming at : 37.830, 37.540 & 36.840
This is a technical view, but keep in mind that now fundamentals rule – trade negotiations, tariffs etc…
 June 8, 2025 at 11:05 pm #25982June 8, 2025 at 3:22 pm #25981
BTCUSD (BITCOIN)
Momentum: Pointing up BUT
Needs solid break of 106031 to confirm shift in risk to the upside
Above 106850 (use 107000 as well) would put 110718-111333 on the radar
On the downside, keeps a bid while above 103954-105000
Below 103954 would break the momentum and shift risk the other5 way.
BTCUSD (BITCOIN) 4 HOUR CHART
 June 8, 2025 at 2:11 pm #25980
BTCUSD
There are lots of talks around the net about Bitcoin surge in last 3 days:
– “Is this a Bear Trap?”
– “BTC reclaimed 105K – start of the new rally”
– “Once over 106K it will fly”…
But what we really have here right now – let’s talk about what we see and not what we wish for.
There is a downward channel starting at 21.05. and there is a “hypothetical “ upward channel trend line…
Resistance comes at 106.985 for tomorrow – both lines intersecting at that level, which gives it a special strength and meaning.
If BTC manages above it, we will talk about possible start of the new rally.
However if it fails there, BTC is going to dive below 100K and road to 95K would be wide open.
So this move up might be just a confirmation of a downtrend resistance line after all….
 June 8, 2025 at 1:55 pm #25979
This Week’s Biggest Gainers and Losers as BTC Price Reclaims $105K
Bitcoin’s gradual ascent continued in the past 24 hours, as the asset managed to bounce above $105,000 and even challenged $106,000 briefly.
Since most altcoins are quite sluggish on a daily scale, we will examine in more detail their weekly performances, where TAO and CRO stand in one corner, while HYPE, LEO, ICP, and TRX are in the other.BTC Above $105K
The world’s largest cryptocurrency tried to break out at the beginning of the business week from its consolidation range but was stopped at $106,000 and $106,500 on Monday and Tuesday. The following rejections drove it south to the lower boundary, but the bulls went on the offensive once again on Thursday.
However, bitcoin was stopped once again at $106,000, but this time, the correction was a lot more violent. Perhaps influenced by theongoing spatbetween US President Trump and Tesla CEO Musk, BTC’s price tumbled hard and went to a multi-week low of $100,400 (on Bitstamp).
As it came close to a breakdown below the coveted $100,000 level, the situation reversed and bitcoin started to recover some ground. By Friday noon, it had rebounded to around $105,000. Slightly more volatility followed, but BTC was ultimately stopped at $106,000 yesterday and now trades around $500 lower.
Its market capitalization has risen to just shy of $2.1 trillion, while its dominance over the alts stands tall at 61.5%.Alts Up and Down
The weekly scale shows that HYPE has emerged as the top gainer, having surged by almost 9%. As a result, the high-flyer now sits above $35, just less than $5 away from its recent peak. ICP follows suit with an 8% weekly increase, while LEO, TRX, and AAVE are next.
On the opposite scale are TAO (-11%), GT (-5.3%), and CRO (-5.2%). SOL, DOGE, ADA, AVAX, and SHIB are also about to close the weekly candle in the red.
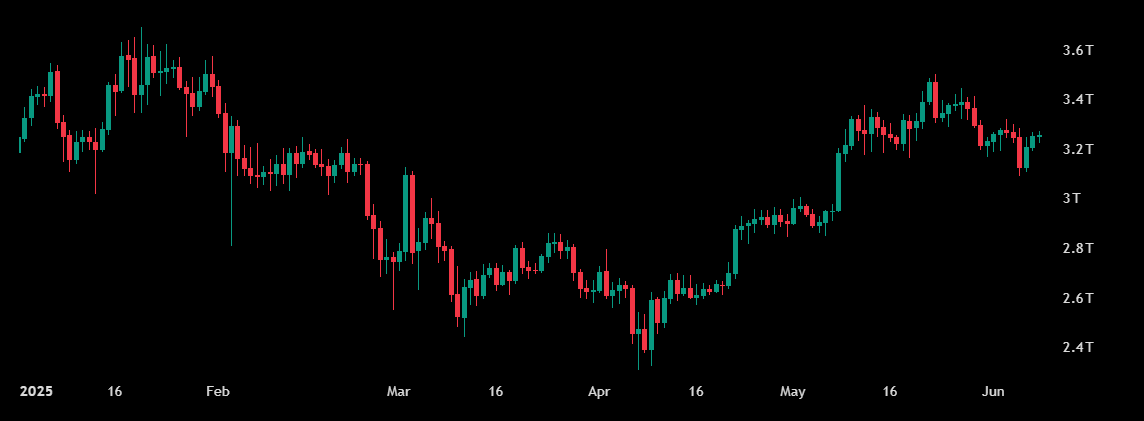
Total Crypto market cap
 June 8, 2025 at 1:40 pm #25978
Is it Fanatsy Land or are US stocks telling us something different?
The Tariff Lag: Waiting for the Data to Bite
 June 8, 2025 at 11:33 am #25977
Barron’s
No Rush for the Fed to Cut Rates
By Randall W. Forsyth, June 06, 2025Not as bad as feared but not as good as it looks. That’s what the latest employment data show. But for financial markets, the numbers suggest that the Federal Reserve may be slower to lower interest rates, contrary to President Donald Trump’s increasingly strident calls for cuts.
-
AuthorPosts





- You must be logged in to reply to this topic.
Search
© 2024 Global View