
- This topic has 28,115 replies, 54 voices, and was last updated 10 hours, 22 minutes ago by Belgrade Bobby.
-
AuthorPosts
-
July 21, 2025 at 12:14 pm #27802
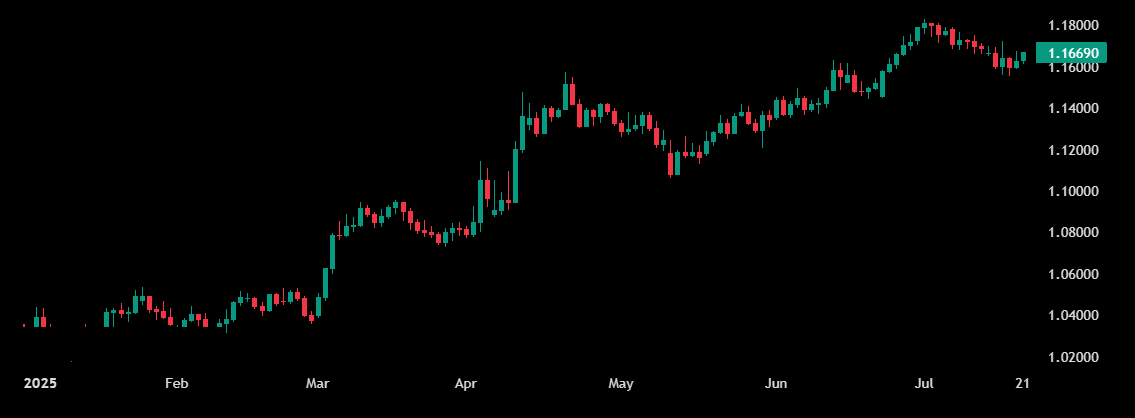
EUR/USD: Euro Collects Pips to $1.1650 as EU Leaders Meet Up to Discuss No-Deal Path with US
Key points:
· Euro climbs above $1.1650
· Markets eye trade updates
· Fed’s Powell to speak
Forex markets are in for a ride this week as the August 1 tariff deadline looms. The EU is already thinking about rejecting Trump’s letter.
Euro Firms as EU Plots Response
The EURUSD pair edged up 0.2% early Monday to hover near $1.1650, as forex traders braced for a politically charged week. EU leaders are preparing for a high-stakes showdown over US tariff threats — and the common currency is catching a cautious bid.
European representatives will meet this week to game out a response to Donald Trump’s latest hardline trade stance. The meeting agenda? Potentially rejecting the US President’s 30% blanket tariff letter on all EU imports.
According to a weekend story by the Financial Times, Trump is pushing for 15–20% minimum tariffs in any trade deal and has dismissed the EU’s car tariff olive branch. The 25% auto duty stays — or possibly climbs.
A Week Big on Macro
Traders are watching the August 1 deadline like it’s a pattern in formation, with risks mounting that the US will go full steam ahead on tariffs if the EU doesn’t bend. The euro’s strength today hints at a bit of hope — or at least some pricing in of brinksmanship.
The currency ticked up modestly, helped by light dollar weakness and the absence (so far) of an official EU retaliatory stance. But make no mistake — things could get volatile, fast.
Add in positioning ahead of central bank events, and it’s clear: this week’s FX action won’t be for the faint-hearted.
Central Bankers and Forex Markets
Fed Chair Jerome Powell speaks Tuesday, and markets will parse every word for clues about the path of interest rates. The Fed has paused hikes, but sticky inflation and a relatively strong labor market keep the “higher for longer” camp alive.
Later in the week, The European Central Bank is expected to hold rates at 2% on Thursday, keeping things steady while trade tensions simmer. Central bank officials have recently struck a more neutral tone, balancing slow growth with lingering inflation concerns.
Between geopolitics and rate policy, the euro-dollar is heading into a week full of headlines. For traders, that means one thing: buckle up and watch for those trading opportunities.
 July 21, 2025 at 12:08 pm #27801
US Dollar Falls Early Monday, Homes Sales Data in Focus During Fed ‘Quiet Period’
The US dollar fell against its major trading partners early Monday, with the focus on home sales data for June later in the week as Federal Reserve officials are in their ‘quiet period’ until after the July 29-30 Federal Open Market Committee meeting.
Monday’s schedule is light, with only leading indicators data for June to be released at 10:00 am ET.
Highlights on Tuesday include nonmanufacturing data for July from the Philadelphia Federal Reserve bank, weekly Redbook same-store sales and the Richmond Fed’s conditions readings for July.
Fed Chairman Jerome Powell and Fed Vice Chair for Supervision Michelle Bowman are both due to speak on Tuesday but should not address monetary policy or the economy due to the ‘quiet period.’
Existing home sales data for June will be the key release Wednesday. Weekly mortgage applications and oil stocks data will be published as well.
Thursday’s schedule is busy with weekly jobless claims, S&P Global flash estimates for July manufacturing and services purchasing managers’ indexes, and new home sales data for June the main releases.
Friday’s schedule features durable goods orders data for June and the Kansas City Fed’s services reading for July.
A quick summary of foreign exchange activity heading into Monday:
EURUSD rose to 1.1651 from 1.1626 at the Friday US close and 1.1645 at the same time Friday morning. There are no Eurozone data on Monday’s schedule. The next European Central Bank meeting is scheduled for Thursday, when no change in interest rates is expected.
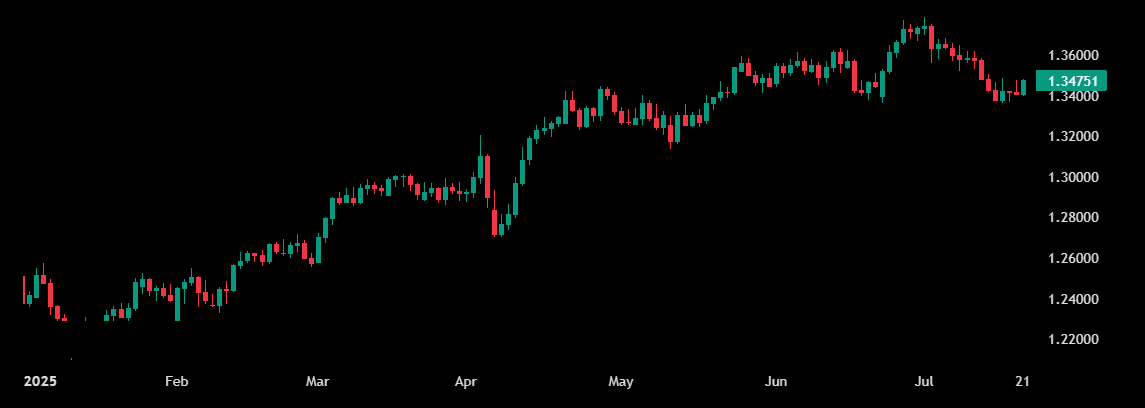
GBPUSD rose to 1.3469 from 1.3415 at the Friday US close and 1.3454 at the same Friday morning. There are no UK data on Monday’s schedule. The next Bank of England meeting is scheduled for Aug. 7.
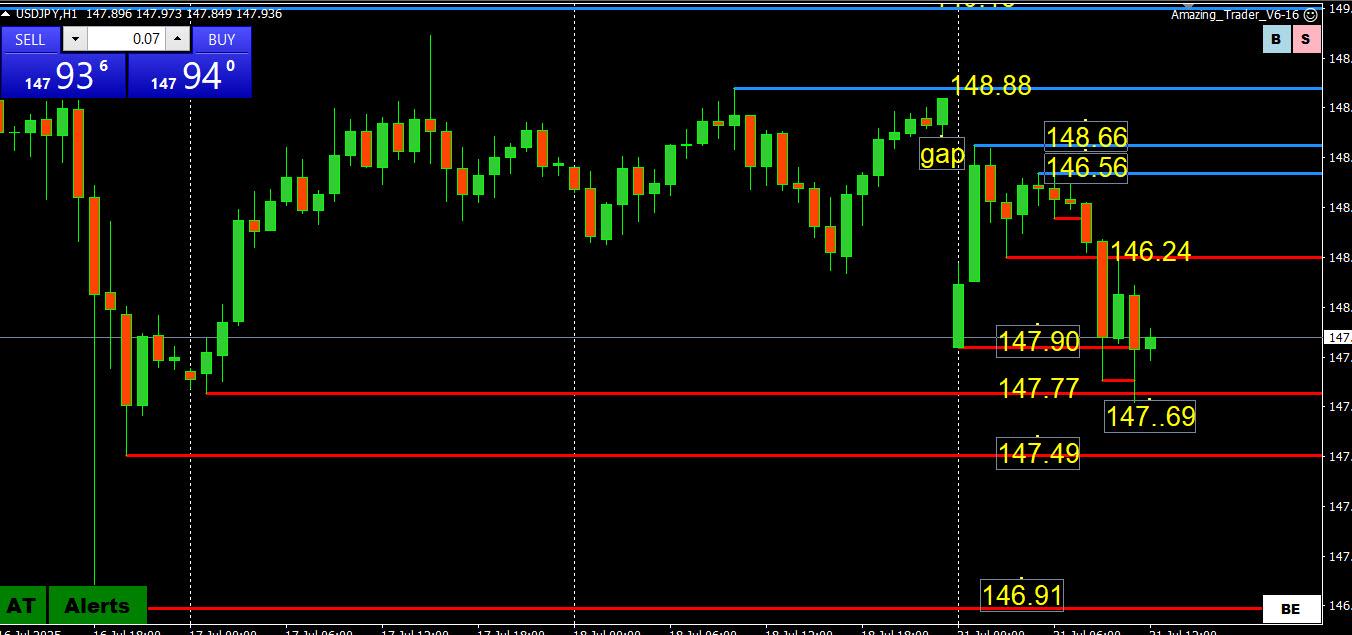
USDJPY fell to 147.6741 from 148.7572 at the Friday US close and 148.5281 at the same time Friday morning. Monday is a holiday in Japan, so there are were no data released overnight. The next Bank of Japan meeting is scheduled for July 30-31.
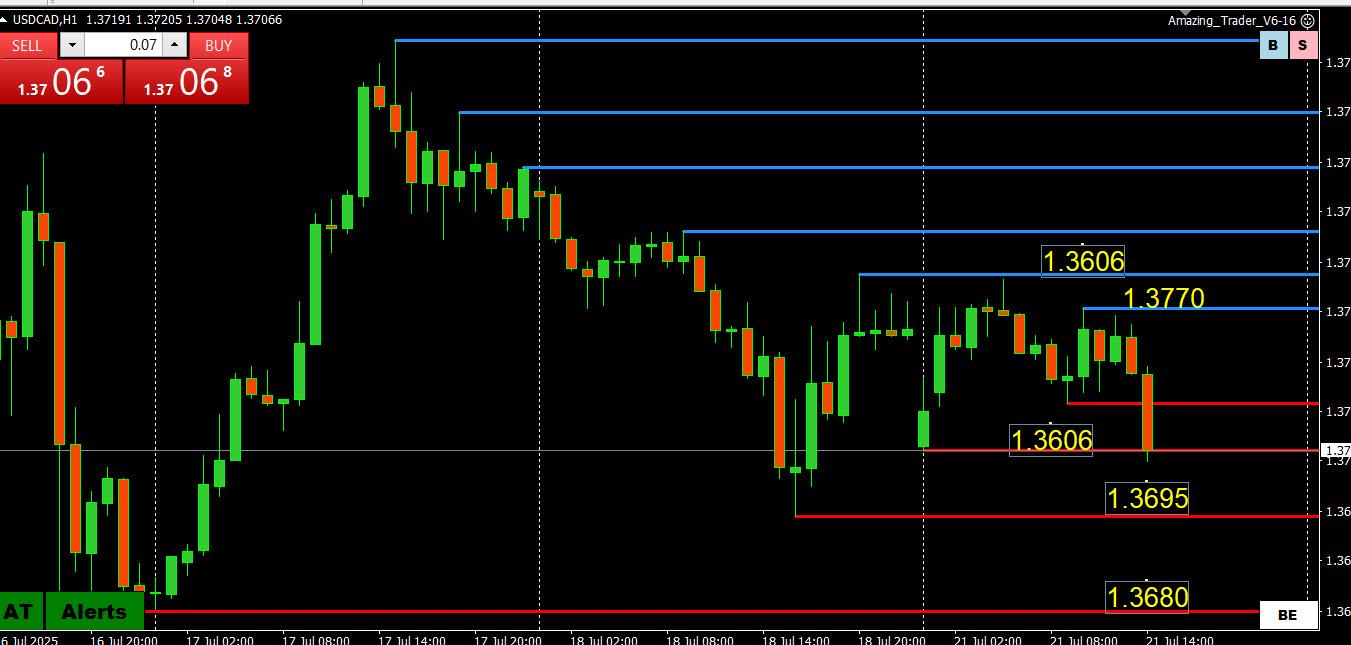
USDCAD fell to 1.3712 from 1.3729 at the Friday US close and 1.3723 at the same time Friday morning. Canadian industrial and raw materials prices for June are due to be released at 8:30 am ET, followed by the Bank of Canada’s business outlook survey at 10:30 am ET. The next Bank of Canada meeting is scheduled for July 30.
GBPUSD Chart
 July 21, 2025 at 12:02 pm #27800July 21, 2025 at 11:49 am #27797July 21, 2025 at 11:45 am #27796July 21, 2025 at 11:45 am #27795July 21, 2025 at 11:39 am #27794July 21, 2025 at 11:34 am #27793July 21, 2025 at 11:05 am #27792July 21, 2025 at 10:58 am #27791July 21, 2025 at 10:49 am #27790July 21, 2025 at 10:36 am #27788July 21, 2025 at 10:25 am #27787July 21, 2025 at 9:53 am #27784July 21, 2025 at 9:50 am #27783July 21, 2025 at 9:40 am #27781July 21, 2025 at 9:26 am #27779
Using my platform as a Heatmap shows …
… the dollar trading on the soft side (commodity currencies lagging, JPY outperforming
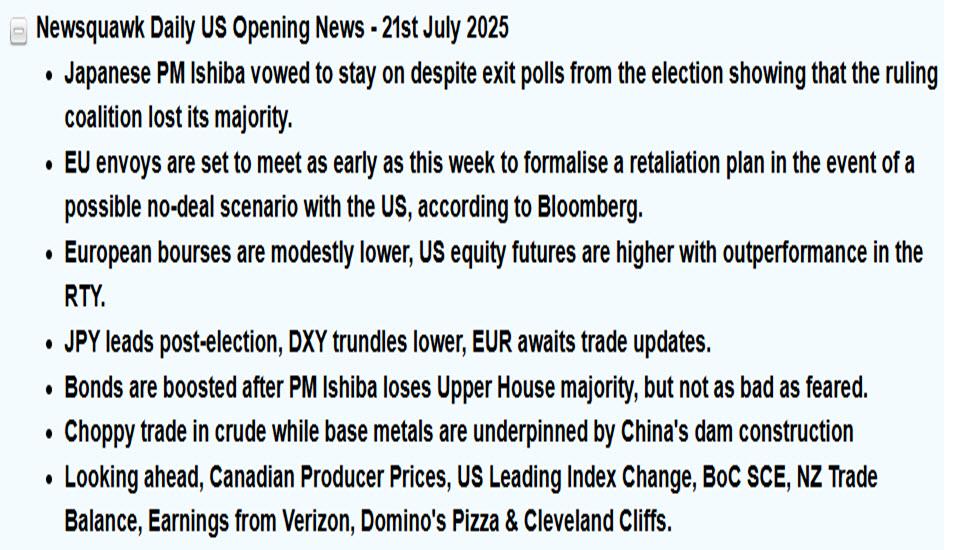
USDJPY a focus and trading weaker with price action suggesting Upper House election results were priced in.
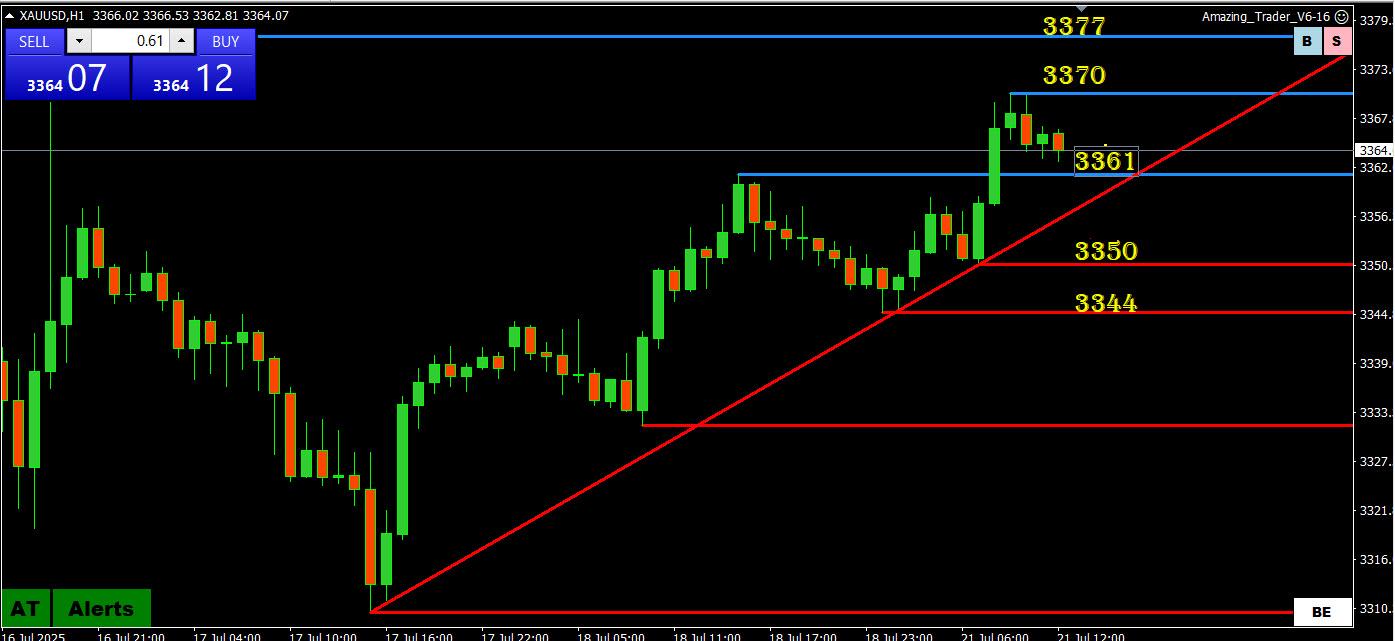
Gold is firmer
Bitcoin is up
US stocks are up
US bonds are up (yields are lower)
 July 21, 2025 at 8:47 am #27778July 21, 2025 at 7:53 am #27777
How about this on Japan elections anti-immigration party making gain (from Reuters)
TOKYO – The fringe far-right Sanseito party emerged as one of the biggest winners in Japan’s upper house election on Sunday, gaining support with warnings of a “silent invasion” of immigrants, and pledges for tax cuts and welfare spending.
Birthed on YouTube during the COVID-19 pandemic spreading conspiracy theories about vaccinations and a cabal of global elites, the party broke into mainstream politics with its “Japanese First” campaign.
July 20, 2025 at 11:31 pm #27776THIS WEEK’S MARKET-MOVING EVENTS (all days local)
The global economic outlook for the week of July 21, 2025, centers less on new data and more on policy signals and sentiment as markets brace for the expiration of the U.S. 90-day tariff pause on August 1. In Asia, economic releases are light, with key attention on South Korea’s second-quarter GDP and New Zealand’s trade figures. Industrial production and inflation data from Singapore, Taiwan, and Hong Kong are expected to remain subdued, reflecting broader trade uncertainty. The region’s focus will be on any signs of progress in trade negotiations, as few expect the tariff suspension to be extended.
In Europe, the spotlight shifts to business and consumer sentiment indicators amid a continued data drought. France’s business climate remains soft, and eurozone consumer confidence remains low, with households hesitant to spend. Composite PMI figures for France, Germany, the eurozone, and the UK will be critical in determining whether the services sector can continue offsetting persistent manufacturing weakness. Meanwhile, the European Central Bank is expected to hold rates steady and signal caution as it awaits clarity on the evolving U.S.–EU trade relationship. In the U.S., housing activity is cooling due to mortgage rate volatility, but regional Fed manufacturing indexes suggest a potential rebound in factory output. Investors are watching for durable goods data and Fed Chair Powell’s July 30 remarks as indicators of future policy direction.
Econoday
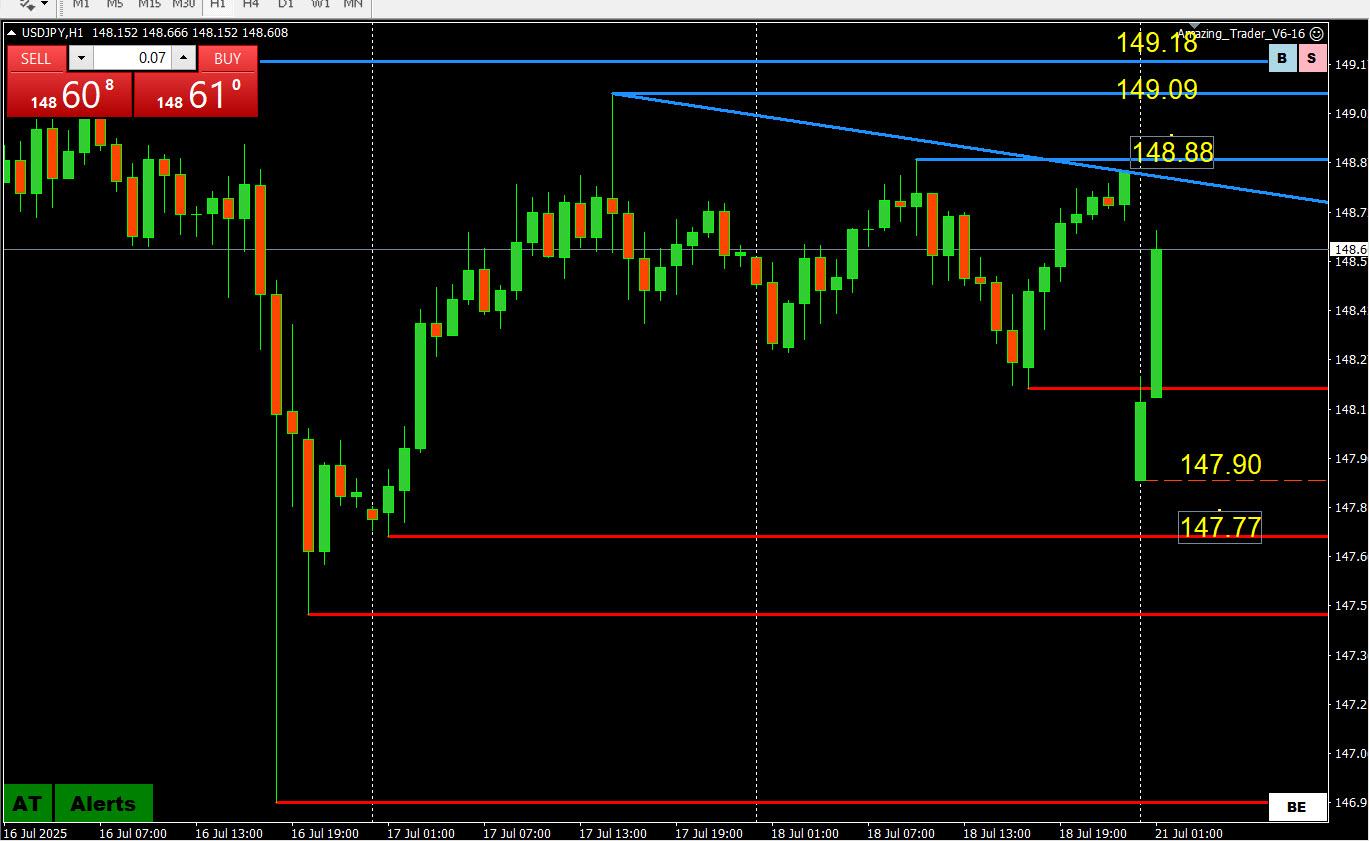
July 20, 2025 at 10:47 pm #27775July 20, 2025 at 10:41 pm #27774July 20, 2025 at 9:26 pm #27773July 20, 2025 at 9:00 pm #27772July 20, 2025 at 7:41 pm #27771July 20, 2025 at 7:38 pm #27770Usdjpy gap or no gap?
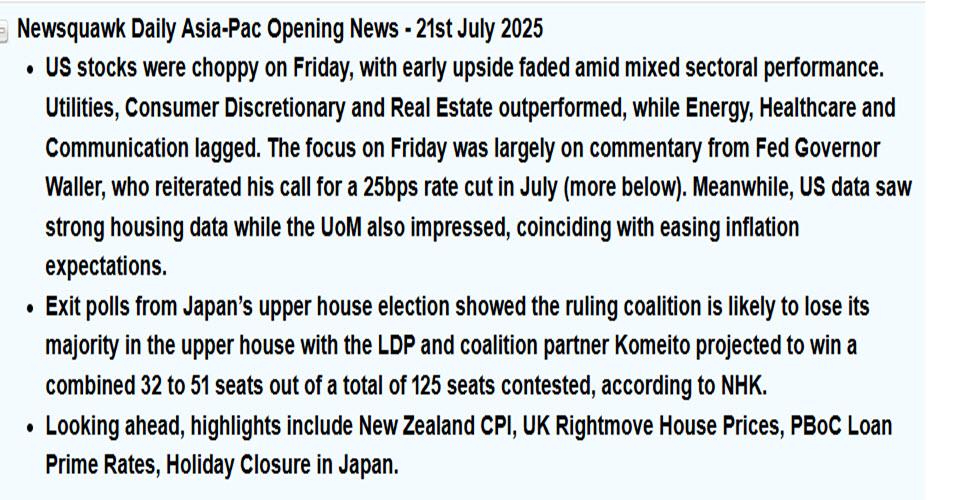
Japan’s shaky government loses upper house control
By Mariko Katsumura and Kantaro KomiyaSummary
Ruling coalition loses majority in upper house, NHK says
Opposition parties make gains with pledges for tax cuts
Japan faces August 1 deadline on US tariffs
Fringe anti-immigration party makes gainsTOKYO, July 21 (Reuters) – apan’s ruling coalition is certain to lose control of the upper house in Sunday’s election, public broadcaster NHK reported , an outcome that further weakens Prime Minister Shigeru Ishiba’s grip on power as a tariff deadline with the United States looms.
While the ballot does not directly determine whether Ishiba’s administration will fall, it heaps political pressure on the embattled leader who also lost control of the more powerful lower house in October.
July 20, 2025 at 7:35 pm #27769BTCUSD – Bitcoin
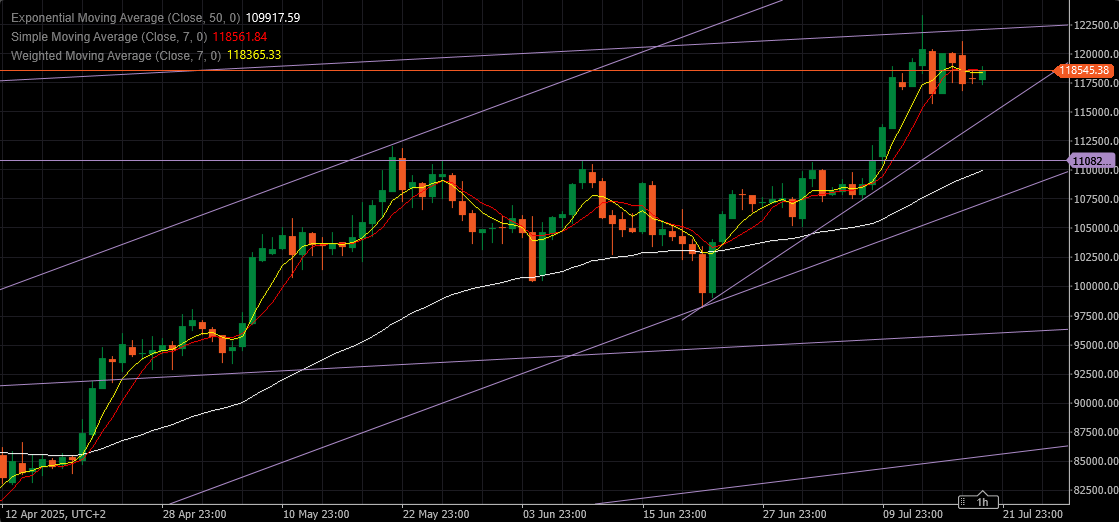
What we have in front of us on this chat might be two things:
Consolidation prior to another push Up to another new high
Creation of interim Top that would be followed by a correction
To avoid second possibility , BTC has to take out previous high in next two days and to use 122.000 as a footing for further advances.
Resistances: 119.775, 121.050 & 122.100
Supports: 117.325, 116.850 & 115.045
Close tonight above 118.600 would give BTC chance to test resistances tomorrow.
Close below 118.140 would open a way towards supports.
 July 20, 2025 at 7:23 pm #27768
XRPUSD
XRP is holding its Bullish trend and based on historical behaviour it can continue Up in the same manner for at least another week, before a correction kicks in.
For that to happen it has to stay clear of 3.45 support
There are few more supports that can underpin it further, but any dip would not only slow it down but might endanger this rally.
Supports: 3.35, 3.25 & 3.05
There is only one resistance and it is previous high at 3.6665
Overall target might be around 5.00 area within next two months.
 July 20, 2025 at 1:47 pm #27767
Ethereum Set To Hit $10,000, Elliott Wave Analysis Predicts
Over the past week, the Ethereum (ETH) market recorded a solid positive price performance, reaching as high as $3,600. Notably, the second-largest cryptocurrency, among many altcoins, is experiencing a strong bullish momentum as evidenced by price gains of 45.48% over the last month. Amid the present market euphoria, Dutch market analyst Gert Van Lagen has backed Ethereum’s chances for sustained price gain based on an Elliott wave analysis.
Ethereum To Complete Bull Market Cycle On High Note – Analyst
The Elliot wave theory is a technical framework used to predict price targets by identifying repetitive patterns in price movements driven by investor psychology. In an X post on July 18, Van Lagen explains that this price forecast framework indicates that Ethereum may be entering the final phase of its bull market cycle, with a potential price target of $10,000.
According to the analyst, the ETH bi-weekly trading chart suggests the cryptocurrency is completing a textbook five-wave cycle that began in 2022, with the fifth and final wave now unfolding in the form of an expanding diagonal.
For context, the Elliot wave theory identifies a single price cycle in five waves, each composed of subwaves abc. As seen in the chart above, this includes the wave I marked by an initial impulse rally, followed by a sharp corrective Wave II as seen between 2022 and 2023. Wave III is defined by explosive momentum, pushing Ethereum to new highs, before entering a lengthy Wave IV consolidation characterized by a flat correction.
Finally, there is wave V, i.e., the current status of the market, which is usually a final price surge. After breaking out of the upper boundary of the Wave 3–4, Gert Lagen explains that Ethereum is about completing subwave a of wave V following its most recent price gains.
Therefore, investors should expect a brief pullback to retest the breakout zone, which would complete subwave ‘b’. After that, a blow-off rally forming subwave ‘c’ is on the cards, i.e., a price move that could push Ethereum to the $10,000 mark based on a broader Elliott wave analysis on the Ethereum bull market stretching from 2019 to date.
Ethereum Price Overview
At press time, Ethereum is trading at $3,657, posting gains of 1.79% over the past 24 hours and 21.8% over the last seven days. However, daily trading volume has dropped by 46.03%, signaling a potential weakening in the bullish momentum behind the current price surge. Following its most recent gain, the altcoin continues to retain its position as the second-largest cryptocurrency with a market cap of $441.14 billion and 11.1% market share.
 July 20, 2025 at 1:37 pm #27766
Bitcoin Re-Enters Profit Zone As Greed Rises, But Rally To $200,000 Still Possible
Bitcoin reached a new all-time high of $122,838 on July 14, but has since slipped into a phase of consolidation around the $118,000 level. The recent pause in upward momentum hasn’t dampened market sentiment, which remains firmly bullish. According to Coinmarketcap’s Fear & Greed Index, Bitcoin is still currently sitting at a greed level of 68. This sentiment, combined with technical analysis of the Logarithmic Growth Curve (LGC), shows that Bitcoin is still on track for powerful upward moves.
Greed Returns To The Market, But Not Yet Overheated
Bitcoin’s price action has spent the majority of the past 48 hours holding above $118,000 after a wave of profit-taking took place just after it peaked at $122,838. However, on-chain data shows an interesting overview of Bitcoin investors.
Particularly, 30-day moving average of the Fear and Greed Index has climbed back into the optimism zone, now sitting at 66.2%. Although sentiment surrounding the leading cryptocurrency is currently in greedy territory, this level is well below the 75% to 80% range, which coincided with new price highs in March 2024 and December 2025
The current 66% reading, while in the green level, suggests there’s still room for bullish sentiment to grow before the market enters a euphoric blow-off phase. In essence, this metric shows that if Bitcoin continues to consolidate and push higher without the sentiment entering into extreme greed levels between 75% and 80%, it will continue on a sustainable push to new heights.
Bitcoin Re-Enters Resistance Zone On Growth Curve
As mentioned earlier, Bitcoin’s break above the $120,000 price level and its subsequent peak were followed by a wave of profit-taking. The trend saw Bitcoin’s price correct to $116,000 very briefly before stabilizing around $118,000. Interestingly, technical analysis of the weekly candlestick timeframe shows that Bitcoin re-entered the first band of the Logarithmic Growth Curve (LGC) resistance zone as it reached this price peak.
This band, which is identified as the light pink region in the chart below, has always served as the profit-taking area in each of Bitcoin’s past bull markets. Interestingly, Bitcoin briefly tapped this area in December 2024 and January 2025 before being rejected, in a pattern similar to that of January 2021’s first top in the previous bull cycle.
Basically, this indicator implies that Bitcoin is now at the start of a final build-up phase.
At the time of writing, Bitcoin is trading at $118,152.

-
AuthorPosts



- You must be logged in to reply to this topic.
Search
© 2024 Global View