
- This topic has 28,130 replies, 54 voices, and was last updated 13 hours, 30 minutes ago by Belgrade Bobby.
-
AuthorPosts
-
August 5, 2025 at 12:43 pm #28442August 5, 2025 at 12:38 pm #28441August 5, 2025 at 12:24 pm #28438August 5, 2025 at 12:17 pm #28437
S&P and Nasdaq Futures Rise
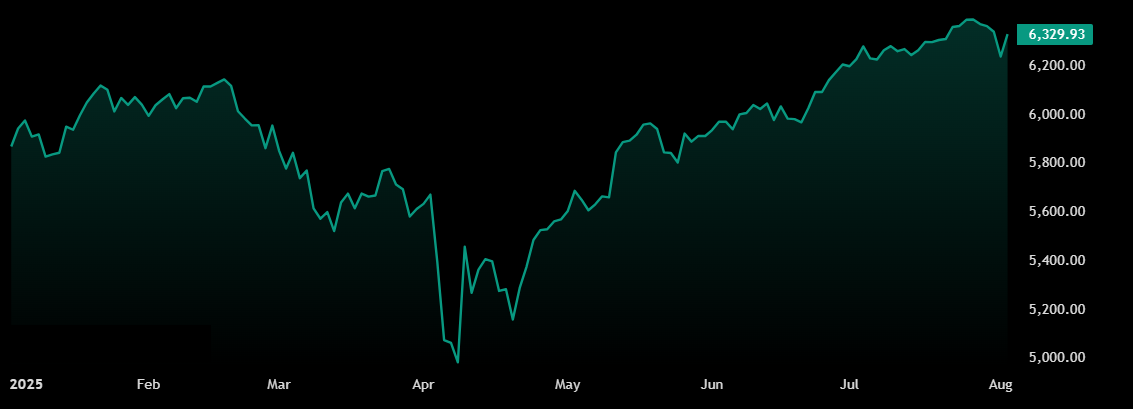
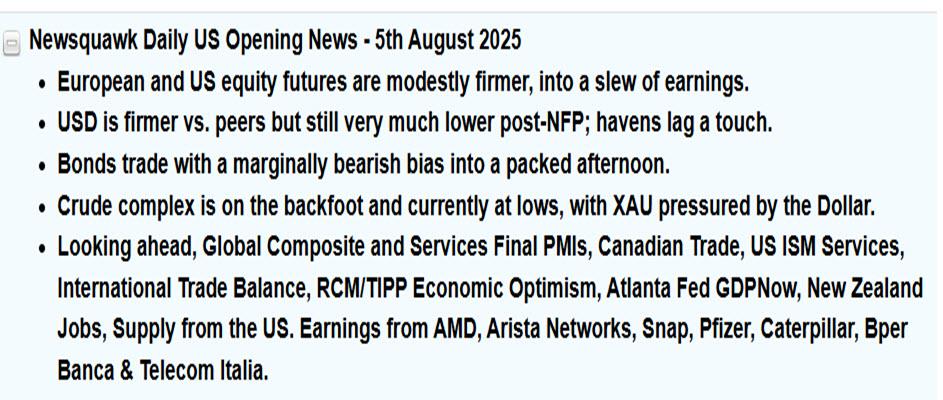
S&P 500 futures rose 0.3% and Nasdaq 100 futures gained 0.4% on Tuesday, while the Dow Jones hovered around the flatline, following strong gains of over 1% in the previous session.
Investor sentiment remained upbeat, supported by corporate earnings and growing expectations of Federal Reserve rate cuts.
Palantir shares surged nearly 6% in premarket trading after the company raised its annual revenue forecast for the second time this year.
Pfizer advanced 2.4% after beating both earnings and revenue estimates.
In contrast, Caterpillar fell 3.6% following an earnings miss, and Vertex Pharmaceuticals tumbled 13.8% after announcing it would not move forward with late-stage trials for its next-generation pain treatment.
Meanwhile, megacap tech stocks were mostly higher before the opening bell, with Nvidia up 0.6%, Microsoft 0.5%, Apple 0.4%, Amazon 0.5%, Meta 0.3%, Broadcom 0.5%, and Tesla 0.4%, while Alphabet was little changed.
SP 500 Chart
 August 5, 2025 at 12:13 pm #28436
EURUSD Technical Analysis – Aggressive dovish re-pricing weighed on the greenback
Fundamental Overview
The USD sold off across the board on Friday following a softer than expected NFP report. Overall, the data wasn’t as bad as one might think by just looking at the reaction but given that we were positioned for a strong report and the pricing got more hawkish after the Fed’s decision, the weaker data was enough to trigger a quick re-pricing.
In fact, the market is now pricing 59 bps of easing by year-end compared to just 35 bps before the NFP release. That’s a pretty quick change of heart. Over the weekend, we have Fed’s Williams opening the door for a cut in September and yesterday, Fed’s Daly echoed such sentiment. The NFP clearly made them a bit more worried, and a September cut is now basically a done deal.
It’s highly likely that more benign data will see Fed Chair Powell opening the door for a cut in September at the Jackson Hole Symposium.
On the EUR side, we haven’t got anything new in terms of fundamentals after the US-EU trade deal that set tariffs at 15%. Many ECB members are now taking a much more neutral approach to rate cuts. They will need significant negative data to force them to cut further. The market is pricing just 14 bps of easing by year-end, so another rate cut has basically a 50% chance of happening.
EURUSD Technical Analysis – Daily Timeframe
EURUSD Daily
On the daily chart, we can see that we have a key resistance around the 1.1575 level. This is where the sellers are stepping in with a defined risk above the level to position for a drop into the 1.1065 level next. The buyers, on the other hand, will want to see the price breaking higher to increase the bullish bets into a new cycle high.
 August 5, 2025 at 12:09 pm #28435
USDJPY Analysis – Soft NFP led to a quick change of heart
Fundamental OverviewThe USD sold off across the board on Friday following a softer than expected NFP report. Overall, the data wasn’t as bad as one might think by just looking at the reaction but given that we were positioned for a strong report and the pricing got more hawkish after the Fed’s decision, the weaker data was enough to trigger a quick re-pricing.
In fact, the market is now pricing 59 bps of easing by year-end compared to just 35 bps before the NFP release. That’s a pretty quick change of heart. Over the weekend, we had Fed’s Williams opening the door for a cut in September and yesterday, Fed’s Daly echoed such sentiment. The NFP clearly made them a bit more worried, and a September cut is now basically a done deal.
It’s highly likely that more benign data will see Fed Chair Powell opening the door for a cut in September at the Jackson Hole Symposium.
On the JPY side, we haven’t got anything new since the BoJ left interest rates unchanged and revised inflation forecasts higher as expected at the last meeting. The yen, after some depreciation caused by dovish Governor Ueda’s comments, rallied strongly on the back of the soft NFP report and the dovish repricing for the Fed.
For more JPY appreciation we will need weak US data to increase the dovish bets on the Fed or higher inflation figures for Japan to price in more rate hikes than currently expected. Other potential positive driver could be signs of more fiscal support as that will likely put upward pressure on inflation.
USDJPY Technical Analysis – Daily Timeframe
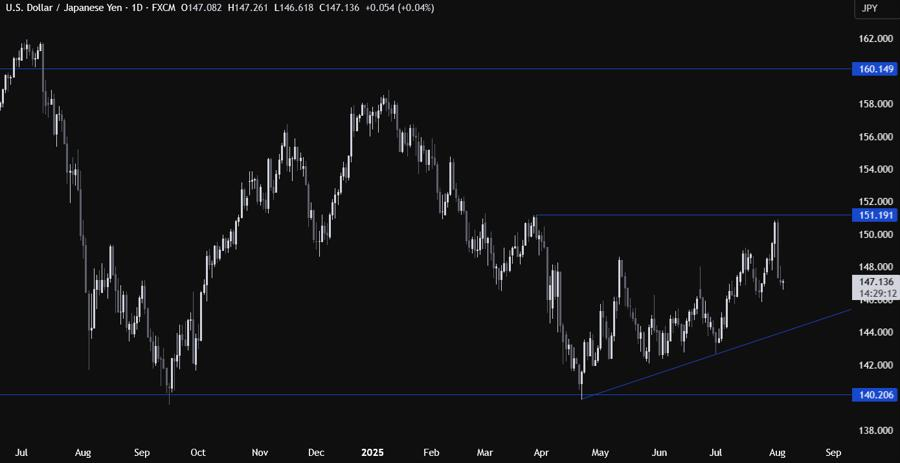
USDJPY Daily
On the daily chart, we can see that USDJPY eventually sold off from the key resistance zone around 151.00 handle. The target for the sellers should be the major trendline around the 144.50 level. That’s where we can expect the buyers to step in with a defined risk below the trendline to position for a rally back into the resistance.
 August 5, 2025 at 12:06 pm #28434
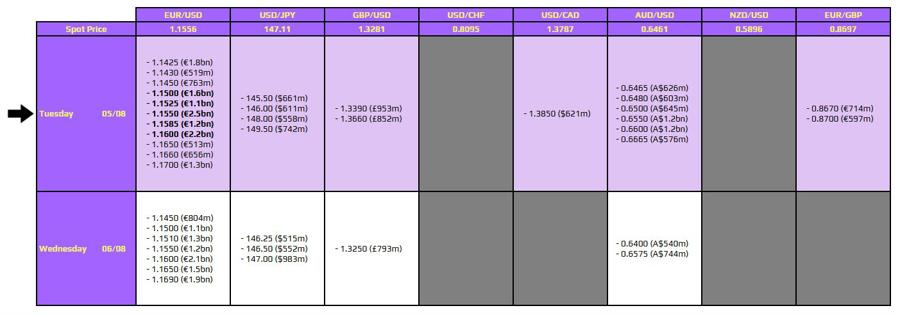
FX option expiries for 5 August 10am New York cut
There are just a couple to take note of on the board for the day, as highlighted in bold below.
They are all for EUR/USD layered in between the 1.1500 to 1.1600 mark. And the expiries are also resting in and around the 100 and 200-hour moving averages, seen at 1.1499 and 1.1589 respectively. As such, price action will have more reason to continue to track in between the two key hourly moving averages in European trading.
That before we get to US trading where the ISM services PMI might offer something for traders to act upon.
 August 5, 2025 at 12:03 pm #28433August 5, 2025 at 11:20 am #28432August 5, 2025 at 11:16 am #28431August 5, 2025 at 10:48 am #28430August 5, 2025 at 10:37 am #28429August 5, 2025 at 10:31 am #28428
ISM Services PMI due today… watch the headline and the jobs component.
See our Economic Data Calendar
 August 5, 2025 at 10:30 am #28427August 5, 2025 at 10:26 am #28426
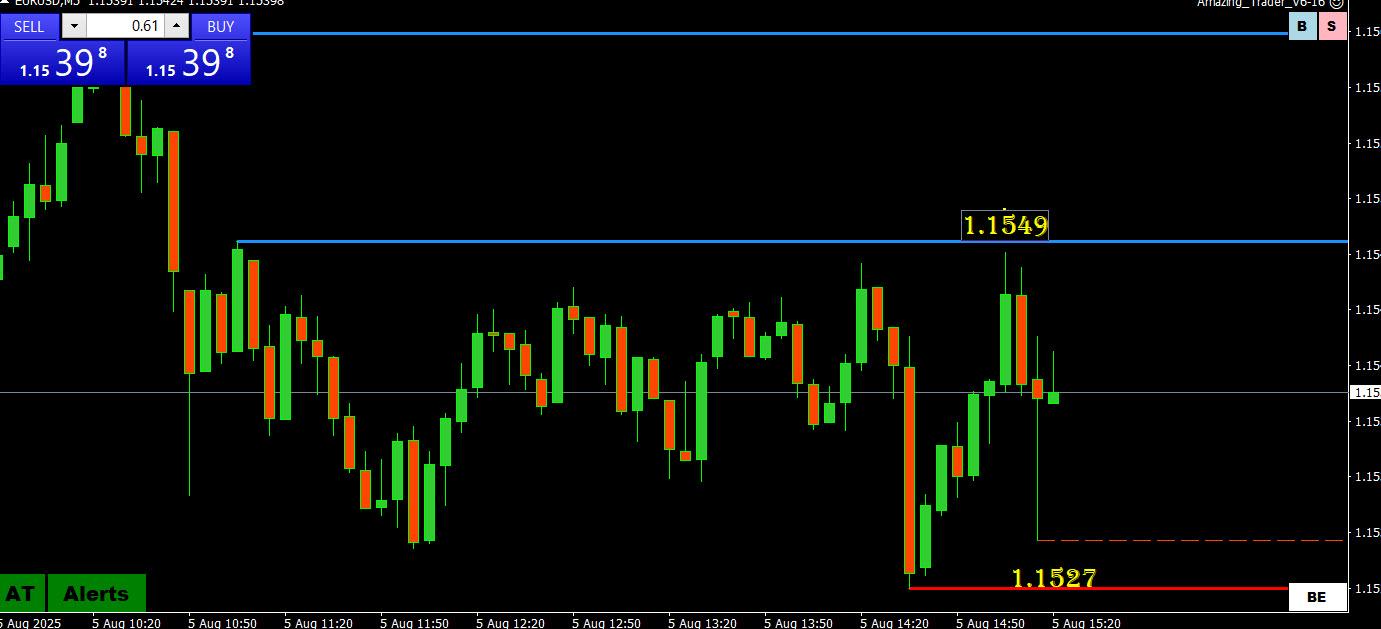
euro 1.1535
–
EU will delay planned U.S. tariffs for six months to allow for trade talks…”the Commission will take the necessary steps to suspend by 6 months the EU’s countermeasures against the US, which were due to enter into force on 7 August.”
The pause on the countermeasures is expected to formally take effect Tuesday.
August 5, 2025 at 10:07 am #28423August 5, 2025 at 10:04 am #28422August 5, 2025 at 9:34 am #28421August 5, 2025 at 9:22 am #28420Using my platform as a Heatmap shows…
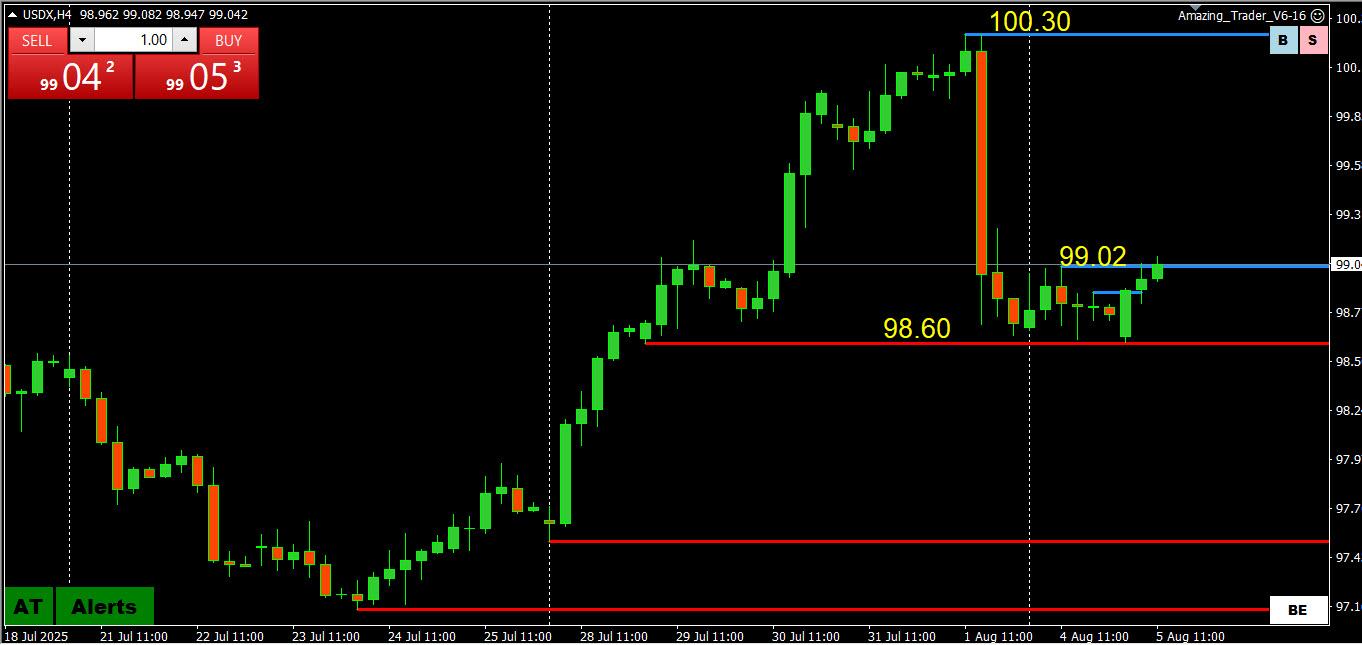
… the dollar trading modestly in firmer after failing to follow through to the downside to start the week
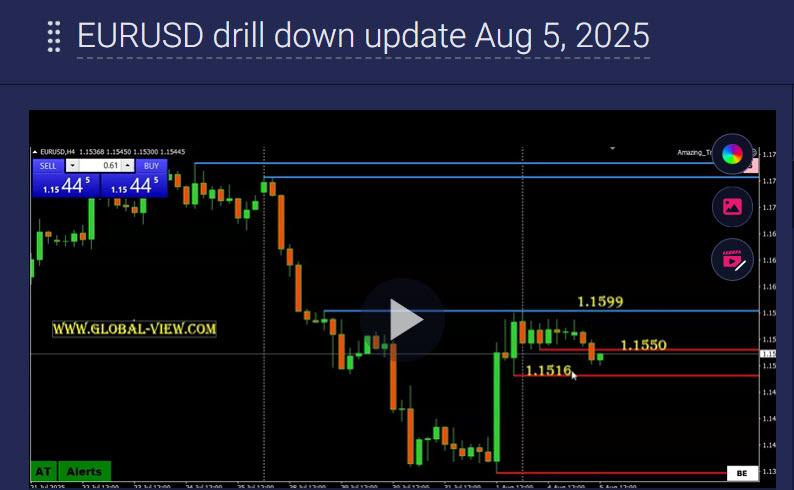
EURUSD haz dipped back below 1.1550
USDJPY bounced 1 JPY after extending its low to 146.61 in early trade but remains below 148
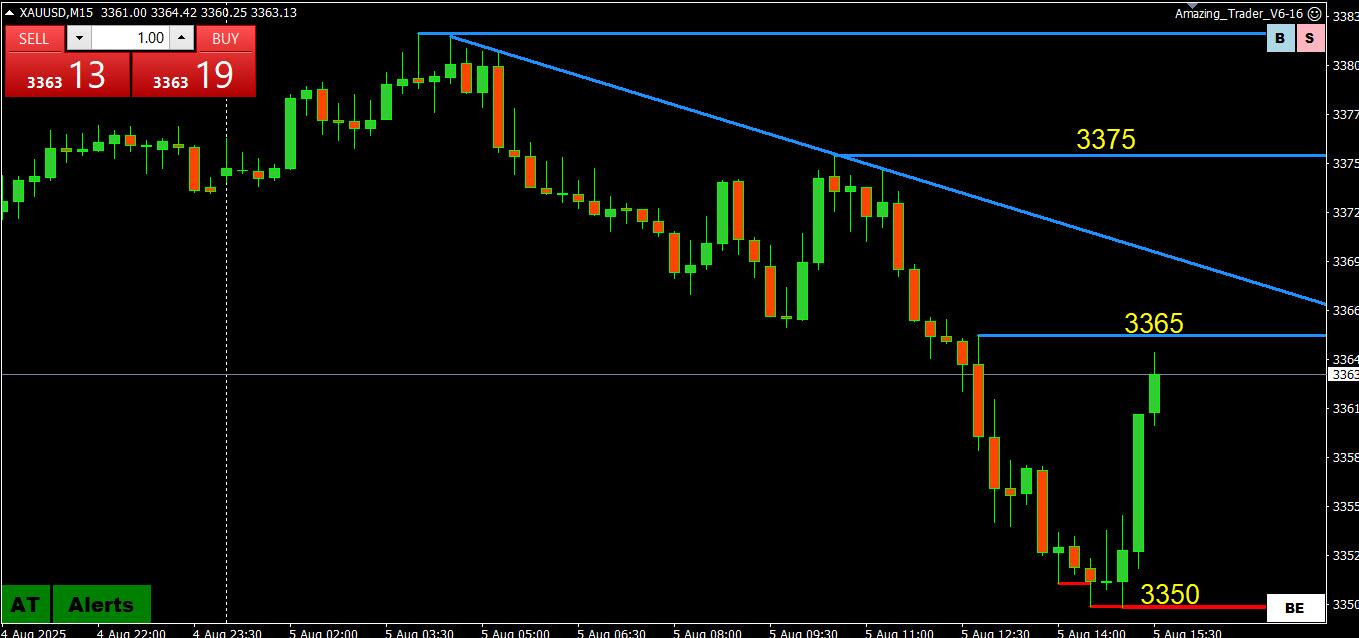
Gold is has backed off after extruding its high yesterday
US stocks are consolidating after yesterday’s rebound
US bond yields are steady at lowef levels
News algos are itching for a market moving headline. ISM Services PMI due today.
 August 5, 2025 at 9:06 am #28419
Slow dollar recovery in the absence of any fresh news.
2 days to the August 7 day when Trump tariff rates become effective.
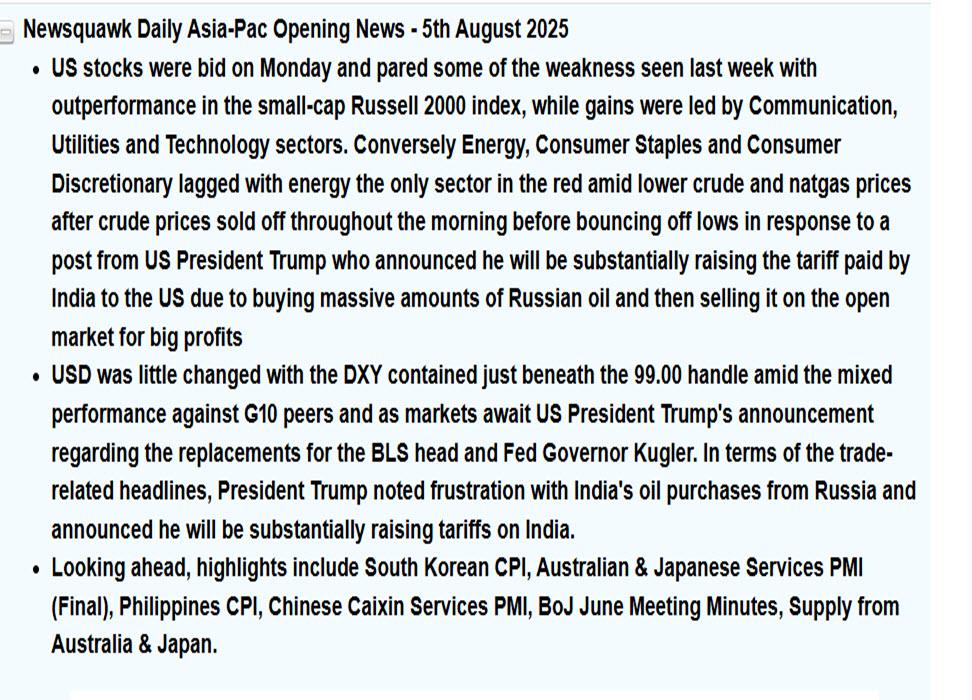
New tariff threat to India over buying Russian oil.
Trump’s 10-12 day threat issued to Russia on July 28 to stop the fighting in Ukraine comes due on Aug7-9. Another Taco?
Don’t be complacent!
August 5, 2025 at 12:24 am #28418August 5, 2025 at 12:19 am #28417USDCHF
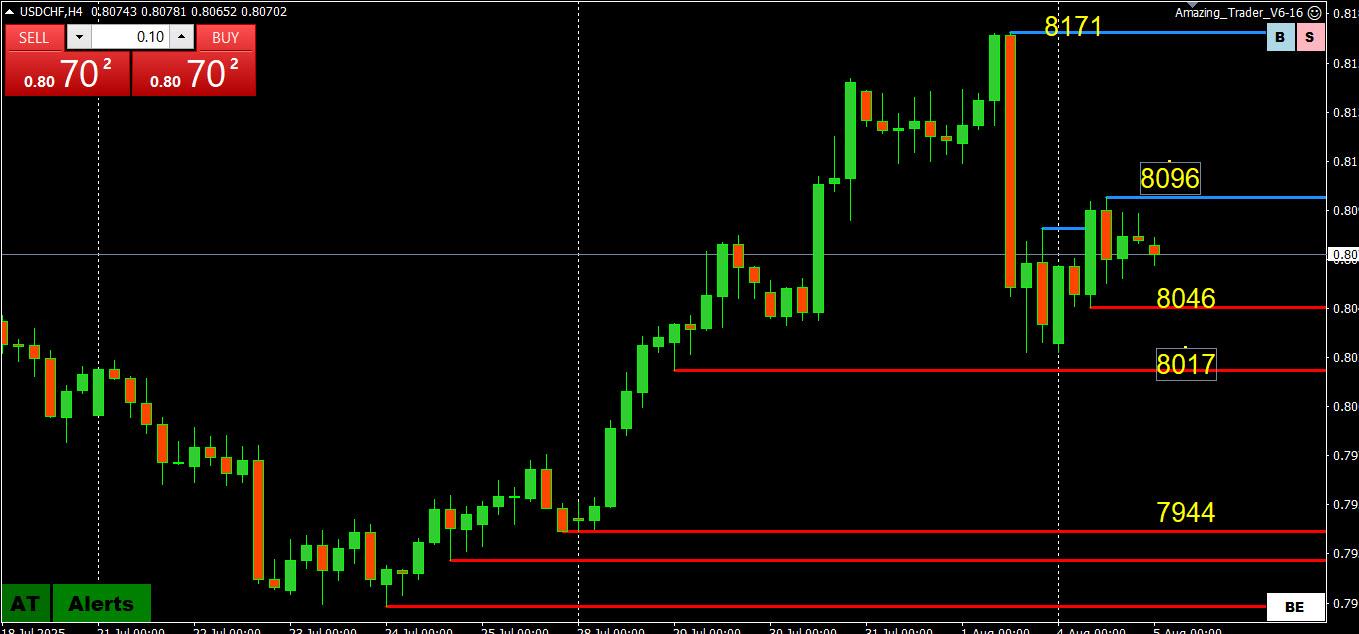
Came within 2 pips of a 50% retracement, now a key level on top (,8096-00)
.8000-17 is potentially at risk.IF .8100 holds on top and 8046 is broken.
On the other side, if 8046 holds and 8100 is broken, more scope on the upside,
Stay alert: Report that Switzerland is ready to make a “more attractive offer” in trade talks with the US ahead of Aug 7 when a 39% tariff kicks in.
USDCHF 4 HOUR CHART
 August 4, 2025 at 10:03 pm #28416August 4, 2025 at 9:31 pm #28415
Palantir Technologies Inc. – PLTR
Palantir Stock Jumps. Earnings Blew Past Wall Street’s Stratospheric Expectations.
Data company Palantir Technologies blasted past the sky-high expectations for its second-quarter earnings report. Continued strength in U.S. sales is driving revenue growth and profitability.Shares are up 2.4% in after-hours trading. They closed Monday 4.1% higher at a new all-time high, according to Dow Jones Market Data.
Palantir did everything perfectly chart wise – sharp Uptrend channel support at 151.05 provided a footing for strong spike up and stock hit the new all time high at 161.40.
But what happened after trade hours is what’s worth mentioning…
It sky rocketed straight to 166.80 and pushes even more…
That sharp Uptrend channel is targeting 195.50 right now – in a week or two that is.
Most important Support comes now at 156.50
 August 4, 2025 at 9:21 pm #28414
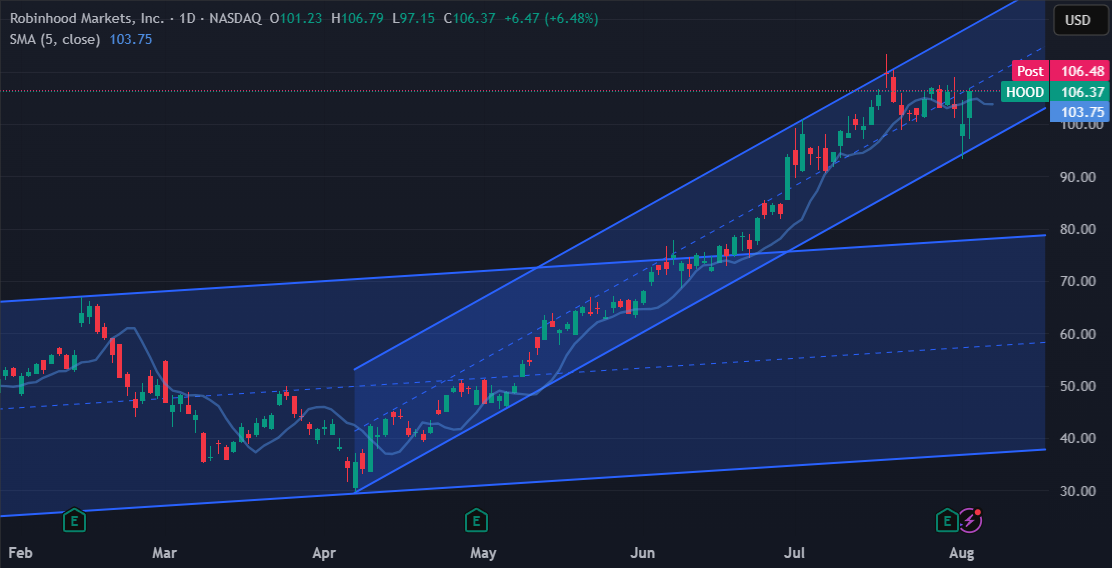
Robinhood Markets Inc. – HOOD
Robinhood Markets Is Maintained at Neutral by Citigroup
Robinhood Markets Price Target Raised to $120.00/Share From $100.00 by CitigroupRobinhood Markets Is Maintained at Overweight by Barclays
Robinhood Markets Price Target Raised to $120.00/Share From $102.00 by BarclaysSo Big guys are calling for 120.00 – what we should expect?
Current pattern calls for higher tomorrow, but there are two important Resistances above the head:
109.05 & 113.45
If Hood takes them both, I can see it rallying to 120.00 as well – even slightly higher – about 121.20
Supports that need to hold for this scenario to unfold are:
104.55 & 99.95 in next couple of days.
 August 4, 2025 at 9:12 pm #28413
Advanced Micro Devices Inc. – AMD
AMD Q2 Earnings Loom–Should You Buy, Hold, or Sell?
AMD will be a highlight of this week’s earnings lineup, with the chip leader set to release its Q2 report after-market hours on Tuesday, August 5.
Chart wise it is now a question of breaking above the previous high at 182.50
To be able to do so, supports at 173.55 & 169.90 must hold in coming days.
Loss of those two would lead AMD towards 150.00
 August 4, 2025 at 9:04 pm #28412August 4, 2025 at 7:32 pm #28411
NAS100 (NASDAQ)
Is the low in or just a retracement after the strong bounce off Friday’s low
Jury is out with little in the way of obvious resistance so use FIBOS as potential levels (scroll below)
Those hoping the low is in need 22843 (red AT line) to hold to keep those hopes alive.
NAS100 4 HOUR CHART
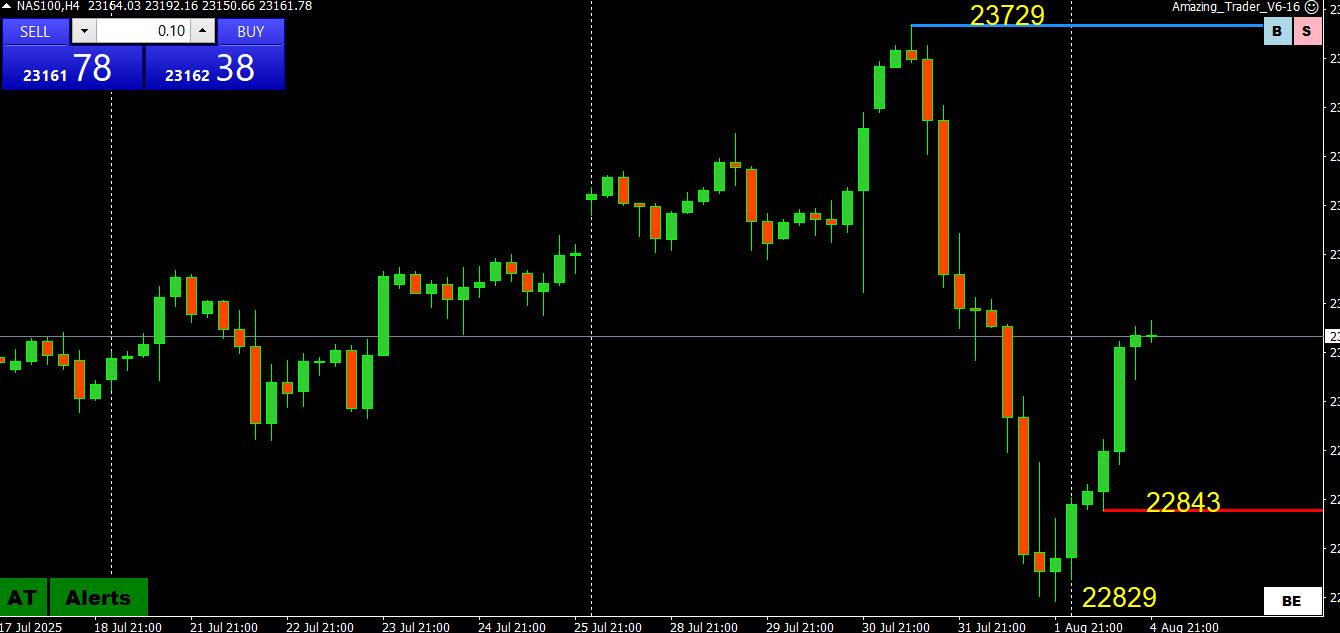
FIBOS for 23729 => 22829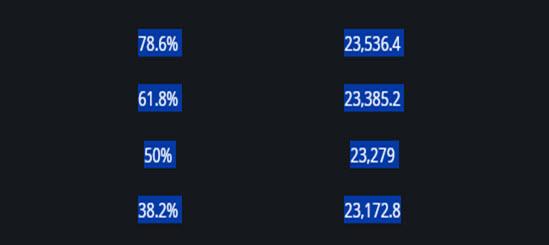 August 4, 2025 at 7:28 pm #28410
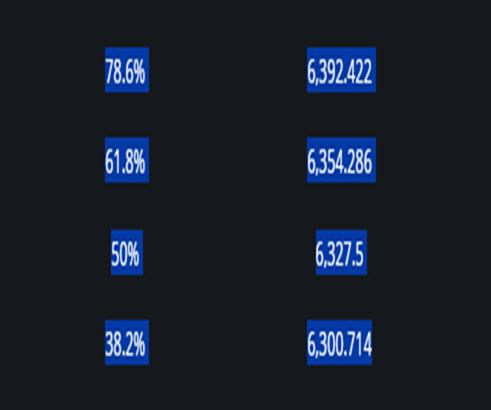
US500 (SP500)
Is the low in or just a retracement?
No obvious resistance after Friday’s freefall so treating the bounce as a retracement, use FIBOS for potential levels (scroll below)
Those hoping the low is in need 6254 (red AT line) to hold to keep those hopes alive.
US500 4 HOUR CHART
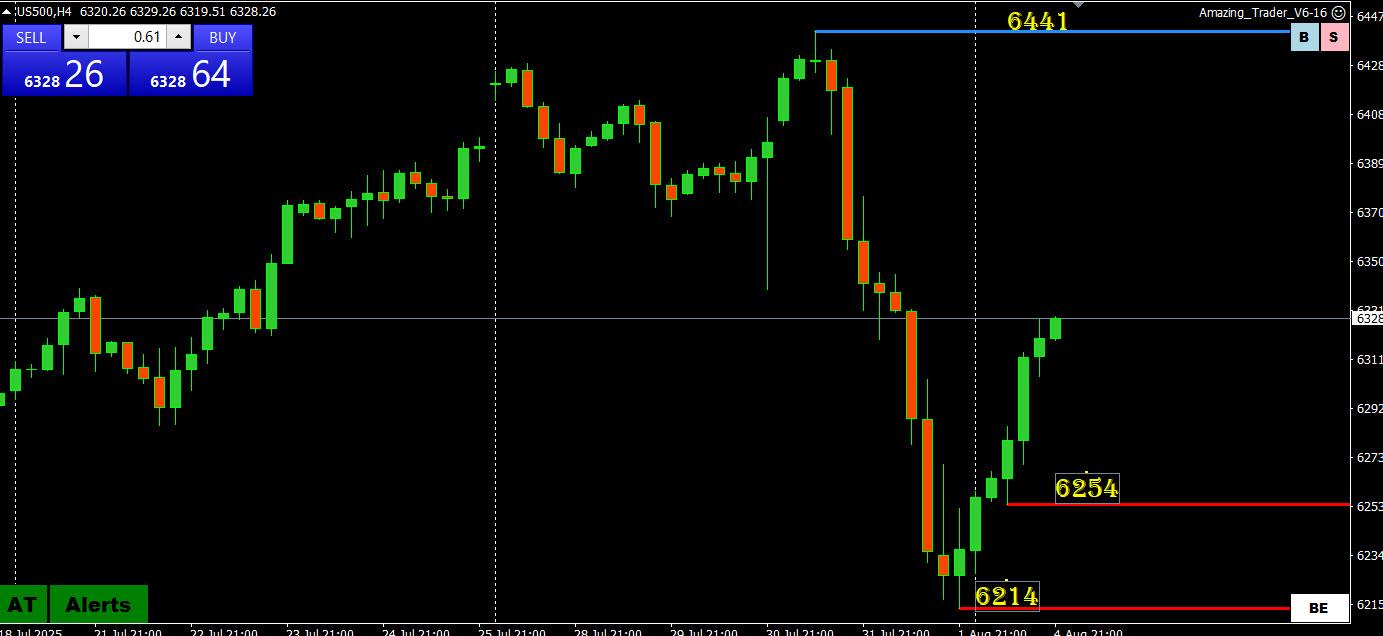
FIBOS for 6441 => 6214
 August 4, 2025 at 7:25 pm #28409
-
AuthorPosts




- You must be logged in to reply to this topic.
Search
© 2024 Global View