
- This topic has 27,907 replies, 54 voices, and was last updated 15 hours, 28 minutes ago by Mtl JP.
-
AuthorPosts
-
August 20, 2025 at 3:13 pm #29329August 20, 2025 at 2:59 pm #29328August 20, 2025 at 2:56 pm #29327
“Pressure campaign against Powell and the Fed does not inspire confidence”
not inspire confidence in what pray tell
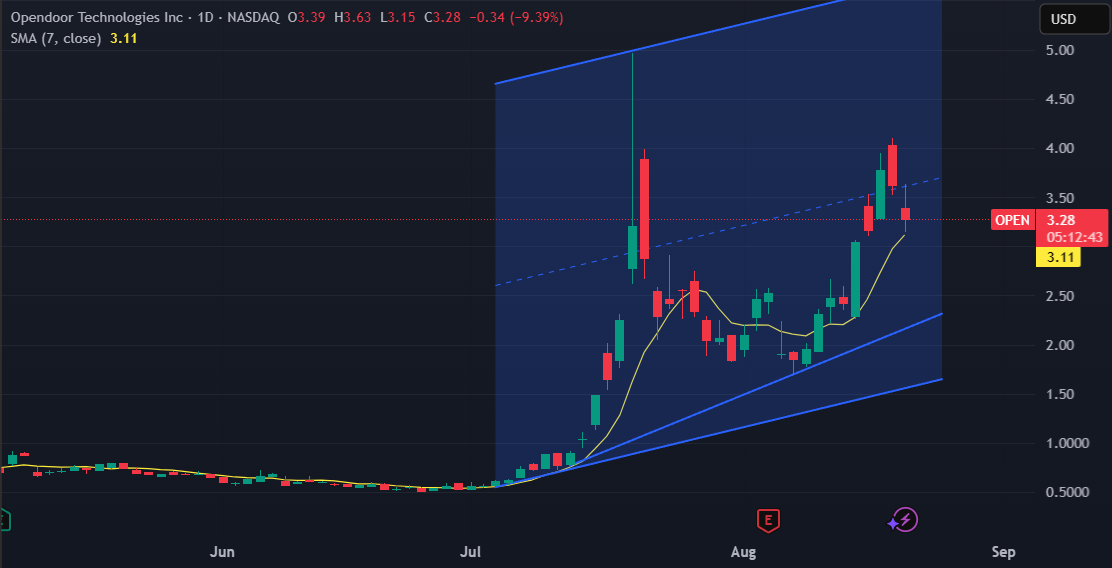
— everyone knows this clown is done. Winners, just like authentic contestants, know when to leave the podium after their act is done. Jerome is aping the embarassing “stage off” a la biden.August 20, 2025 at 2:52 pm #29326Opendoor Technologies Inc. – OPEN
So – all of us that have been wary of a Pattern Open found itself into were right…
Open’s drop is measurable in percentages in double digits…right now over 9% after a decent rebound from low at 3.15
And that is about first support today
Next support comes at 3.05, followed by 2.90
 August 20, 2025 at 2:46 pm #29325August 20, 2025 at 2:40 pm #29324August 20, 2025 at 2:35 pm #29323
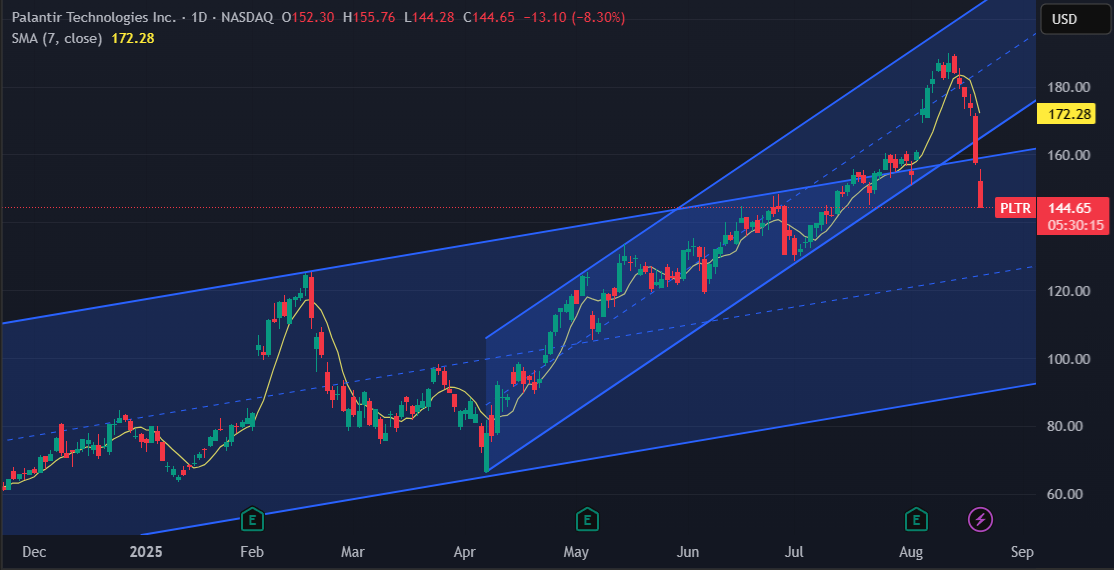
Palantir Technologies Inc. – PLTR
Once it closed last night below 160.00 it was clear bad things are going to happen…
So today seems as Palantir is leading the Nasdaq pack in diving competition
So far Down over 8%
Supports: 140.05, 133.65 & 125.40
If the last one lost, we won’t be seeing levels above 160.00 for quite some time…
 August 20, 2025 at 2:28 pm #29322August 20, 2025 at 2:20 pm #29321
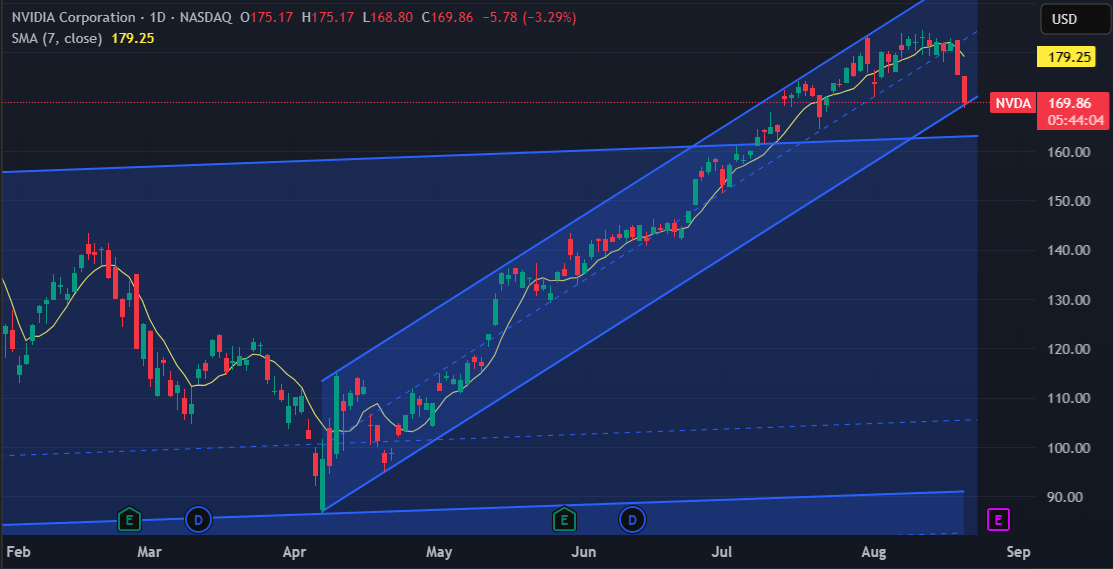
Nvidia – NVDA
The dive continued
168.80 – last support that can secure a continuation of the Uptrend.
If lost, next target sits at 162.85 – channel trendline – separates Nvidia from a possible doom – as it opens a gate for levels as low as 90.00
I am not saying that is going to happen – just giving a fair warning
 August 20, 2025 at 2:17 pm #29320August 20, 2025 at 2:05 pm #29319August 20, 2025 at 1:58 pm #29318August 20, 2025 at 1:57 pm #29317August 20, 2025 at 12:52 pm #29316
Pressure campaign against Powell and the Fed does not inspire confidence
 August 20, 2025 at 12:48 pm #29313
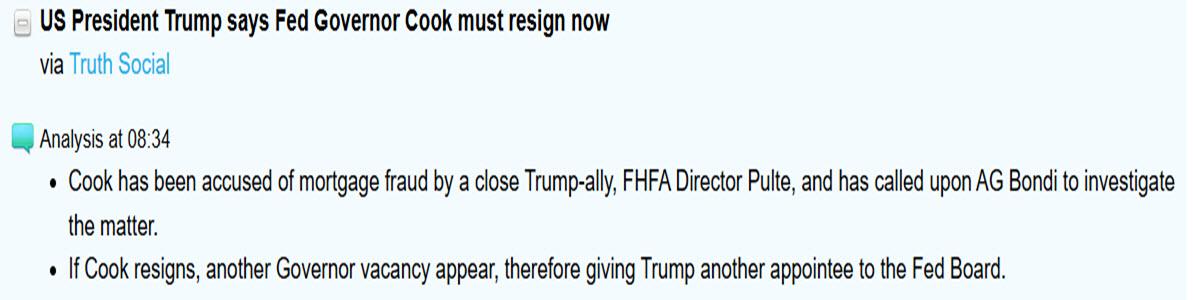
A close ally of former President Trump has urged Florida Attorney General Pam Bondi to investigate Federal Reserve Governor Lisa D. Cook over alleged mortgage fraud. Specifically, the Federal Housing Finance Agency (FHFA) Director Bill Pulte sent a letter (dated August 15, 2025) suggesting that Cook may have “falsified bank documents and property records to acquire more favorable loan terms,” potentially amounting to criminal mortgage fraud
August 20, 2025 at 12:42 pm #29312August 20, 2025 at 12:06 pm #29311August 20, 2025 at 12:06 pm #29310August 20, 2025 at 11:43 am #29309August 20, 2025 at 11:02 am #29308EURUSD
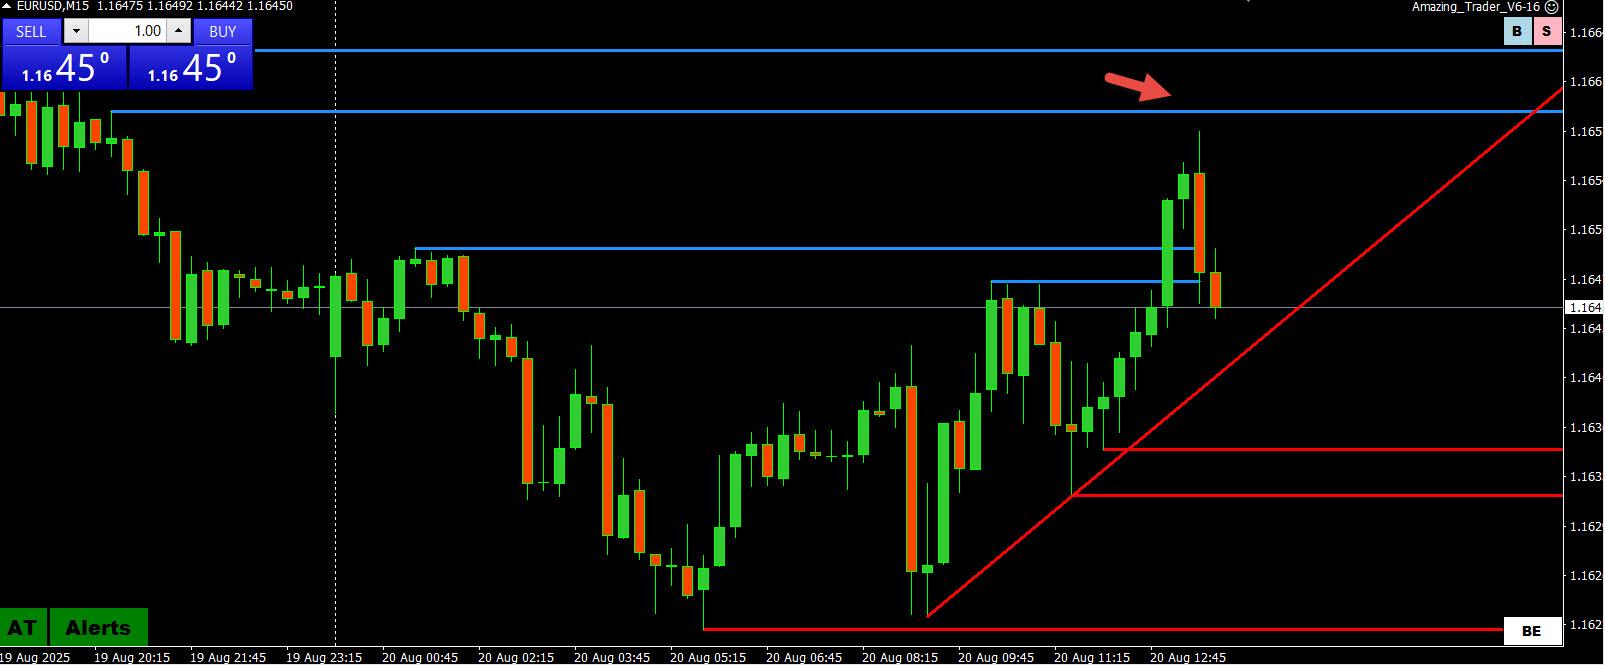
The Amazing Trader (AT) always shows levels to trade
In this case, treating EURUSD bounce as a retracement, 15 minute chart showed resistance at 1.1659 vs the 1.16575 high.
Of course it is up to the trader to decide whether to trade and easy to say in hindsight but recognizing that EURGBP was driving demand made it a good risk/reward with AT providing a level to trade..
EURUSD 15 MINUTE CHART
 August 20, 2025 at 10:44 am #29307August 20, 2025 at 10:29 am #29304August 20, 2025 at 10:01 am #29303August 20, 2025 at 9:51 am #29300
UK CPI (out earlier)
UK CPI annual inflation rate picked up 3.8% vs 3.6% in June, highest since January 2024. Core inflation rate also unexpectedly rose to 3.8% from 3.7% in June.
Data continues recent trend of upside surprises and raised talk the BOE may reluctant to cut rates again this year.
GBPUSD 1 HOUR CHART
 August 20, 2025 at 9:46 am #29299
USDX
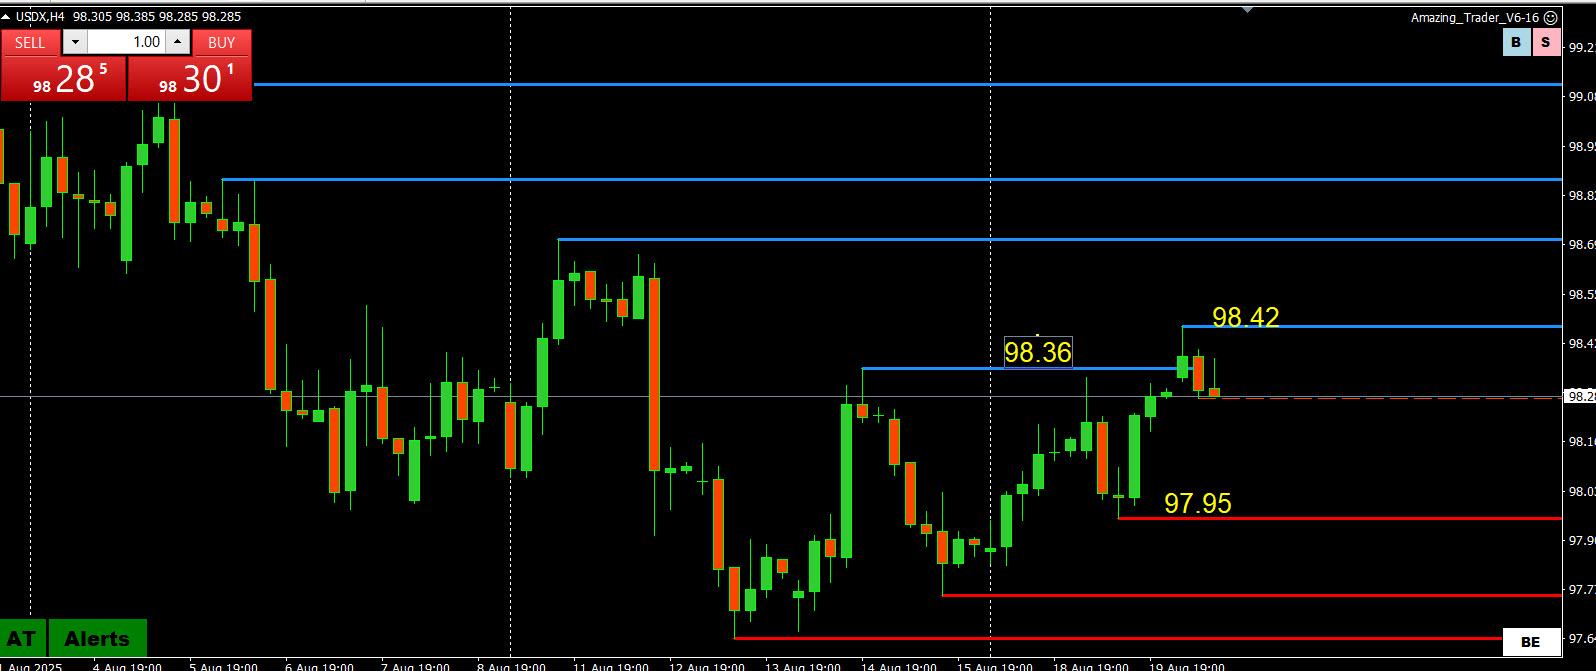
Breakout through 98.36 not following through (high 98.42) after EURUSD (57.6% of the index) break of 1.1631 (low 1.1622) did not last as well.
EURUSD would at least need to regain 1.1650 for more pressure on the USDX downside.
Key focus is more on US stocks after the tech led selloff yesterday.
FOMC minutes out later will be closely watched ahead of the highly anticipated Powell speech at Jackson Hole on Friday.
USDX 4 HOUR CHART
 August 20, 2025 at 9:35 am #29298August 20, 2025 at 9:18 am #29297
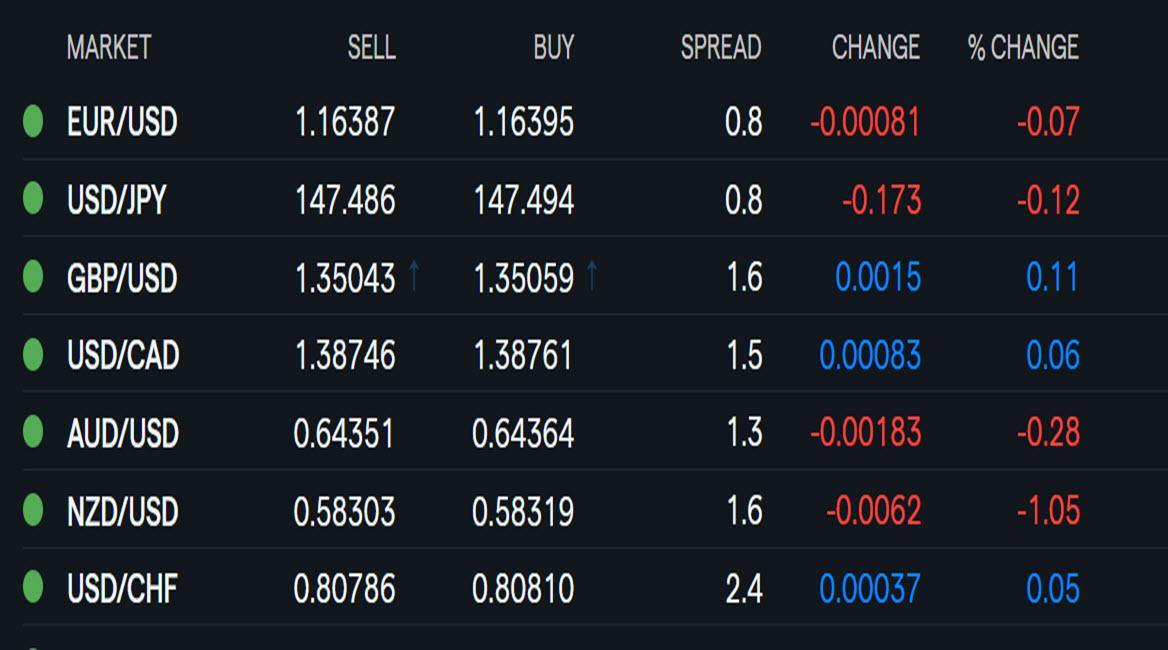
Using my platform as a HEATMAP shows,,,
.. the dollar holding firm with only small net changes except vs the NZD and lesser extent the AUD.
GBP getting some support from hotter CPI while the NZD is at the bottom of the list after an expected 25bps rate cut and indications there may be more to come.
1. JPY
2. GBP
3. CAD
4. CHF
5. EUR
6. AUD
7. NZD
 August 20, 2025 at 3:15 am #29296
Solana Price Setup Hints at Breakout Rally Toward $268
• Solana retests $185–$190 resistance, with breakout targets at $205, $225, and $268 on charts.
• SOPR reading below 1 shows selling at a slight loss, signaling consolidation after a rally above $200.
• Whale wallets above 10,000 SOL hit record highs as the network briefly peaks at 107,540 TPS.Solana (SOL) traded at $182 at press time, recording a minor daily rise while holding a 4% gain over the past week. Daily trading volume reached $5.22 billion.
Meanwhile, the daily chart shows Solana building an ascending triangle pattern. The asset has respected an upward trendline while testing resistance at $185–$190 several times.
Solana is retesting the upper boundary resistance again after previous fake out on the daily chart.
A confirmed bounce from this zone could validate the bullish structure and send the price toward targets at $205, $225, and $268
The resistance holds steady at $185–$190. An upside breakout above this level can pave the way to $205, $225, and $268. Conversely, on the negative end, the ascending trendline at around $165 is also acting as a support zone, in addition to the 100-day moving average (MA100). A break below this level will weaken the existing structure.
Additionally, the Relative Strength Index (RSI) runs in the median range, demonstrating that there is still some upside potential before it can be overbought. The volume data also exhibits better activity during upward moves, which supports the bullish outlook.On-Chain Data and SOPR Reading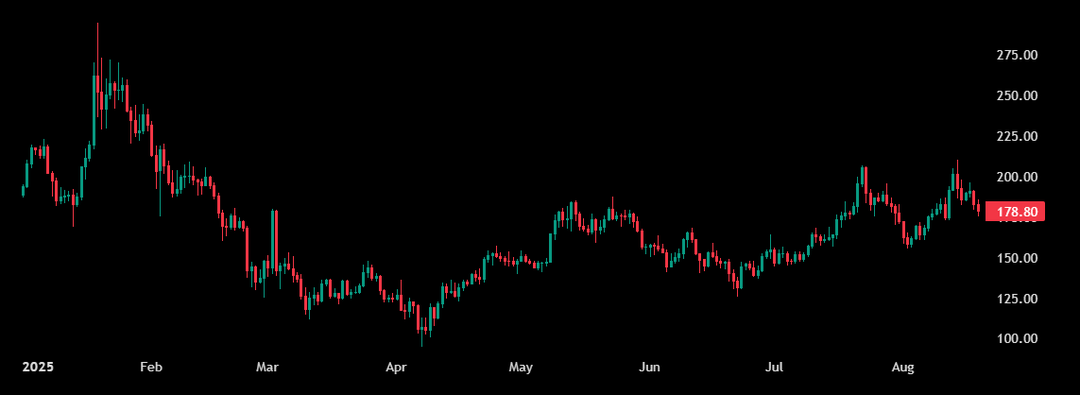 August 20, 2025 at 1:16 am #29295
Ethereum whale opens $16.3M long as ETH price eyes bounce
• ETH price has a short liquidation cluster “magnet” at $4,300–$4,360.
• Ether price technicals support the case for a rally toward $4,750–$8,000. An Ethereum whale has opened a massive $16.35 million long position on Ether ETHUSD, using 25x leverage, in what looks like a bold wager that the latest dip is over.
1% price ETH gain equals $163,000 in profit The position, entered at $4,229.83 per ETH, is already slightly in profit with ETH trading just above $4,240. At this scale, a mere 1% rise from the entry would add over $163,000 in profit.
Fresh liquidation heatmaps support the timing of the whale’s entry.
Data from Kingfisher shows a dense cluster of short liquidations above $4,300–$4,360, with a particularly large pocket near $4,336. Markets are often drawn toward such liquidity “magnets” as market makers hunt stops.
Strategically, this means ETH doesn’t need a full-blown breakout to validate the whale’s trade. A simple push into the $4,336 liquidity pool could generate multimillion-dollar paper gains.
The whale’s position could be up by nearly $450,000 in unrealized profit if ETH hits that level.
On the flip side, a 4.34% drop to around $4,046 would completely liquidate the trade, erasing the margin behind the position.
Did Ether find a local bottom?
Ethereum is also holding firm above its 20-day exponential moving average (20-day EMA; the green wave), a support that has guided the uptrend since July, barring a brief breakdown last month.
ETH could eye an upside target around $4,750, nearly 13% higher from current levels, if the wedge and 20-day EMA fractal play out. A close below $4,140, however, risks invalidating the setup.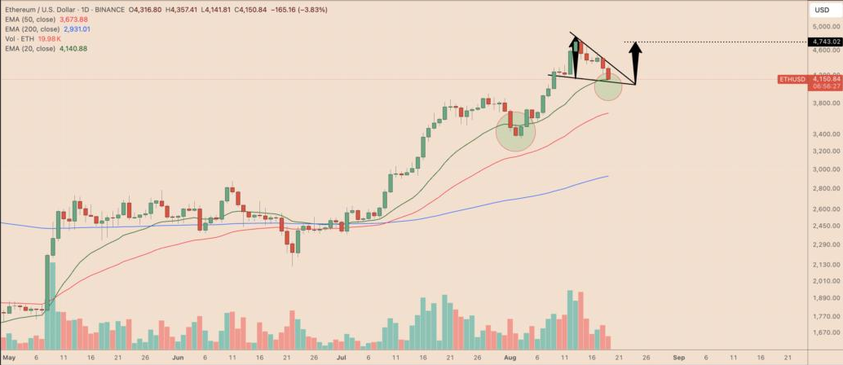 August 20, 2025 at 12:55 am #29294
 -
AuthorPosts




- You must be logged in to reply to this topic.
Search
© 2024 Global View