
- This topic has 28,251 replies, 54 voices, and was last updated 3 hours, 3 minutes ago by GVI Forex 2.
-
AuthorPosts
-
October 21, 2025 at 4:25 pm #32344October 21, 2025 at 2:10 pm #32343October 21, 2025 at 1:57 pm #32342
NAS100 (NASDAQ) UPDATE
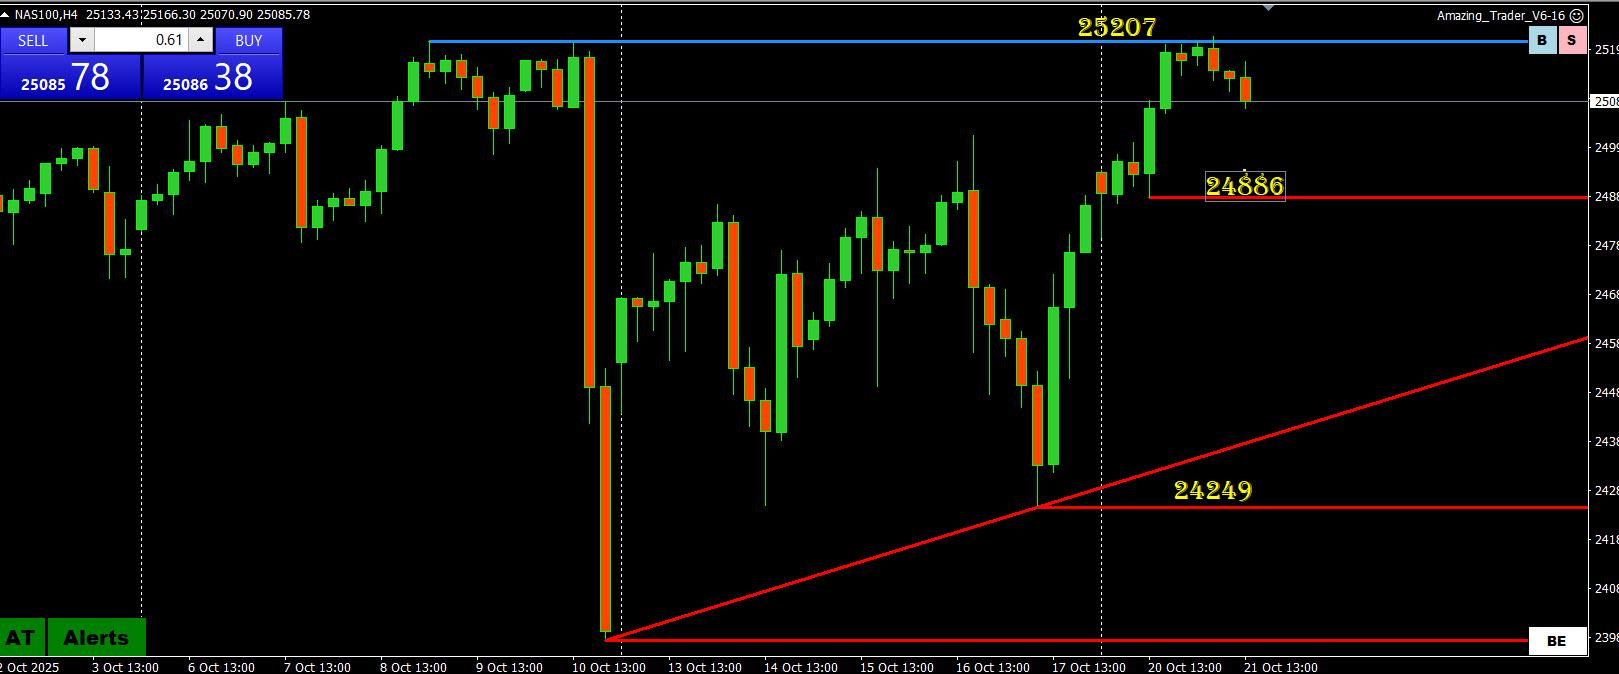
- With GOLD melting down, BITCOIN lower, USD firming, it doesn’t pay to be complacent given unwinding elsewhere, especially with NAS100 bouncing off its record 25207 high.
- 25000 is clearly pivotal with support below it at 24886.
- Key support is the recent 24249 low.
NAS100 1 HOUR CHART
 October 21, 2025 at 1:18 pm #32338October 21, 2025 at 12:56 pm #32337October 21, 2025 at 12:33 pm #32336October 21, 2025 at 12:21 pm #32335October 21, 2025 at 12:20 pm #32334
Bitcoin crash to $104K was ‘flush,’ not crypto cycle ‘failure’
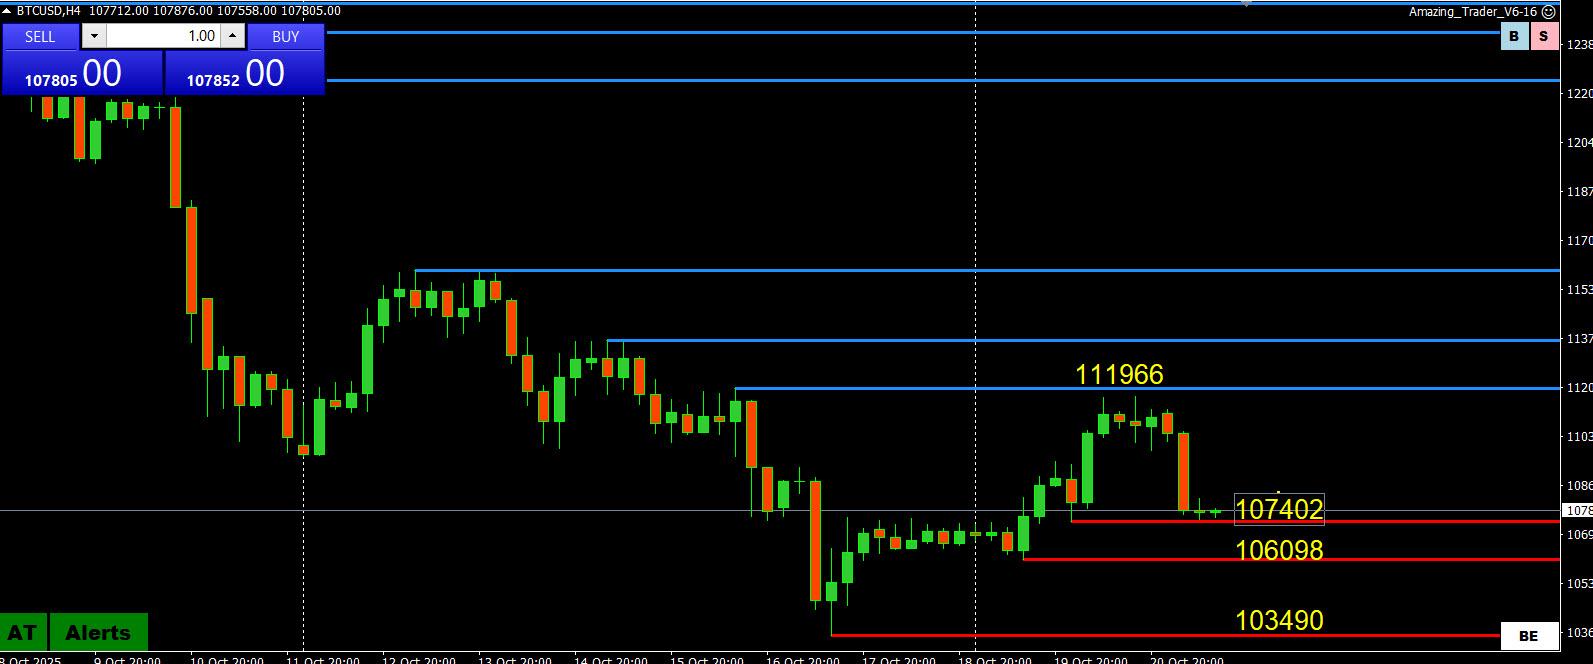
Bitcoin’s four-day drop to $104,000 triggered what analysts call a “defensive rotation” among crypto investors, but onchain data suggests the correction was a healthy reset rather than the start of a broader market crash.
Bitcoin BTCUSD experienced a four-day crash last week, falling from $115,000 on Oct. 14 to a four-month low of $104,000 by Friday, a level last seen in June, TradingView data shows.
Despite the decline, analysts said the correction flushed out excess leverage, prompting investors to shift from chasing gains to protecting capital.In a report Tuesday, blockchain analytics firm Glassnode said short-term Bitcoin holder supply has risen, signaling that “speculative capital” is taking a larger share of the market.
Onchain, the short-term holder supply share continues to rise, suggesting that speculative capital is becoming more dominant
This combination of signals points to a market shifting into protection mode, with traders prioritizing capital preservation over directional bets.”
Meanwhile, Bitcoin’s open interest fell by about 30%, signaling that the crypto market is “far less vulnerable to another liquidation cascade”
 October 21, 2025 at 12:15 pm #32333
USDCAD Technical Analysis: Canadian and US inflation data in focus
Fundamental Overview
The USD strengthened a bit on Friday following some positive Trump’s comments on China as Treasury yields bounced and erased the Thursday’s losses. Overall, the US dollar performance has been mixed as markets have been driven by quick changes in risk sentiment since Trump’s tariffs threat.
On the domestic side, the US government shutdown continues to delay many key US economic reports. The dollar “repricing trade” needs strong US data to keep going, especially on the labour market side, so any hiccup on that front is weighing on the greenback.
The BLS will release the US CPI report on Friday despite the shutdown, so that’s going to be a key risk event. That will need to be seen in the context of US-China relations and any negative shock by that time though. If things go south, then the CPI will not matter much as growth fears will trump everything else.
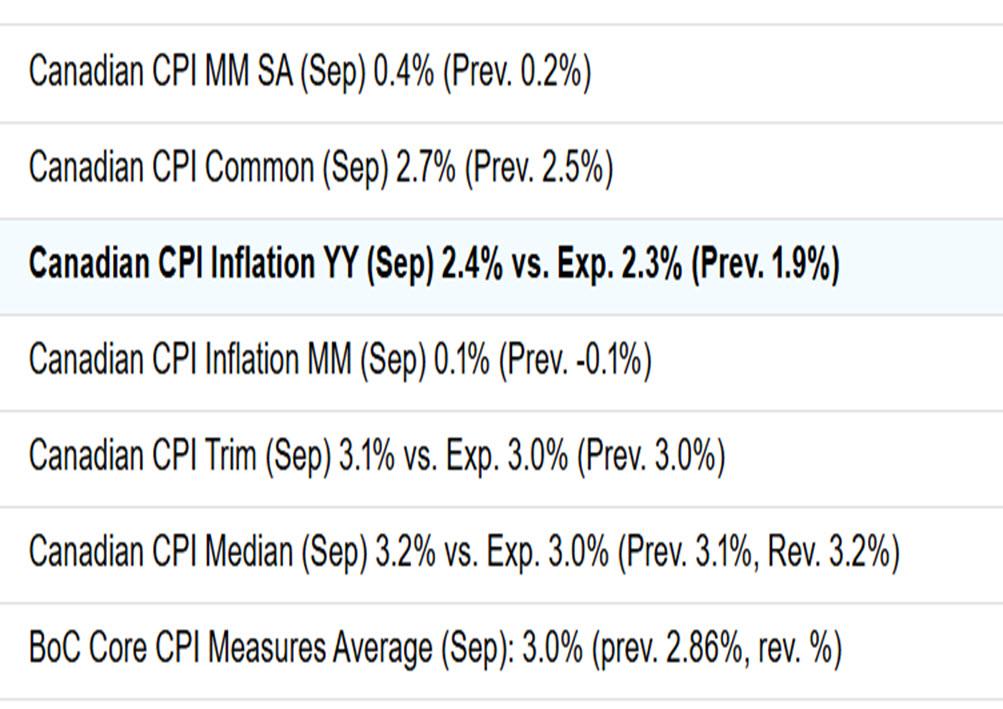
On the CAD side, we got a strong employment report recently which reduced the probabilities for a cut in October to 56%. The risk-off sentiment triggered by Trump and some dovish comments from BoC Governor Macklem last week, increased the probabilities to 86%. It looks like the BoC prefers to cut no matter what in October and bring their policy rate to the lower bound of their estimated neutral rate, but the Canadian CPI data today might still trigger some hawkish repricing in case it surprises to the upside.
USDCAD Technical Analysis – Daily Timeframe
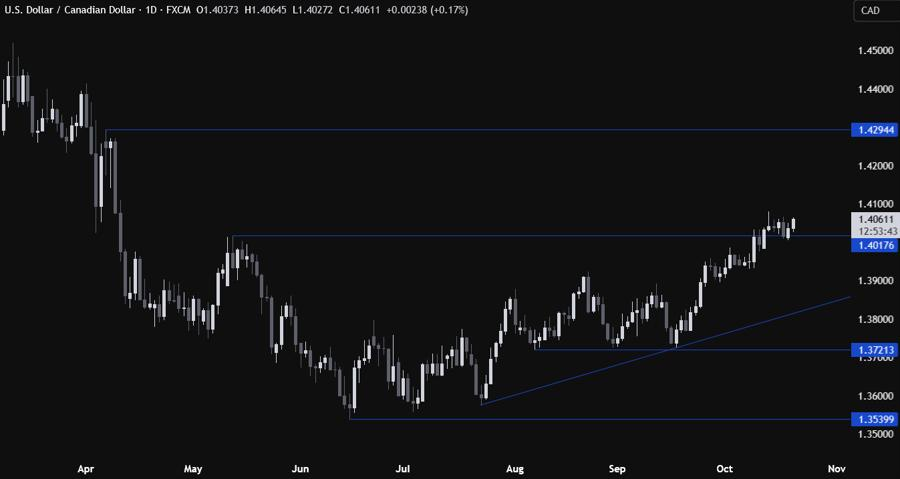
USDCAD daily
On the daily chart, we can see that USDCAD is consolidating above the key 1.4018 level. This is where the buyers are stepping in with a defined risk below the level to position for a rally into the 1.43 handle next. The sellers, on the other hand, will want to see the price falling back below the key level to target a pullback into the major trendline around the 1.3850 level.
 October 21, 2025 at 12:11 pm #32332
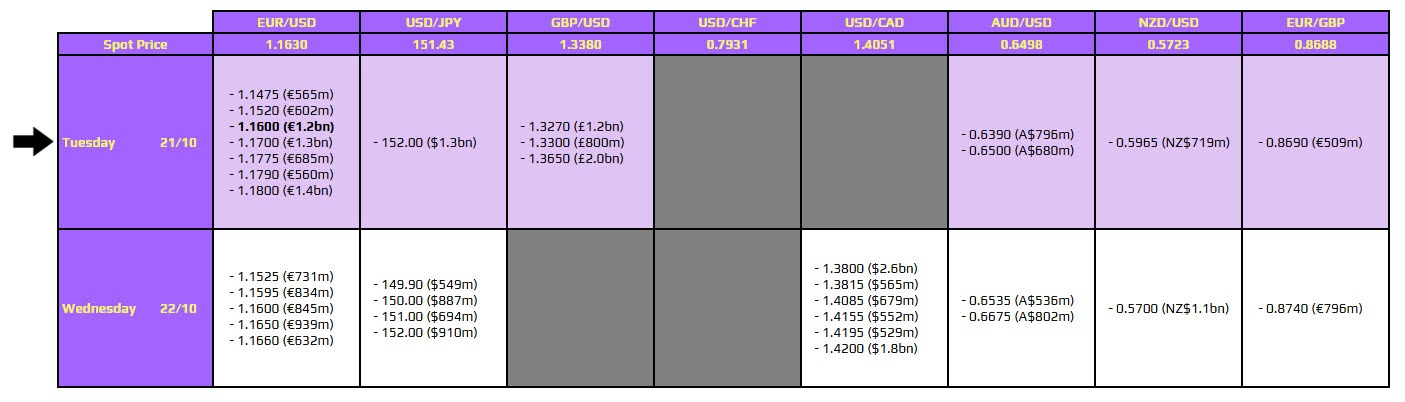
FX option expiries for 21 October 10am New York cut
There is arguably just one to take note of on the day, as highlighted in bold below.
That being for EUR/USD at the 1.1600 level. It isn’t one that ties to any technical significance, so the impact of the expiries might be a bit more muted. The pair is now tussling with key near-term levels, with the downside leaning on the 200-hour moving average of 1.1625. A drop below that will see the near-term bias turn more bearish, so that’s a key level to watch in the session ahead. If so, then only the expiries might factor in to act as a secondary floor to any downside price extensions before we get to US trading.
 October 21, 2025 at 12:10 pm #32331October 21, 2025 at 12:06 pm #32330
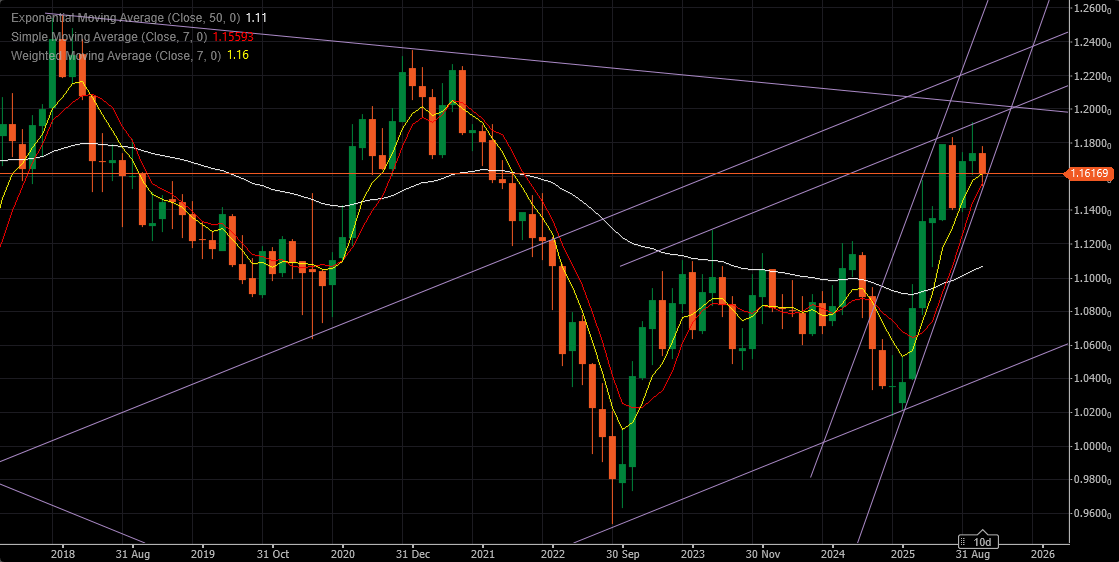
EURUSD Monthly
Supports: 1.16050, 1.15750 & 1.15400
Resistances: 1.16950, 1.17350 & 1.17800
Monthly chart has to be looked upon a bit differently than smaller time frames – Break of Major support ( 1.15400 in this case) would signal a Trend change, but not without possible strong Upticks that should cement the top.
We still have to see what the near future brings, but do not overlook one equally possible outcome:
– If this month closes above 1.17350 EURUSD would still be very Bullish and ready to hit above 1.19200, targeting 1.22500
– However, there is an interesting resistance at 1.20300 that might limit any further upside and in that case EUR would just make an extension to the current Rally.
So for now treat EUR with a caution as it can show its teeth suddenly and without any compassion…
 October 21, 2025 at 11:59 am #32329October 21, 2025 at 11:06 am #32328October 21, 2025 at 10:58 am #32327October 21, 2025 at 10:54 am #32326October 21, 2025 at 10:52 am #32325October 21, 2025 at 10:49 am #32324October 21, 2025 at 10:42 am #32323October 21, 2025 at 10:20 am #32322October 21, 2025 at 10:16 am #32321October 21, 2025 at 9:59 am #32320October 21, 2025 at 9:44 am #32319October 21, 2025 at 9:35 am #32318October 21, 2025 at 9:27 am #32317
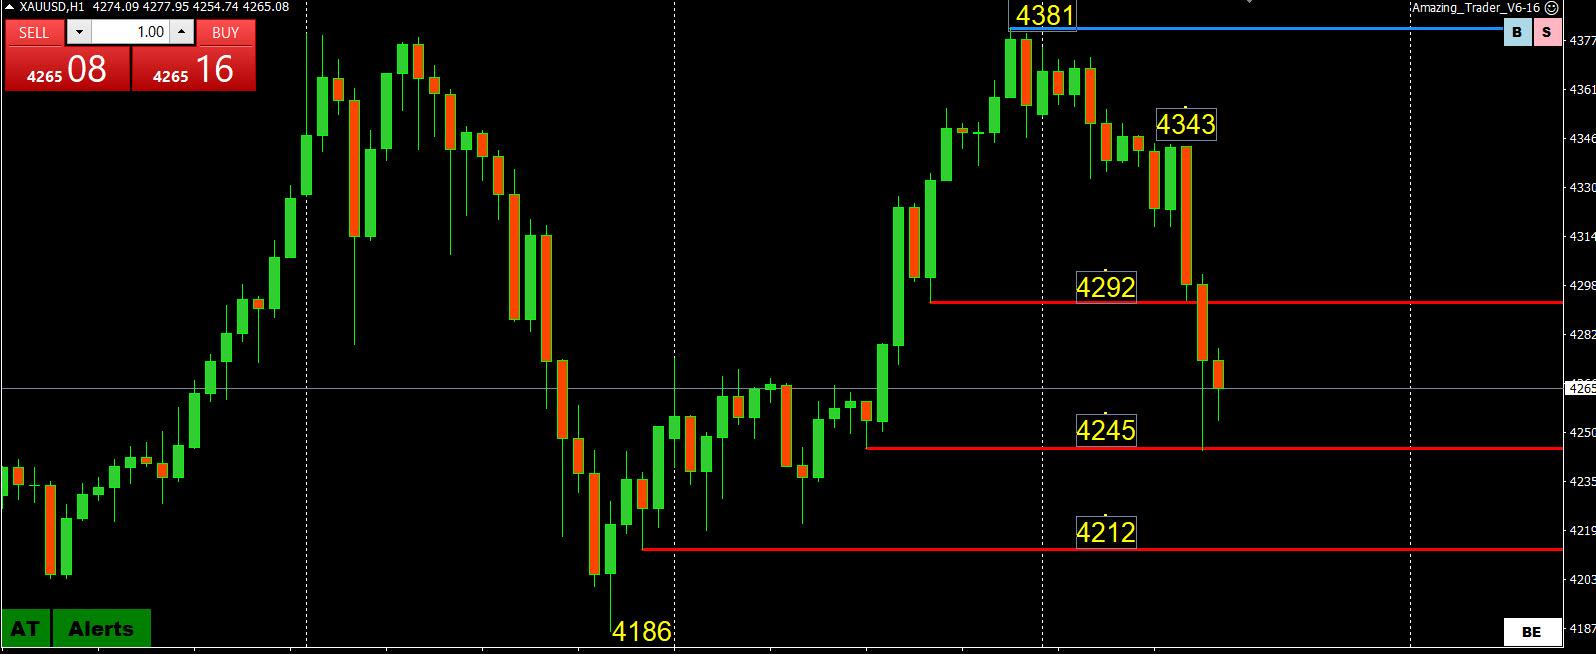
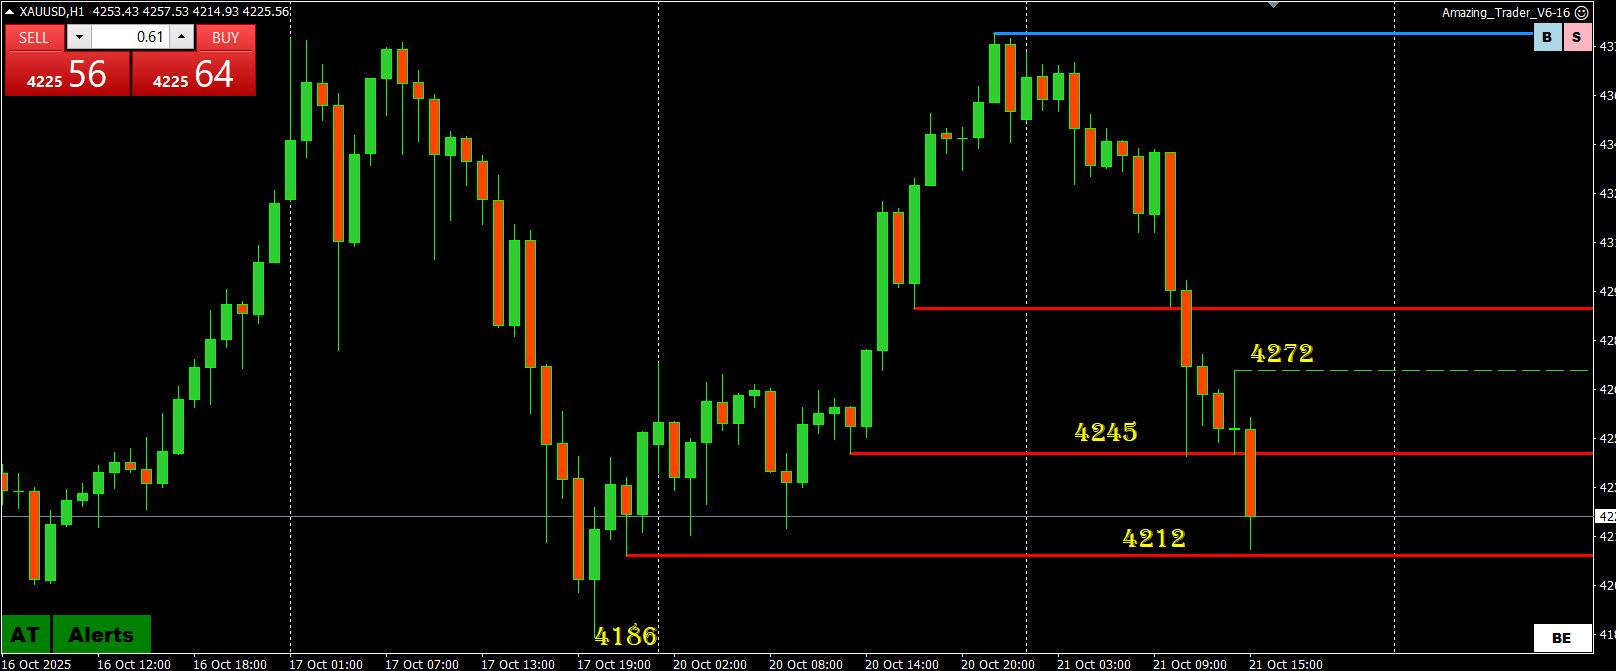
XAUUSD (GOLD) UPDATE
- As I pointed out yesterday the new intra-day record high by just $2 was met with selling and not stops.
- Turned out to be a good clue as what followed was a bout of profit taking where XAUUSD needs to hold 4245 (now a double bottom) to contain the downside.
- Intra-day resistance 4292 and 4343
XAUSD 1 HOUR CHART
 October 21, 2025 at 9:13 am #32316
Forex Market Snapshot
The dollar is trading firmer as part of some general profit taking/book squaring in other markets as well.
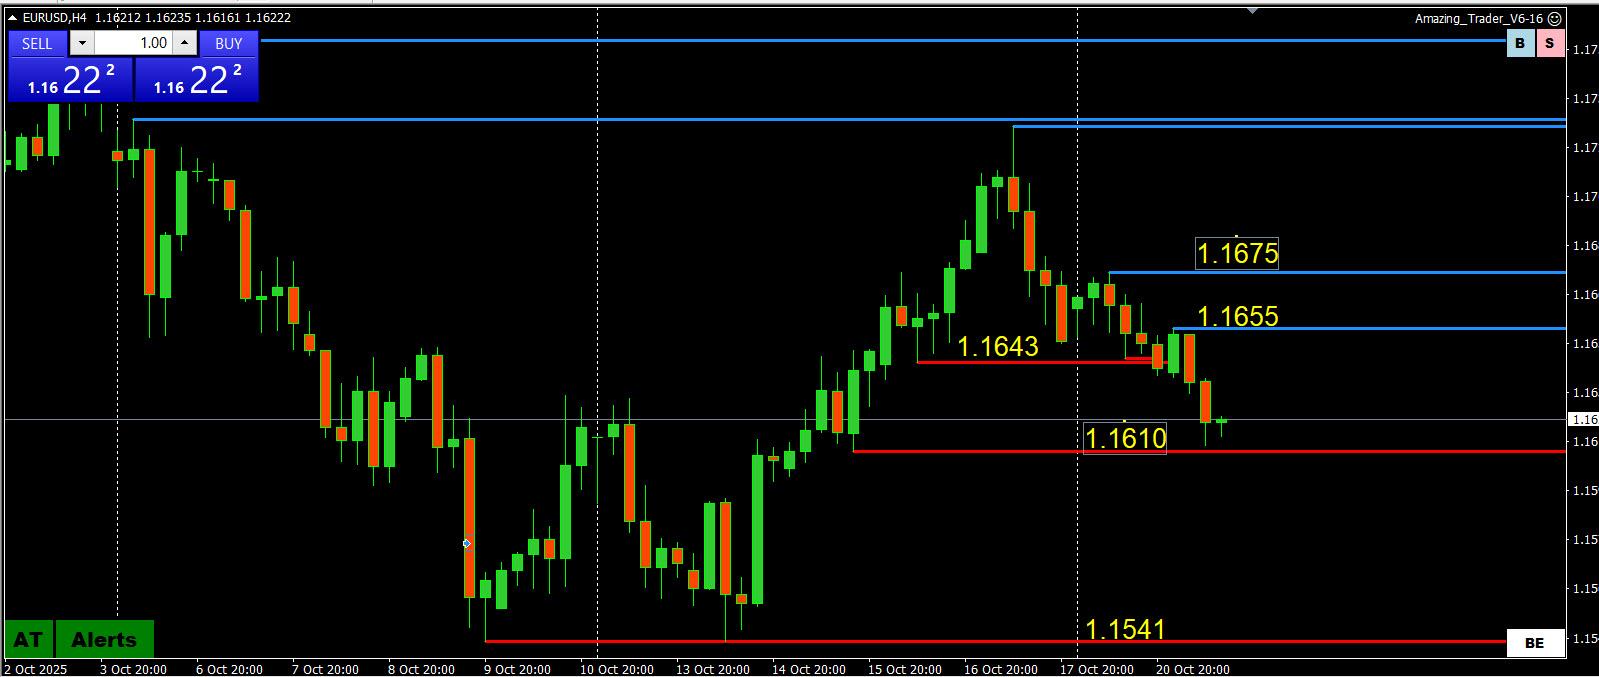
While still in its current ranges some recent dollar highs (e.g. USDCAD. EURUSD should it break 1.1610) are back on the chart radar.
EURUSD 1.1531
GBPUSD 1.3248
USDJPY 153.27
USDCAD 1.4080
USDCHF .8076
AUDUSD .6440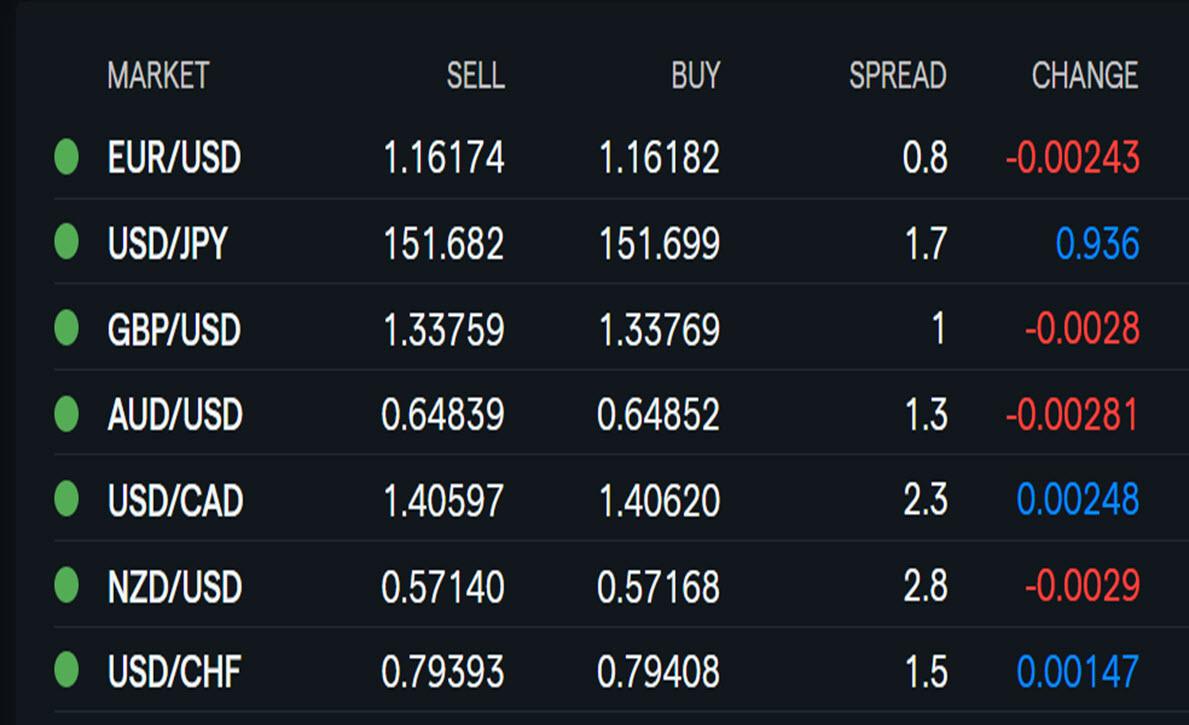 October 21, 2025 at 8:13 am #32315October 21, 2025 at 12:10 am #32314October 20, 2025 at 10:23 pm #32312October 20, 2025 at 8:35 pm #32308
-
AuthorPosts










- You must be logged in to reply to this topic.
Search
© 2024 Global View