
- This topic has 28,428 replies, 54 voices, and was last updated 11 minutes ago by Adam Global.
-
AuthorPosts
-
March 10, 2026 at 9:30 am #37495March 10, 2026 at 9:24 am #37494
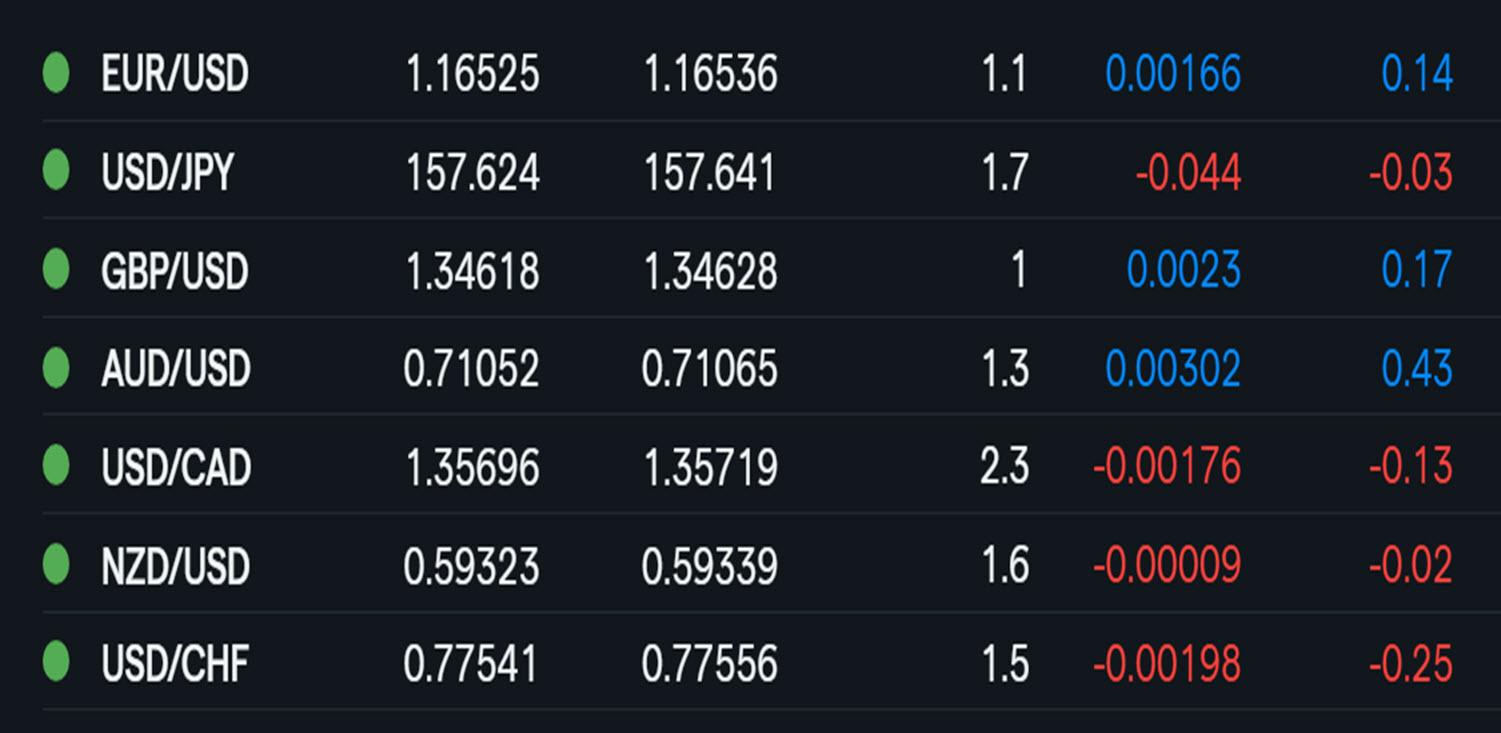
Forex Market Snapshot
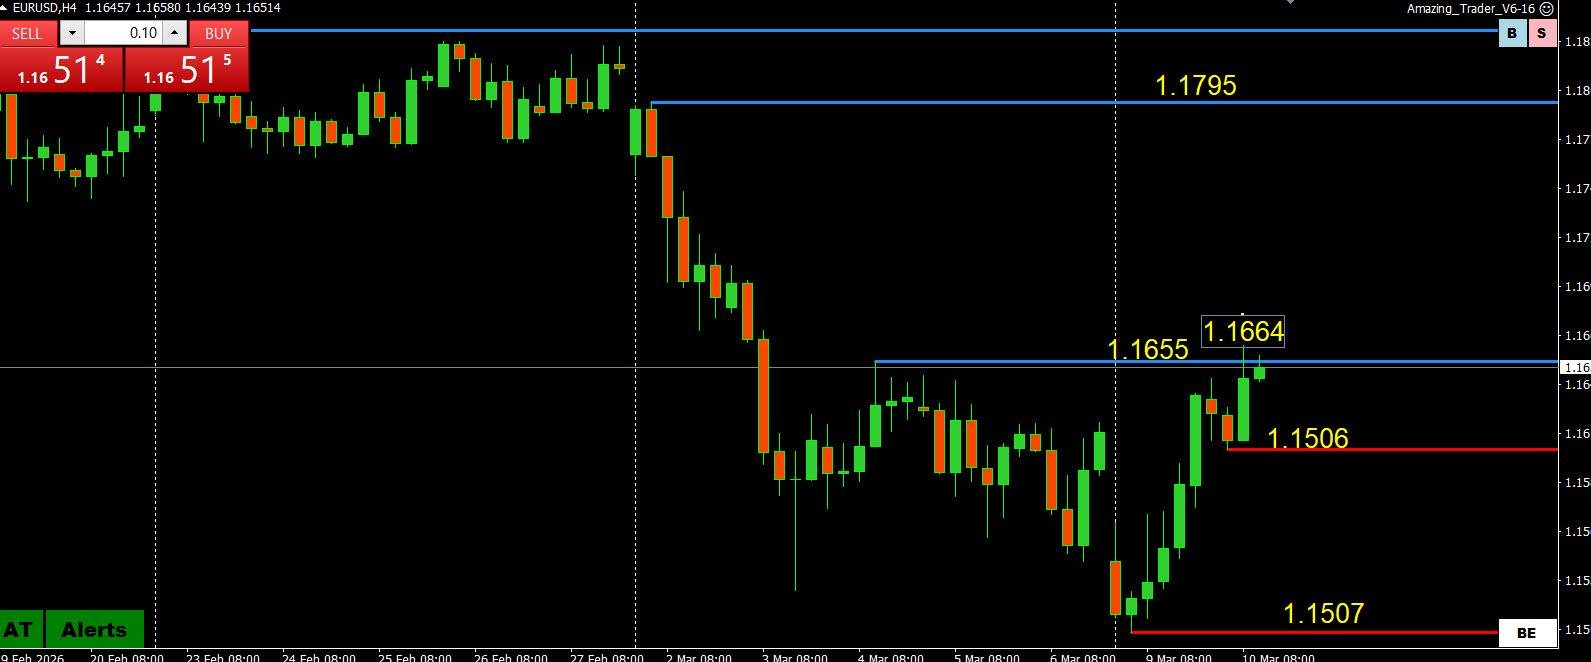
- What a difference a day makes! At this time yesterday EURUSD was trying to hold off a run at 1.15, USDJPY was aiming for 159, GBPUSD had traded 1.32xx, AUDUSD was trading below .70 and CAD was firmer on an oil play.
- US stocks have extended rebounds, XAUUSD (GOLD) is firmer and BTCUSD is back above 70K.
- All it took was news algos reacting to one comment by President Trump to get the ball rolling the other way, confirming once again that it is the reaction to news more than the news itself that matters and gives a clue to trading.
- In any case, it it is hard to suggest follow through without confirming news. So, it feels like another headline watching reaction to news day with one eye on crude oil and the risk mood set by US stocks.
- No key data is due from the US
 March 10, 2026 at 9:02 am #37493
Scanning the headlines these do not sound like a case for risk on

 March 10, 2026 at 8:49 am #37492March 10, 2026 at 8:21 am #37491March 10, 2026 at 12:43 am #37490March 9, 2026 at 9:31 pm #37487March 9, 2026 at 9:28 pm #37486
US stocks rebound into the close as Trump signals war could be over soon
Major US stock indices are rebounding after Trump said that the war could be over soon. He also said that he may look to lower sanctions on Russian oil.
He said he is thinking about taking over the Strait of Hormuz and he has someone in mind to replace the Supreme Leader.
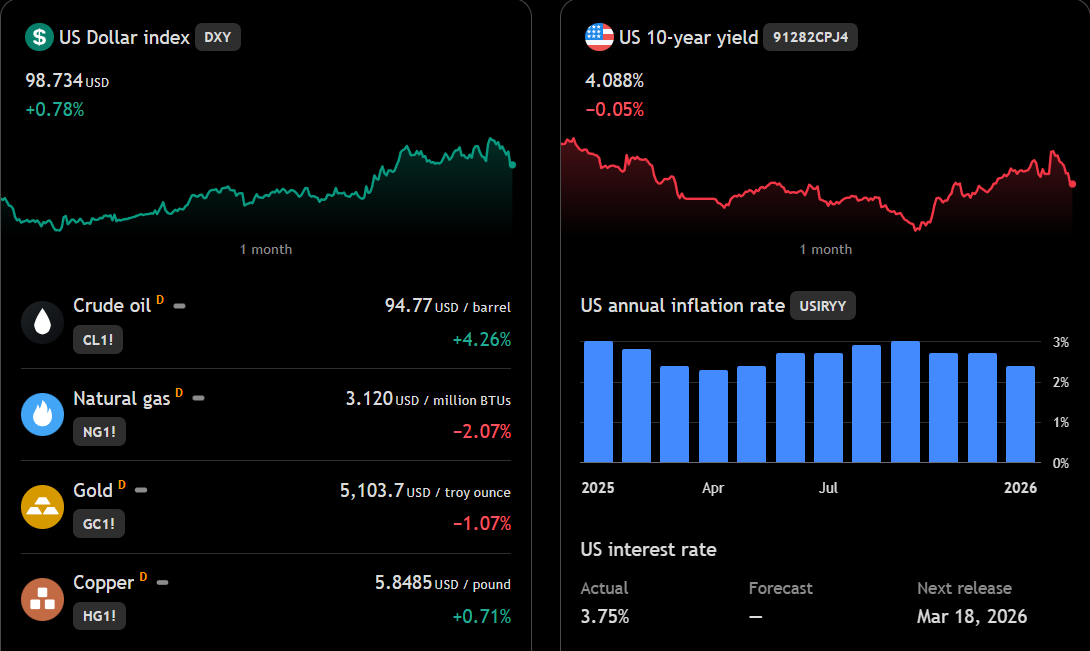
That sent oil prices lower, and US yields lower as well. The 10 year yield which was close to 4.20% at its highest today is trading at 4.105%. Crude oil which reached the near $120 ($119.48 was the high), traded as low as $81.19. The current price is trading at $87, or -4.76% on the day
The gains are led by the Nasdaq index. A look at the final numbers shows:
Dow industrial average +239.19 points or 0.50% at 47740.74
S&P index +55.93 points or 0.83% at 6795.95.
NASDAQ index +308.27 points or 1.38% at 22695.95.
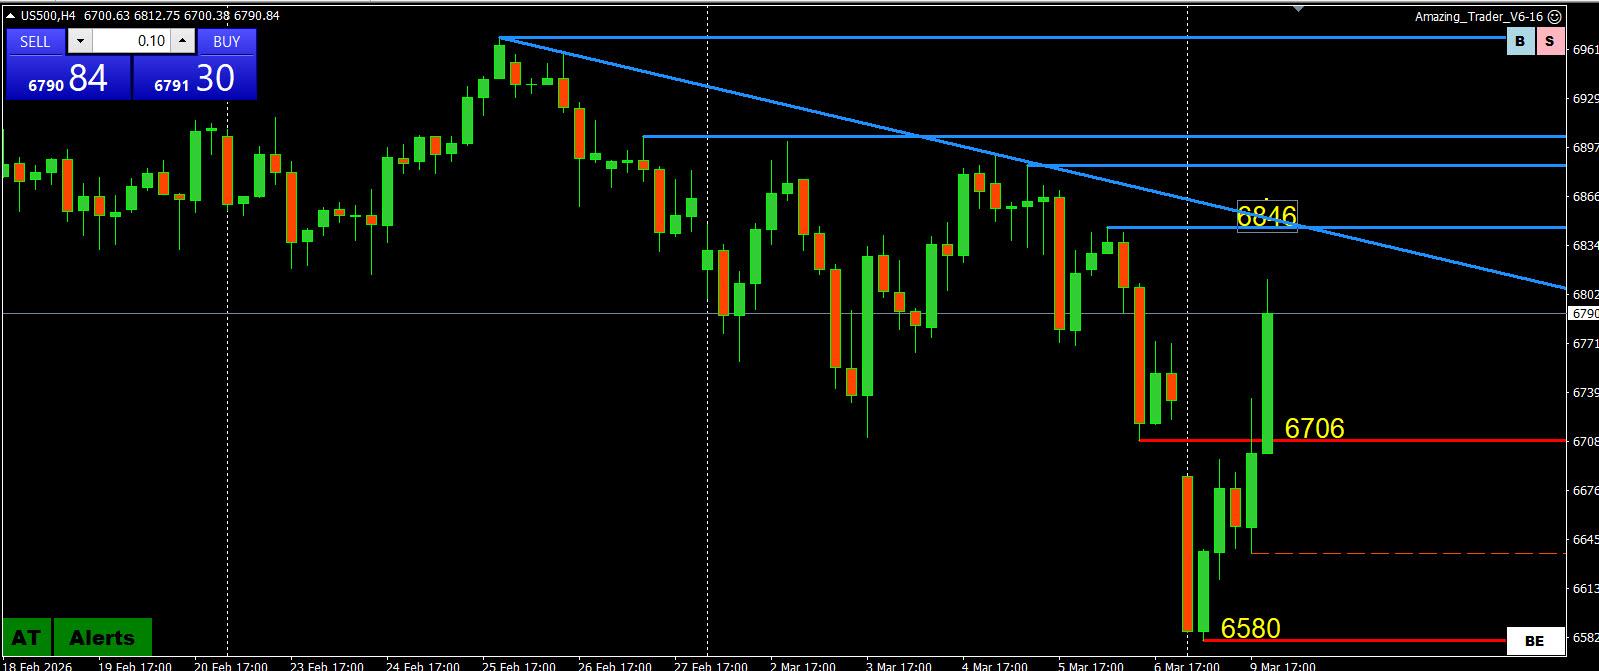
Russell 2000 rose 28.36 points or 1.12% at 2553.66March 9, 2026 at 9:14 pm #37485US500 (SP500) UPDATE
- Reaction to news (and the move down in crude oil) is what matters day, on both sides of the market.
- Bounce off the 6580 low more than filled the opening week gap but requires a move above 6846 to fully negate the downside risk.
- In the meantime, keeps a bid IF it can stay above 6706.
US500 4 HOUR CHART
 March 9, 2026 at 8:51 pm #37484March 9, 2026 at 8:02 pm #37483March 9, 2026 at 7:34 pm #37482March 9, 2026 at 7:32 pm #37481March 9, 2026 at 7:24 pm #37480March 9, 2026 at 7:23 pm #37479March 9, 2026 at 7:03 pm #37478
Repeating earlier post with an addendum
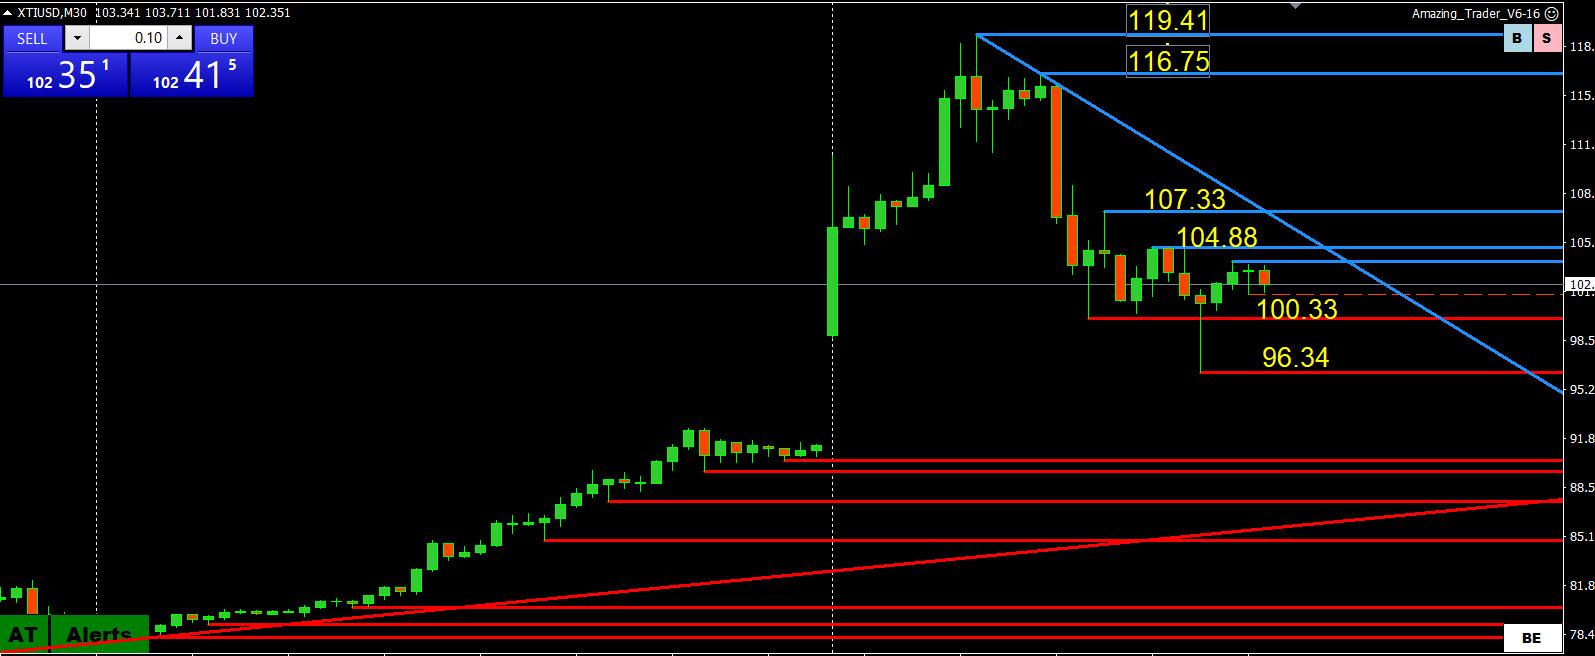
XTIUSD UPDATE
We like to say The Amazing Trader is the only charting algo we know of that creat\es order out of chaos. A good example is this 30 minute XTIUSD chart although it works the same with any symbol in any time frame that yiour broker offers on its platform.
Chart shows:
- Blue lines indicate downward pressure that saw stops run below USD100 and touch the top of the gap.
- Now on the upside, 104.88 (use 105.00) needs to be regained to break down momentum followed by moves through 107,33 and the 30-minute trendline to put the highs back in play.
- Otherwise, 100.00 will be pivotal not just for oil but all global markets.
- Addendum: Opening week gap just about filled (91.60 low vs 91.441 Friday close), making this key support, above which focus stays on 100.00 but only above 97.31 puts it back in play.
Try The Amazing Trader 30 day free trial
XTIUUSD 30 MINUTE CHART
 March 9, 2026 at 5:45 pm #37477March 9, 2026 at 5:36 pm #37476
Fog of War
–
Trump announces he will hold a news conference from Florida before returning to DC
Hegseth says ‘there will be more casualties’ in ongoing US operation in Iran
Energy secretary says oil tankers to resume normal Middle East traffic in weeks
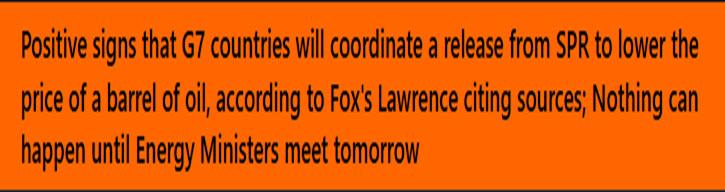
OPINION (By Victoria Coates Fox News): Iran war assumptions dead wrong, Trump proves experts got fooledMarch 9, 2026 at 5:24 pm #37475March 9, 2026 at 4:03 pm #37474March 9, 2026 at 3:31 pm #37473US stocks continue to follow the dip in crude (XTIUSD last 95.80)
 March 9, 2026 at 3:06 pm #37472
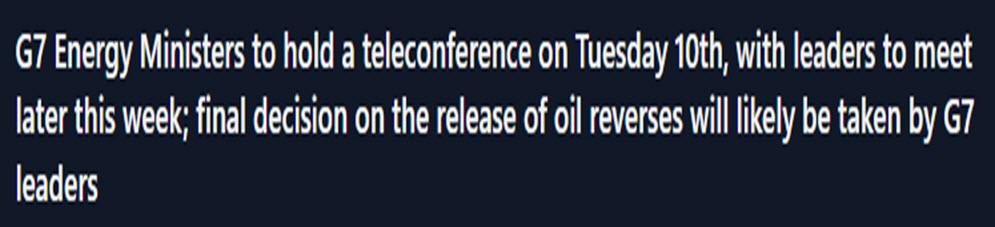
XTIUSD slips below USD100 as G-7 cools off market for now…. stocks up,, USD dips
 March 9, 2026 at 2:52 pm #37471March 9, 2026 at 2:48 pm #37470March 9, 2026 at 2:42 pm #37469March 9, 2026 at 2:39 pm #37468March 9, 2026 at 2:27 pm #37467
Oil slips back on this headline but XTIUSD is still above USD100
 March 9, 2026 at 2:26 pm #37466
Fog of War
–
alternative to cnn / fox / / timesofisrael / rtrs / bbrg / ap / etcIran International launches interactive map to track news by location
The feature allows users to explore news not only by time or topic but also by geographic location, offering a visual way to track developments across cities, provinces and countries.
Each news event appears as a marker on the map showing where it occurred. By clicking on a marker, users can open a list of related stories published about that location and read further details.
The tool enables audiences to quickly see what has happened in a particular city, province or region of the world at a glance.
March 9, 2026 at 2:06 pm #37465US500 (SP500) UPDATE
- Bounce off the low (6580) as crude oil retreats from its high so far not going far enough to negate the downside risk.
- 6700-10+ is what is needed to cool the risk to key supports at 6496-6508
- Keep an eye on XTIUSD USD100 as it remains pivotal for all global markets
US500 4 HOUR CHART
 March 9, 2026 at 2:02 pm #37464
-
AuthorPosts



- You must be logged in to reply to this topic.
Search
© 2024 Global View