

Forum Replies Created
-
AuthorPosts
-
AUDUSD Bounces, But Can It Break the Downtrend?
AUDUSD has staged a comeback from its recent low of 0.6442, but faces a stiff challenge at the upper boundary of the falling price channel on the 4-hour chart. This resistance zone will determine whether the current rally is a mere blip in the downtrend or a sign of a potential trend reversal.

Upside Potential: Can the Rally Extend?
- 0.6624 Resistance in Sight: If the bulls manage to push the price above the price channel resistance, it could signal a significant breakout and pave the way for further gains towards the next resistance level at 0.6624. This would indicate a shift in momentum and potentially mark the start of a new uptrend.
Support Levels to Watch for Downtrend Continuation
- 0.6520: Initial Hurdle: If the upside momentum fades and sellers regain control, a breakdown below the initial support level of 0.6520 could trigger another decline. This could lead to a retest of the 0.6442 support level that marked the recent low.
- Lower Support Levels: Further breakdown below 0.6442 would open the door for falls towards the 0.6400 area, solidifying the downtrend and suggesting the recent bounce was just a corrective move within the larger downward trend.
Overall Sentiment
The outcome of the price action around the 0.6520 support level and the price channel resistance will be crucial in determining AUDUSD’s next move. A breakout above the channel could indicate a potential trend reversal and upside potential towards 0.6624. Conversely, a breakdown below 0.6520 and subsequent breach of 0.6442 would reinforce the downtrend and suggest further decline towards 0.6400 or lower.
Disclaimer: This analysis is for informational purposes only and should not be considered as investment advice. Please conduct your own research before making any trading decisions.
EURUSD
Without going in what might or might not happen in coming days, I’ll stick to what should happen tomorrow.
Supports come in 1.07800 – 1.08000 area – every 5 pips might prove hard to get through…
So, if the area holds , we should see tomorrow even bigger move then today – we might run straight for the 1.09450
But if bellow 1.07800 – All Bets Are OFF

DLRx 103.78
to state the obvious : dlr is on the back foot somewhatone could be suspicious of players trying to push the puppy lower for possible buying but I am not convinced there is underlaying appetite for the buck.
maybe if FED yakkers come out with higher for longer hymns or Minutes deliver something to impress players later this week
XAUUSD 30 Min Chart – is the high for the day in?

Having held the 1995 level I cited in prior posts, XAUUSD is rallying in line with a weaker USD
So far the high around 2031 is just shy of last week’s 2032 high
2025 = support that needs to hold to keep the high at risk
2015 = low of the day so expect support below the market as long as it stays above it
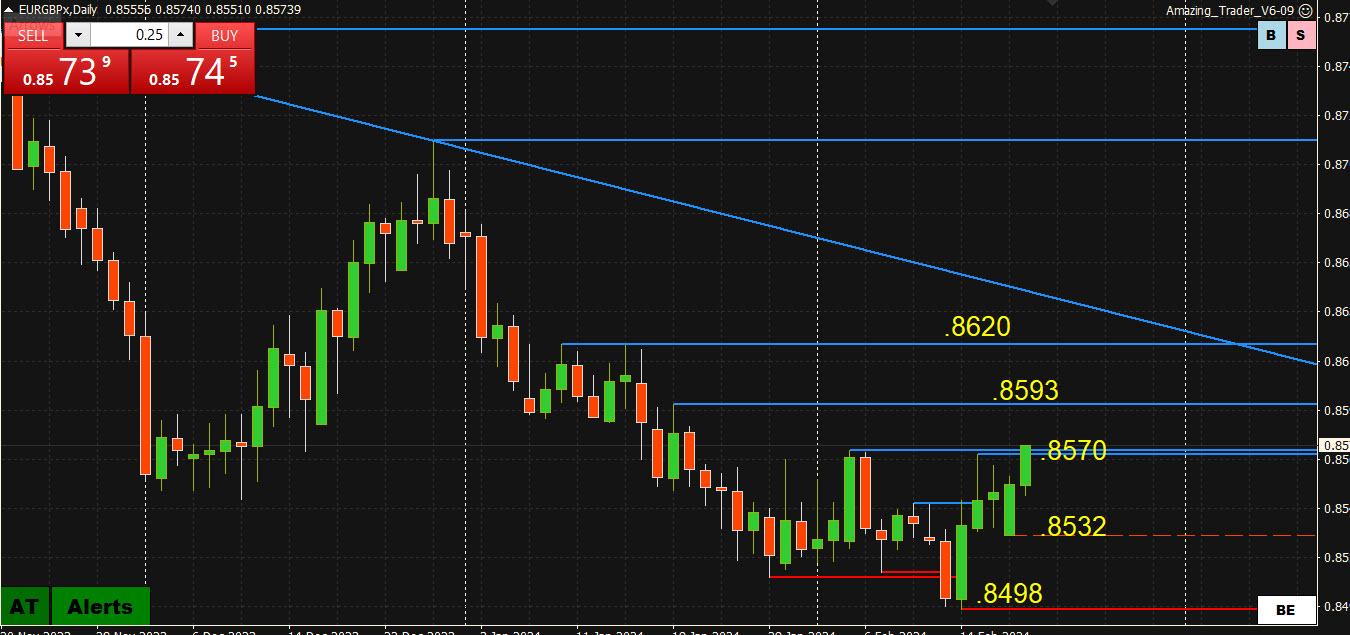
EURGBP Daily Chart (correcting or end of trend>)
Those who have followed me over the years have seen me say you can’t trade EURUSD or GBPUSD without keeping an eye on EURGBP. The move up in this cross is behind some of the demand for EURUSD while GBPUSD struggles on the upside.
As the chart shows, EURGBP has bounced off a test of .8500 *just below( and is currently trying to establish above,8575, which would expose .8592-.8620 as the last leg down is negated.
On the downside, it needs to hold .8532 to keep the bid but .8570+ for the string bid.
A look at the day ahead in European and global markets from Tom Westbrook
Europe’s central bank has singled out wages as the single biggest risk to its crusade to contain inflation. Fourth-quarter negotiated wages data likely headlines the trading day.
USDCHF Analysis: Uptrend Continues, Resistance and Support Levels
The USDCHF pair is currently above a rising trend line on its 4-hour chart, indicating that the pair remains in an uptrend from 0.8550.

As long as the trend line support holds, the pullback from 0.8885 could be seen as consolidation for the uptrend. A breakthrough of the 0.8845 resistance level could trigger another rise to test the 0.8885 resistance level. A breakthrough of this level would aim for the 0.9000 area.
The key support level is located at 0.8782. Only a breakdown below this level would indicate that the upside move has completed at the 0.8885 resistance level already. In this case, the pair would find next support at around the 0.8650 area.
-
AuthorPosts


Search
© 2024 Global View