
- This topic has 27,906 replies, 54 voices, and was last updated 5 hours, 14 minutes ago by GVI Forex 2.
-
AuthorPosts
-
March 20, 2024 at 4:48 am #3320
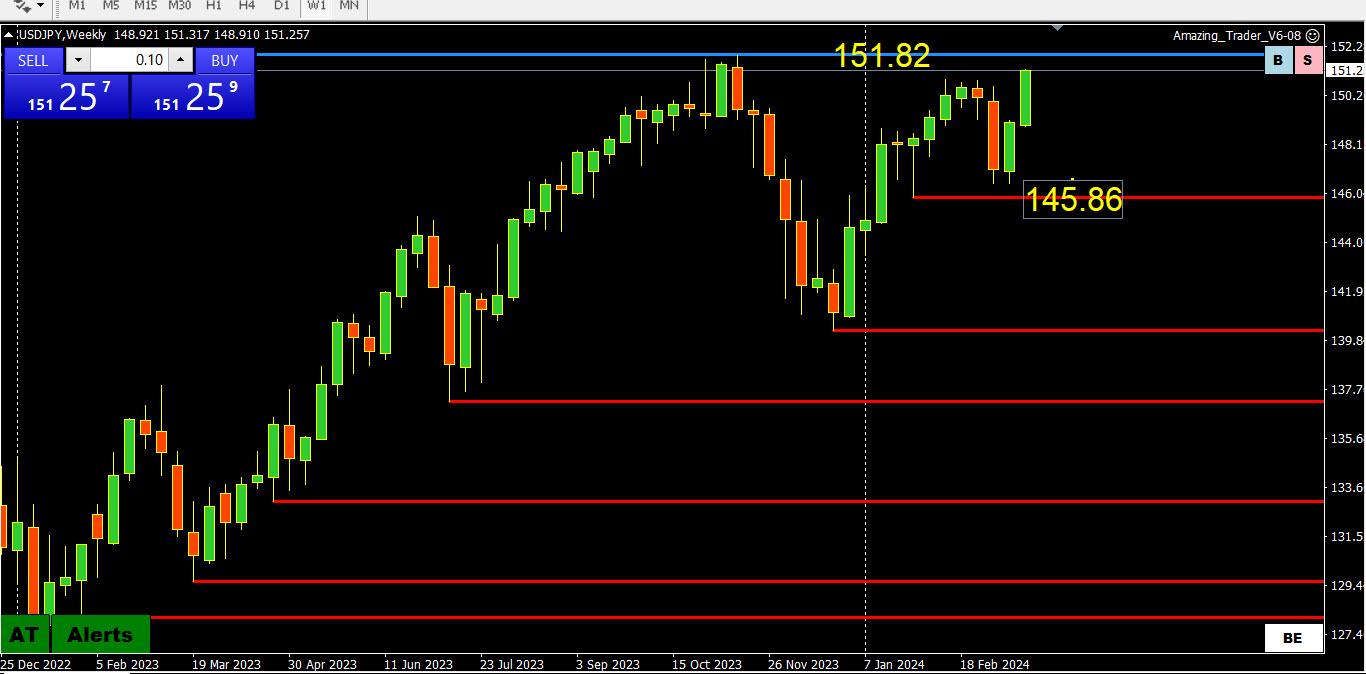
USDJPY Analysis: Breakout and Potential for Further Upside Movement
USDJPY has successfully surpassed the 150.88 resistance level, with the upward movement from 146.47 extending to a peak of 151.33.
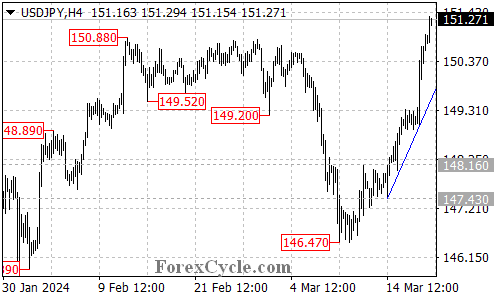
As long as the price remains above the ascending trend line on the 4-hour chart, there is still potential for additional upward movement in the upcoming days, with the next target estimated around 160.00.
The initial support level to monitor is at 150.35. If the price breaks below this level, it could suggest a period of consolidation for the uptrend starting from 146.47, with the pair likely finding support at the rising trend line.
A decisive break below the support provided by the trend line could indicate the potential completion of the current uptrend.
March 20, 2024 at 1:28 am #3319March 19, 2024 at 9:15 pm #3314March 19, 2024 at 7:46 pm #3313March 19, 2024 at 7:38 pm #3312March 19, 2024 at 7:37 pm #3311March 19, 2024 at 7:23 pm #3310GBPJPY DAILY CHART
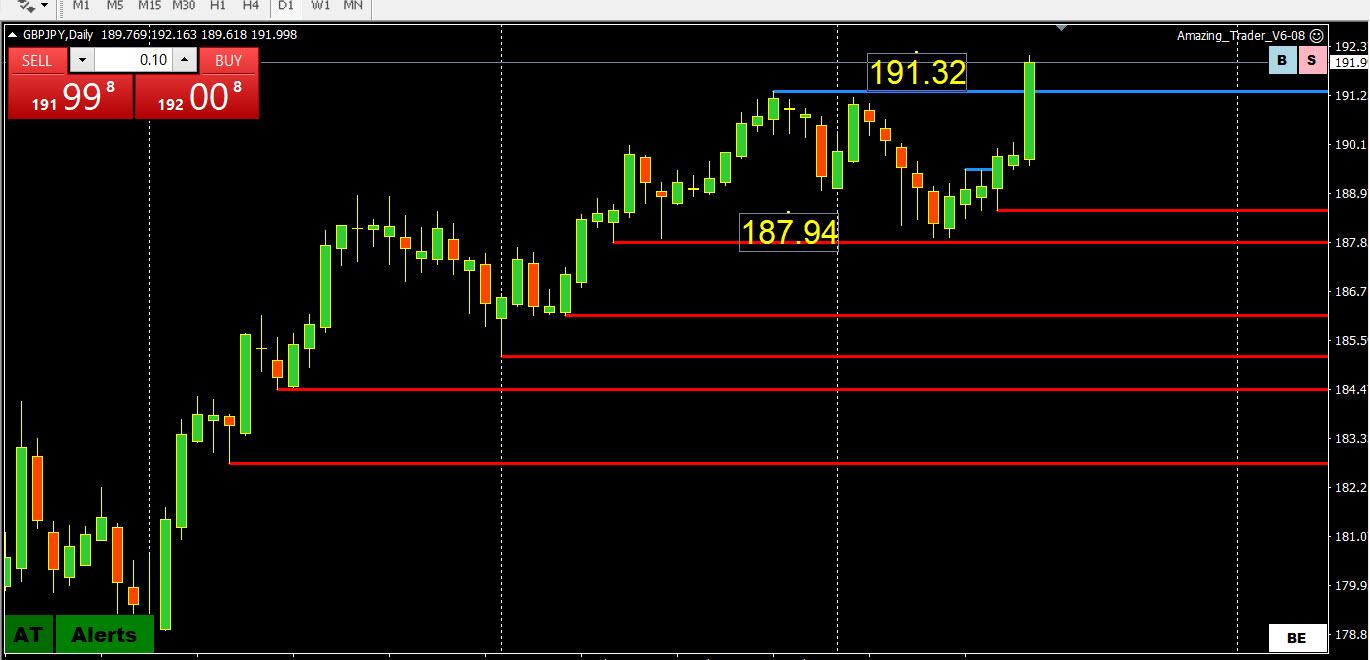
I had to go to the daily chart looking for a chart level.
All that is left is a breakout above 191.191.32 as support and a monthly resistance above 185.
The key support area is distance at 187.94 as seen on this chart.
In a market like this look for the new high to act as a key resistance.
Be o alert in GBP as CPI, expected to dip, will be released overnight.
‘
March 19, 2024 at 6:23 pm #3308March 19, 2024 at 5:57 pm #3304March 19, 2024 at 5:51 pm #3302March 19, 2024 at 5:09 pm #3300March 19, 2024 at 4:46 pm #3298fun for some, not so much for some others
–
Bitcoin Drops After Flash Crash. Why Prices Could Keep Dropping.as I have mentioned numerous times before … opinions are like ass-holes: everyone has one
March 19, 2024 at 4:33 pm #3297March 19, 2024 at 4:28 pm #3296March 19, 2024 at 3:42 pm #3294March 19, 2024 at 3:41 pm #3293March 19, 2024 at 3:38 pm #3292March 19, 2024 at 3:23 pm #3291March 19, 2024 at 3:09 pm #3287March 19, 2024 at 3:08 pm #3286March 19, 2024 at 3:08 pm #3285March 19, 2024 at 2:58 pm #328310-yr 4.316%; DLRx 103.56
–
first day of FOMC collective in sessionfor USD to go uP some more, yield will have to co-operate.
UNFORTUNATELY … volatility is down somewhat. One could think players favor short-term comittements over medium/long term ones.
It probably means lower peaks and valleys in pricing than would be otherwise.March 19, 2024 at 2:56 pm #3281USDJPY 15 Minute Chart – Is the BoJ lurking?
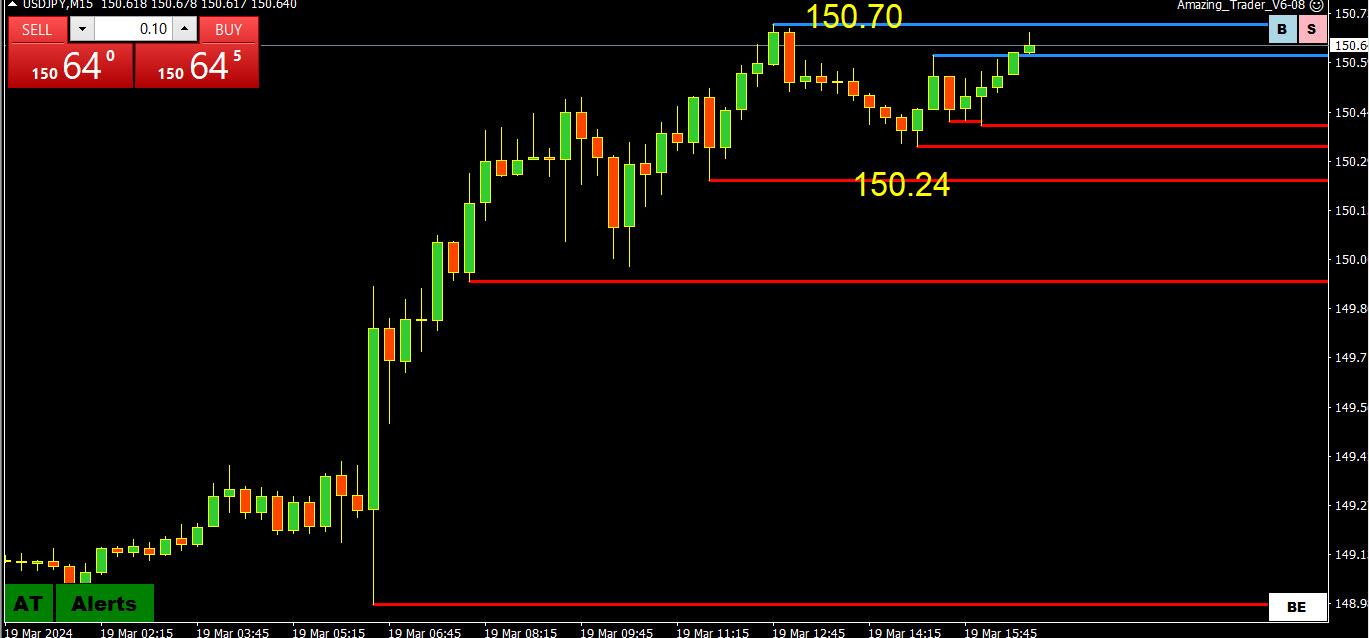
Just to show you there is a method to my madness when I follow the AT lines
As noted in my earlier post, key levels are at 150.24 and 150.85 (seen on a 4-hour chart) and USDJPY is trading within this range but upper end is exposed while above 150.50
Currently, an invisible hand seems to be back protecting 150.85, at least for now
March 19, 2024 at 2:37 pm #3279CADCHF 4 HHOUR CHART
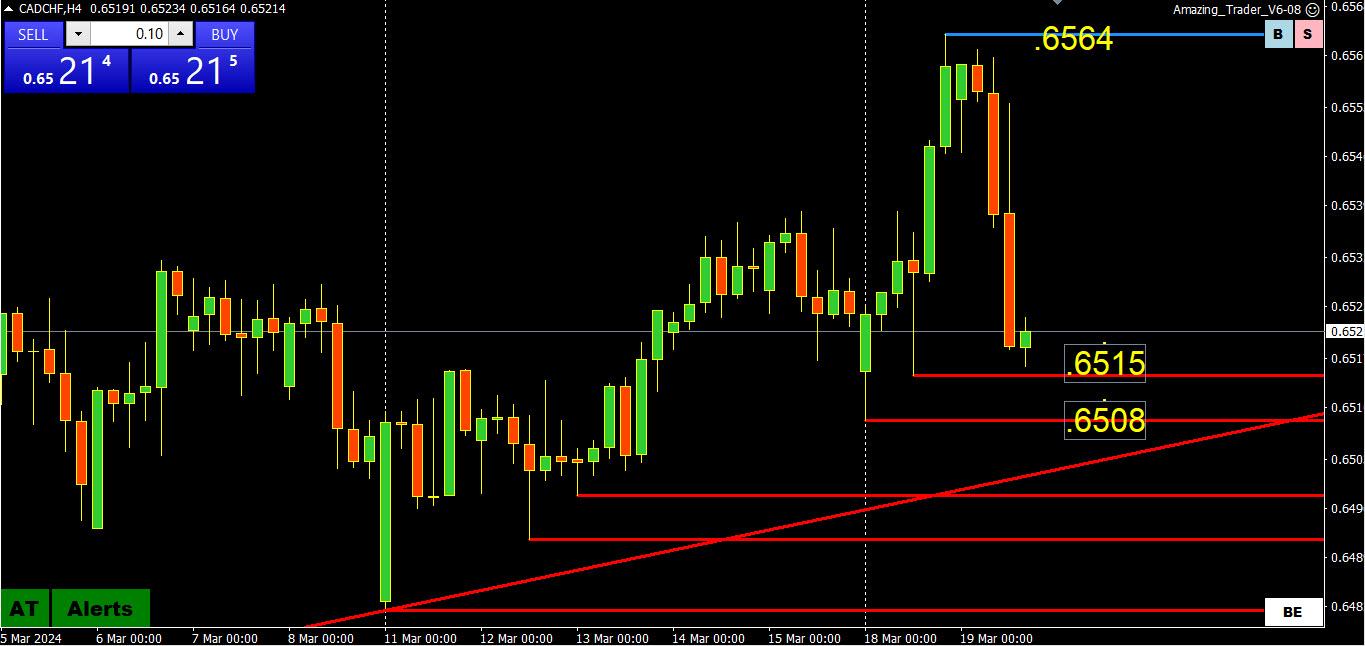
I have never looked at this chart so doing so now after Swiss Frank pointed it out.
The support area at .6508-15 needs to hold to keep the latest leg up alive.
However, only a break of the high would revive momentum on the upside.
This is a day where CAD (down) has reacted to a CPI data surprise.
March 19, 2024 at 2:27 pm #3278March 19, 2024 at 1:40 pm #3277March 19, 2024 at 1:14 pm #3276March 19, 2024 at 12:33 pm #3272March 19, 2024 at 11:31 am #3265This article was posted before the SNB revised economic forecasts
BENGALURU, March 18 (Reuters) – The Swiss National Bank will wait until at least June before cutting interest rates, according to a strong majority of economists polled by Reuters, who said it would make shallower cuts this year than peers.
The SNB may choose to wait on the sidelines until the U.S. Federal Reserve and European Central Bank start cutting interest rates, widely expected in June, to prevent further weakness in the Swiss franc.
SNB to wait until at least June before cutting rates modestly – Reuters poll
March 19, 2024 at 11:16 am #3264 -
AuthorPosts
 tp at it.
- You must be logged in to reply to this topic.
Search
© 2024 Global View