
- This topic has 28,250 replies, 54 voices, and was last updated 12 hours, 17 minutes ago by GVI Forex 2.
-
AuthorPosts
-
April 30, 2024 at 2:34 pm #5476April 30, 2024 at 2:29 pm #5475April 30, 2024 at 2:22 pm #5474
BTC DAILY CHART – IS AIR COMING OUT OF THE BUBBLE?
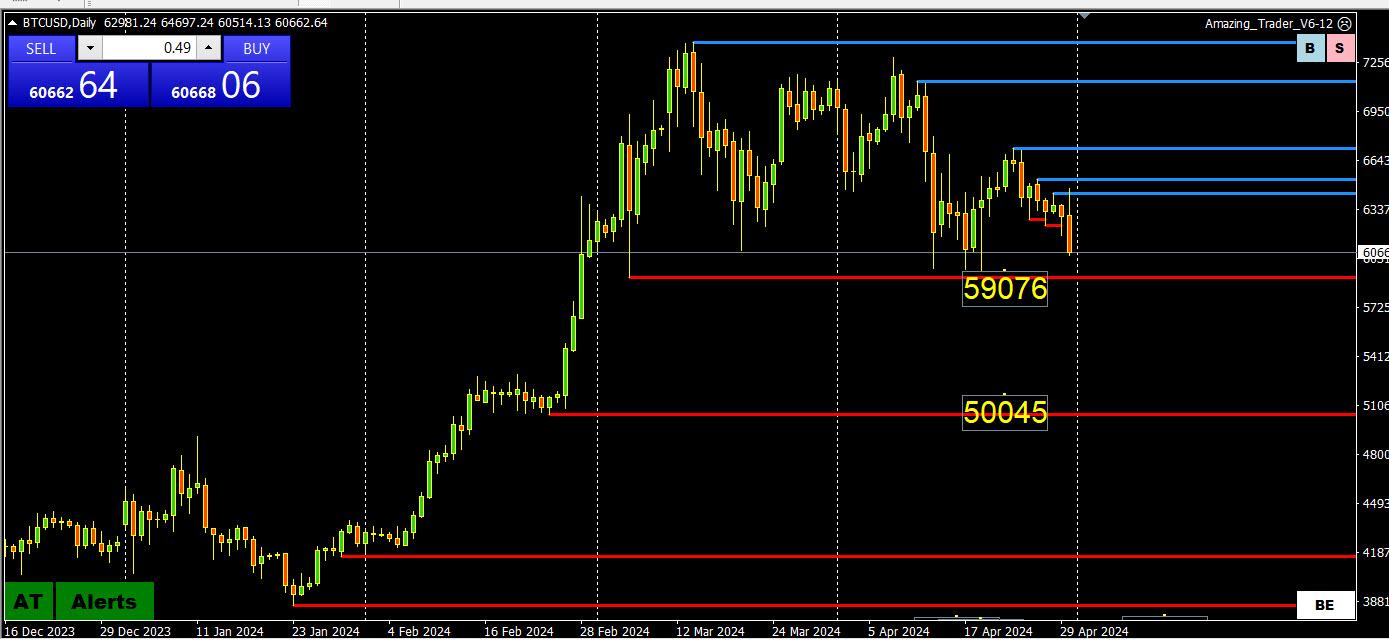
Similar to XAUUSD 2300-2400, BTC has seen moves outside of 60000-70000 lack follow through.
This is close to being tested with the key level around 59561-59561 and 60000 looming below.
So watch the close vs 60000 with the onus on the Bulls to have it trade above it.
April 30, 2024 at 2:15 pm #5473April 30, 2024 at 2:05 pm #5472April 30, 2024 at 2:02 pm #5471April 30, 2024 at 2:02 pm #5470April 30, 2024 at 2:02 pm #5469April 30, 2024 at 1:52 pm #5468April 30, 2024 at 1:47 pm #5467April 30, 2024 at 1:44 pm #5466April 30, 2024 at 1:42 pm #5464April 30, 2024 at 1:35 pm #5460April 30, 2024 at 1:26 pm #5459April 30, 2024 at 1:23 pm #5458April 30, 2024 at 1:23 pm #5457I believe AudUsd should pull back up in coming hours to around 6525 where there is a good R/R to short and hold if you missed it for a few days if it sticks. Overall Aud is a nice buy especially against crosses so my preference is to be long those crosses. Usd has rate dominance overall so if it is selling it is just smaller cycle.
April 30, 2024 at 1:21 pm #5456XAUUSD 4 HOUR CHART – HAS THE BUBBLE BURST?

The jury is still out in XAUUSD as the bulls need to keep closes above 2300 to maintain a 2300-2400 range and a pattern where moves outside of it lack follow-through.
As I noted yesterday, bias within this range is tilted down as long as it stays below 2350.
Now it needs to hold 2291 and keep closes above 2300 or risk points lower.
April 30, 2024 at 1:13 pm #5455April 30, 2024 at 12:38 pm #5454HOTTER US EMPLOYMENT COST INDEX… USD UP, YIELDS UP, STOCKS DOWN IN KNEE JERK REACTION
April 30, 2024 at 12:27 pm #5453There was a Global-View member. a bank trader working for Japanese bank who gave the JPY a nickname I never forgot. He called the JPY “The Devil “ The reason, as he said was because “the YEN had destroyed more trading careers” than any other currency.
Currency Intervention and Why the JPY is Called : “The Devil”

Currency Intervention and Why the JPY is Called : “The Devil”
April 30, 2024 at 12:23 pm #5452April 30, 2024 at 12:19 pm #5451April 30, 2024 at 12:07 pm #5450Agree Knez….but why did oyu have to ruin it all with mentioning the Data 😀
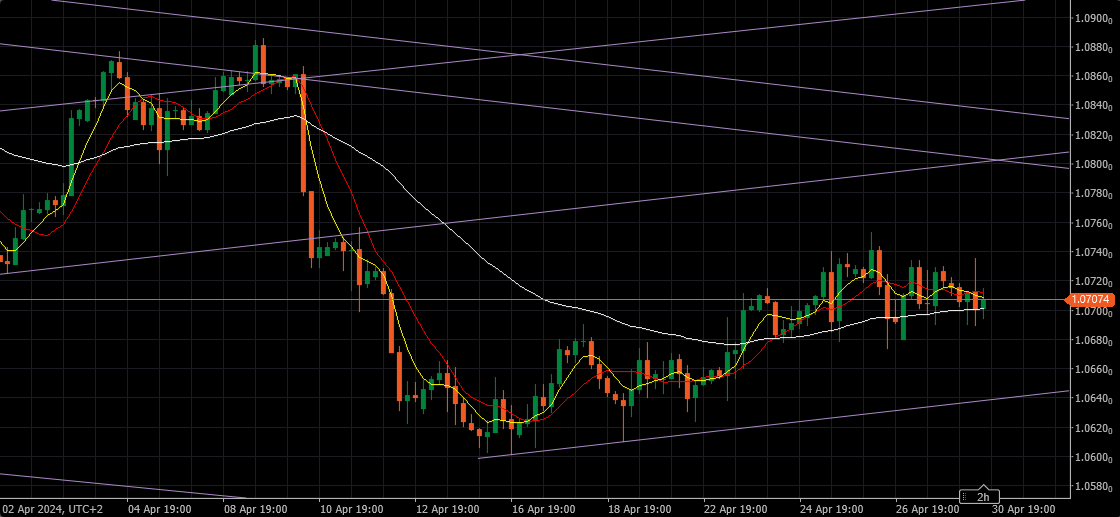
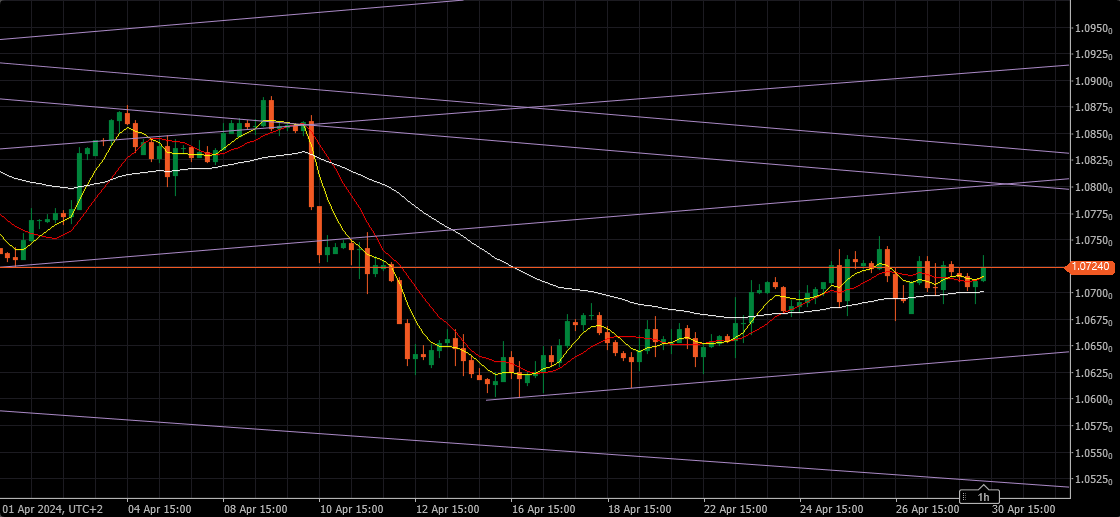
April 30, 2024 at 11:54 am #5447April 30, 2024 at 11:48 am #5446Knez, this 4H Bar has to close below 1.07100 to signal any attempt to the downside.
You said once that your 4h chart is not the same as mine – time wise – this last bar opened at 11h our time.
I have fine tuned everything based on it – for over 2 decades – so I would recommend you to get a charting system that has same timing.
EURUSD is kind of lame from April 16. , so it really doesn’t look as capable of real achievement on the upper side…still…what I learned first about EUR is that it can take it’s sweet time like forever, and then suddenly decides to run…
When you look at it, this is a clear Sideways to nowhere situation (kind of Up, but only on smaller time frames) .
We must be patient with this pair and it will show us the way.
April 30, 2024 at 11:45 am #5445EURGP 30 MIN – Now faces resistance
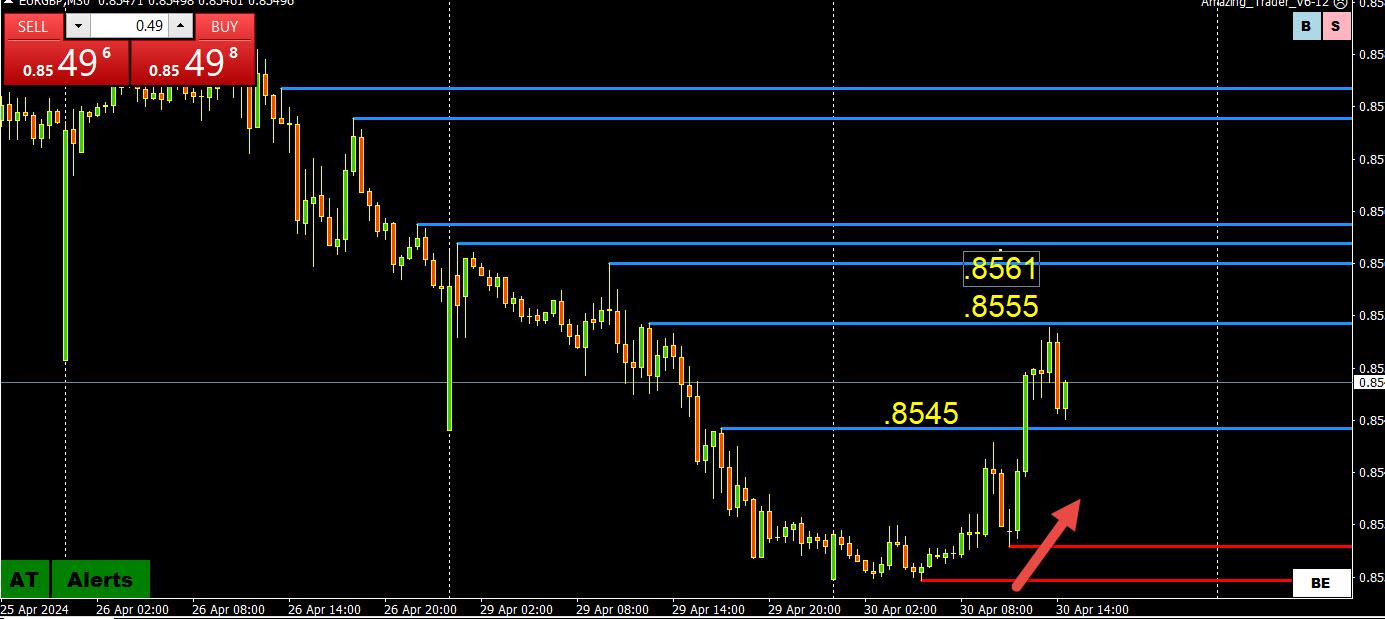
Following up on my earlier post where looming support proved too tough and now EURGBP is facing resistance at the .8561 level cited in that post. So far .8555 resistance is holding, needing to stay above .8545 to keep its bid.
Take note of the two red Amazing Trader (AT) lines highlighted, otherwise known as an AT Directional Indicator, signaling a potential shift in directional risk that played out.
April 30, 2024 at 11:40 am #5444April 30, 2024 at 11:22 am #5441April 30, 2024 at 10:28 am #5440A look at the day ahead in U.S. and global markets from Mike Dolan
World markets stalled on Tuesday as another heavy earnings week for megacap stocks cranked up, with renewed slippage in Japan’s yen and U.S. Treasuries eyed closely in the background.
Morning Bid: Yen slips anew with Amazon due, Treasury plans irk
April 30, 2024 at 9:25 am #5435EURUSD POPS => EUR CROSSES POP (SEE EURGBP)
Month end or news (Flash GDP beats forecasts)
-
AuthorPosts
- You must be logged in to reply to this topic.
Search
© 2024 Global View