
- This topic has 28,036 replies, 54 voices, and was last updated 2 days, 11 hours ago by GVI Forex 2.
-
AuthorPosts
-
May 2, 2024 at 8:51 pm #5640May 2, 2024 at 8:31 pm #5639
BTC Daily
Oh my, oh my….do we have some natural channels on BTC – I wasn’t expecting this.
55.700 – if it proves a real support, I will start believing that BTC might become a real currency after all…
Even if it breaks….as long as it stays within the parameters.
This is the reason for me to place it on my Daily watch list.
 May 2, 2024 at 6:57 pm #5638May 2, 2024 at 6:53 pm #5637May 2, 2024 at 6:43 pm #5636May 2, 2024 at 6:33 pm #5635May 2, 2024 at 6:27 pm #5634May 2, 2024 at 6:12 pm #5633May 2, 2024 at 6:11 pm #5632May 2, 2024 at 5:57 pm #5631May 2, 2024 at 5:48 pm #5630
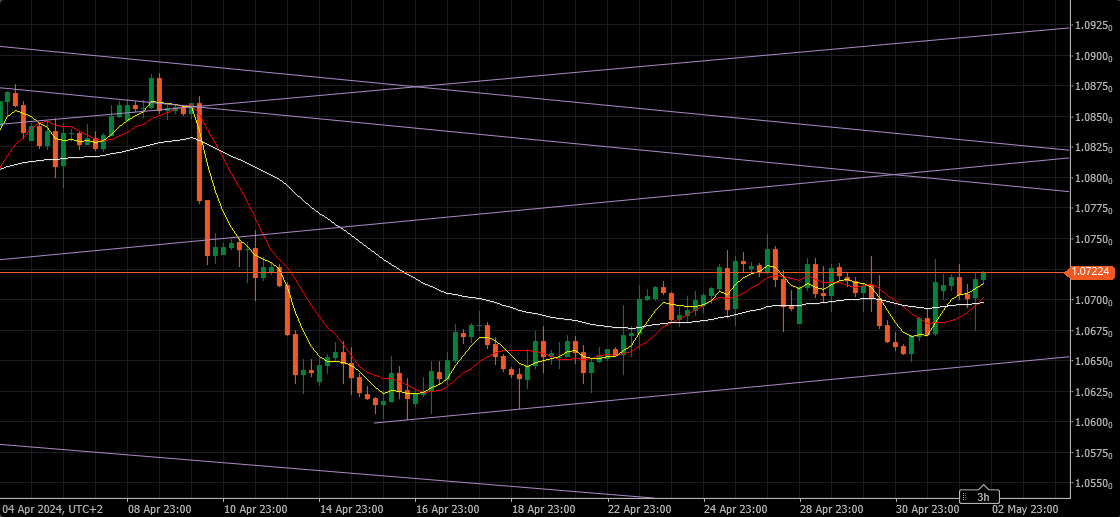
EURUSD 4 H – Update
This is the third week that we are starting the day with one outlook, just to close it with an opposite one.
Seems as the Bulls and the Bears are just waiting for some data to try to use it to prove their point.
Personally, I couldn’t care less about data and/or interest rates, news and rumours .
It is enough to determine what might happen next few hours , based on 4h chart, and then switch to 30 min and wait for appropriate signal.
Right now, I have to tell you that the picture is changing – once again – The pattern calls for a push Up.
Bare in mind that unless 1.07350 and subsequently 1.07550 are taken out, we can have any pattern we like, but we ain’t gonna go higher.
This is not rectangle ( yet ), this is not the range trading ( waves are too short ) – this is some kind of Sideways to Up …a bit….so take it as it comes and do not try to predict bigger picture.
 May 2, 2024 at 5:07 pm #5625May 2, 2024 at 4:01 pm #5624
BTC 4 HOUR CJART – WHAT IS THE NEW RANGE?
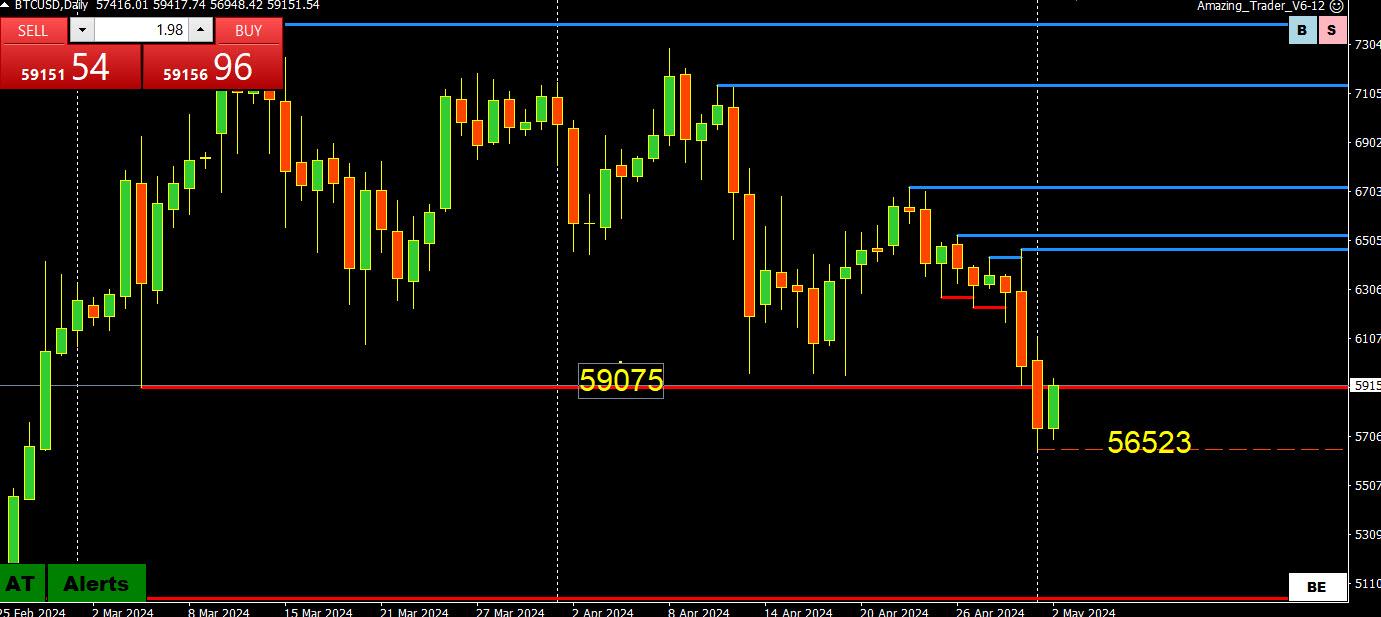
I asked this question the other day whether the new range for BTC would be 50-60K or 55-65K?
So, far it has paused above 55K so let’s see if it can print 60K.
This is more of a macro than a technical view but in this crypto, it is a way to make some sense out of the way it trades.
For the bull side, it first needs to re-establish above 59075.
May 2, 2024 at 3:44 pm #5623May 2, 2024 at 3:37 pm #5622May 2, 2024 at 3:35 pm #5621GBPUSD DAILY CHART – 1.25 PATTERN
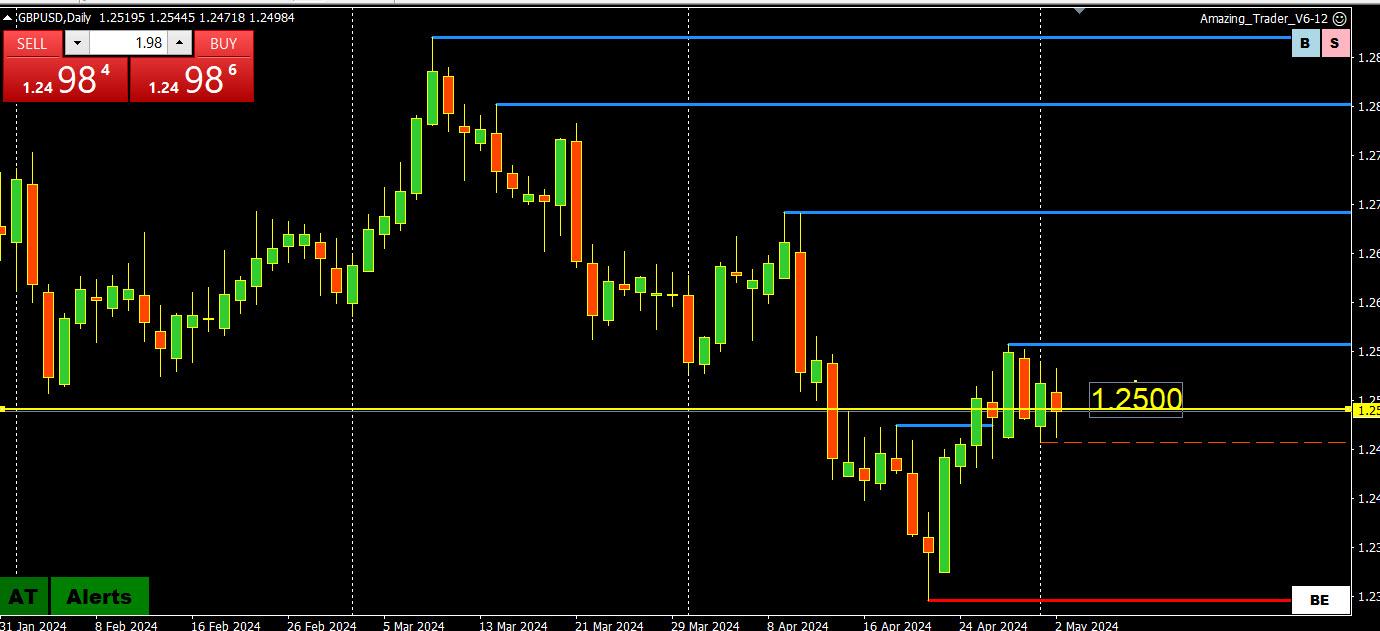
Similar to the EURUSD 1.07 pattern cited earlier GBPUSD has extended its pattern trading on either side of 1.25 to 6 days in a row today.
Over this period there have been”
3 closes above 1.25
2 closes below 1.25
As I noted in EURUSD, the longer this pattern goes on the greater the chance of a directional move once it is broken.
Note today GBPUSD traded lower, helped by GBPJPY selling but the GBPUSD sell part was more easily absorbed than the USDJPY selling out of the cross (same for EURUSD selling more easily absorbed).
May 2, 2024 at 3:15 pm #5620May 2, 2024 at 3:08 pm #5619May 2, 2024 at 2:56 pm #5618THIS WAS OUT EARLIER. HOPE OR A VIEW?
“The new emerging consensus from Wwll Street c-suite is that Powell wants to cut rates by September” according to Fox’s Gasparino.
Source: Newsquawk.com
May 2, 2024 at 2:52 pm #5617My note on worker productivity is for the overall, not this report which moderated. Gbp should inevitably begin pricing in Fed rate cut in the near future and target 2800 in my view. Price activity is the sell side this morning but the complementing issues are bid, which is why I am selling euro but trying to position long in Gbp.
May 2, 2024 at 2:49 pm #5616WHEN YOU SEE TWO CURRENCIES TRADE IN OPPOSITE DIRECTIONS VS. THE USD YOIU CAN ASSUME THERE ARE CROSS FLOWS DRIVING THE MARKET.
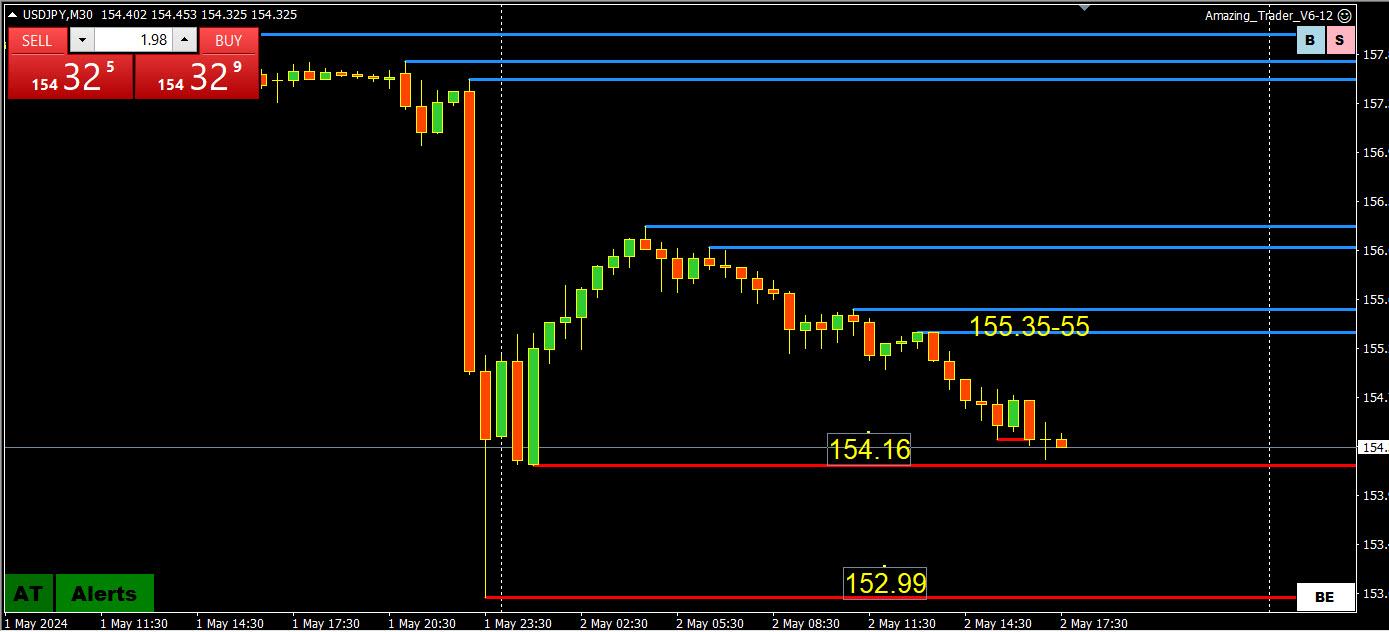
NOTE TODAY USDJPY IS DOWN, AND EURUSD AND GBPUSD ARE BOTH LOWER.
As explained in the following…
How You Can Use Currency Crosses to Trade Spot Forex
 May 2, 2024 at 2:43 pm #5615May 2, 2024 at 2:36 pm #5614May 2, 2024 at 2:35 pm #5613May 2, 2024 at 2:21 pm #5612May 2, 2024 at 2:17 pm #5610
US500 4 HOUR CHART – 5000 oe bust?
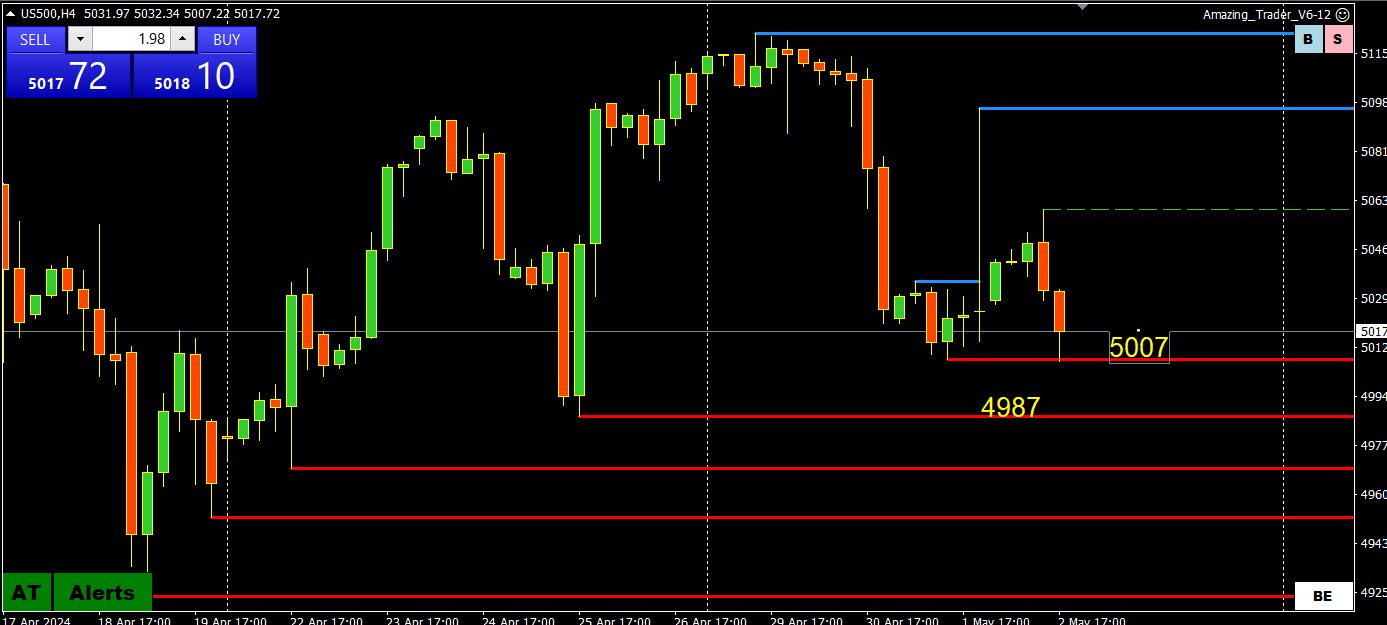
You can look at any stock indices but the one level that will grab headlines is S&P 5000
On the US500 the key area is 4987 with 5007 and 5000 standing ahead of it.
So far this area is being protected.
Note different brokers may have different CFD price feeds, even for the same symbol.
May 2, 2024 at 1:49 pm #5608I pay attention to what Bobby says on the EURUSD. As he posted earlier, so far a good guide
Technically speaking, this does not look good for the EUR , and as we can see lower and lower Daily Highs in previous days, picture is slowly starting to get some sense…
BUT focus is mainly on the (firmer) JPY
May 2, 2024 at 1:47 pm #5607May 2, 2024 at 1:44 pm #5606May 2, 2024 at 1:37 pm #5605DLRx 105.63
–
After jerome’s yak players are left with the suggestion that rates have likely peaked and that FEDs next rates move is likely down although not soon fault of “no conviction” level data.Bottom line
– Dlr is now vulnerable. Move sub 105.4 would see me jump in join the slide for potential 104.50/40imo patience , usually, brings rewards
-
AuthorPosts


- You must be logged in to reply to this topic.
Search
© 2024 Global View