
- This topic has 28,082 replies, 54 voices, and was last updated 4 minutes ago by GVI Forex 2.
-
AuthorPosts
-
May 30, 2024 at 9:51 am #7003
EURUSD 4 HOUR CHART – 1.08 REMAINS THE FOCUS

The move below 1.0800-05 did not reach key supports (low 1.0788), leaving 1.08 as the bias-setting level. To shift the risk the other way, however, 1.0859 would need to trade.
Looking ahead, tomorrow is month end and with US stocks having a strong month, the theory says there could be USD selling for rebalancing purposes. We will discuss this later.
For now, technicals are pointed down but neutralized if EURUSD trades above 1.08.
May 30, 2024 at 9:35 am #7001USDJPY 4-HOUR CHART – DID THE BOJ INTERVENE?

The price action suggests there was intervention, presumably to defend the 158 level. So far, the move down paused dead on at 156.52 support. USDJPY would need to establish below 156.90 -00 to give the upside a breather.
As I posted yesterday:
As I noted earlier, 157.50=00 is the BoJ/MoF’a nervous zone with only the 160.16 high left on charts after that level.
With higher US yields driving the dollar higher, all the Japanese officials can do is threaten as any intervention, unless it was massive and sustained, would likely be met with buyers below the market.
In any case, if in fact it was intervention, it has restored a two-way risk to what was becoming a one-way street and confirms the new line in the sand is at 158.00.
Thinking out loud, perhaps they wanted tio restore a two-way risk ahead of inflation data from the US and Japan on Friday.
May 30, 2024 at 12:44 am #7000May 30, 2024 at 12:42 am #6999May 29, 2024 at 11:46 pm #6998Killing-Making Opportunity:
–
*A crisis comes along around once every ~5 years (1994, 1998, 2001, 2008, 2011, 2020, 2023). In the heat of the moment, keep a cool head and focus on facts. Act swiftly and decisively. Communicate, communicate, communicate.
*If you wait for 100% information you will never make a decision. In a crisis, time matters. Trust your judgment.”• Beth M. Hammack, 52, will take over as Cleveland Fed President when Loretta Mester steps down June 30. Hammack will take office officially on Aug. 21.
• The Cleveland Fed president plays an important role this year as a voter on the rate-setting Federal Open Market Committee.Goldman Sachs partner Beth Hammack to succeed Mester as Cleveland Fed leader – jeff cox
May 29, 2024 at 11:25 pm #6997May 29, 2024 at 9:35 pm #6996This is a timely article posted today given the continued focus on interest rate rates. This is especially timely given the way the dollar has followed the rise in US bond yields.
How Does Monetary Policy Affect the Forex Market?
 May 29, 2024 at 9:08 pm #6995May 29, 2024 at 8:13 pm #6994May 29, 2024 at 7:53 pm #6993May 29, 2024 at 7:46 pm #6992May 29, 2024 at 7:42 pm #6991May 29, 2024 at 7:38 pm #6990May 29, 2024 at 7:29 pm #6989
Tesla Inc. (NASDAQ)
And my favourite, almost dear to my heart…Owner of everything ( except a decent stock) ..
It dropped, it bounced a little and now….sideways to nowhere…similar to the Mars Voyage…
I am really keen to hear some new baloney story coming from its headquarters and how they plan to conquer the world.
 May 29, 2024 at 7:14 pm #6988
GME – GameStop Corp (NYSE)
For wider public this one is better known as JOD ( Joke of the day) and for those that were so hot on buying it on Internet Wise guys suggestions goes under GME Aka Margin Killer.
Lots of hopes and dreams got crushed with this one and net is filled with crazed calls for it’s rising …seems to me that it is way more popular to follow some loony then to listen to the reason…
I got almost hate mail , and expect nothing less than dead threats after posting this on X , FB and so on…
This is a clear “dead cat bounce” ( couldn’t even reach the first Fibo ) case and we should see break of support at 18.30 and subsequent fall through 17.40 …and all that wouldn’t be a big deal if the smart asses weren’t buying it at 50 and above…
And not to forget one of the leaders of the Lemmings tribe – Who’s crying now mate
 May 29, 2024 at 7:08 pm #6987May 29, 2024 at 6:59 pm #6986
USDJPY DAILY CHART – ENTERING THE NERVOUS ZONE

As I noted earlier, 157.50=00 is the BoJ/MoF’a nervous zone with only the 160.16 high left on charts after that level.
With higher US yields driving the dollar higher, all the Japanese officials can do is threaten as any intervention, unless it was massive and sustained, would likely be met with buyers below the market.
May 29, 2024 at 6:56 pm #6985May 29, 2024 at 6:42 pm #6984May 29, 2024 at 5:06 pm #6983May 29, 2024 at 4:18 pm #6982May 29, 2024 at 3:24 pm #6981GBPUSD 4 HOUR CHART – A retracement or more?-

The failure to test 1.28 and a generally firmer dollar has GBPUSD retracing, breaking a minor 4-hour trendline.
Key support levels are below 1.27, most important for me is 1.2674.
On the upside, back above 1.2725, at a minimum, would be needed to slow the risk but only back aboe 1.2750 would neutralize it.
May 29, 2024 at 3:01 pm #6980May 29, 2024 at 2:53 pm #6979May 29, 2024 at 2:36 pm #6978May 29, 2024 at 2:34 pm #6977US500 4 HOUR CHART – Death wish or not?

There are times when trying to pick a top in US stocks is like having a death wish and it remains to be seen if this is one of the exceptions.
Looking across different time frames, the 5194 level (your chart level may differ but the red line should be in a similar spot) shows up, suggesting the 5200 area would be a target if this retracement picks up steam.
May 29, 2024 at 2:20 pm #6976Some market metrics for Sterling in futures/options/forwards/technicals/neural are generally bid up to 8 months out, where they start to be offered. So in the very near term there are buyers and I would not be surprised to see Sterling hold soon and gradually make up some ground. See those bids around 2720 and 2700.
May 29, 2024 at 2:19 pm #6975May 29, 2024 at 1:44 pm #6974May 29, 2024 at 1:30 pm #6973USDCAD 1 hour CHART – RISK OFF
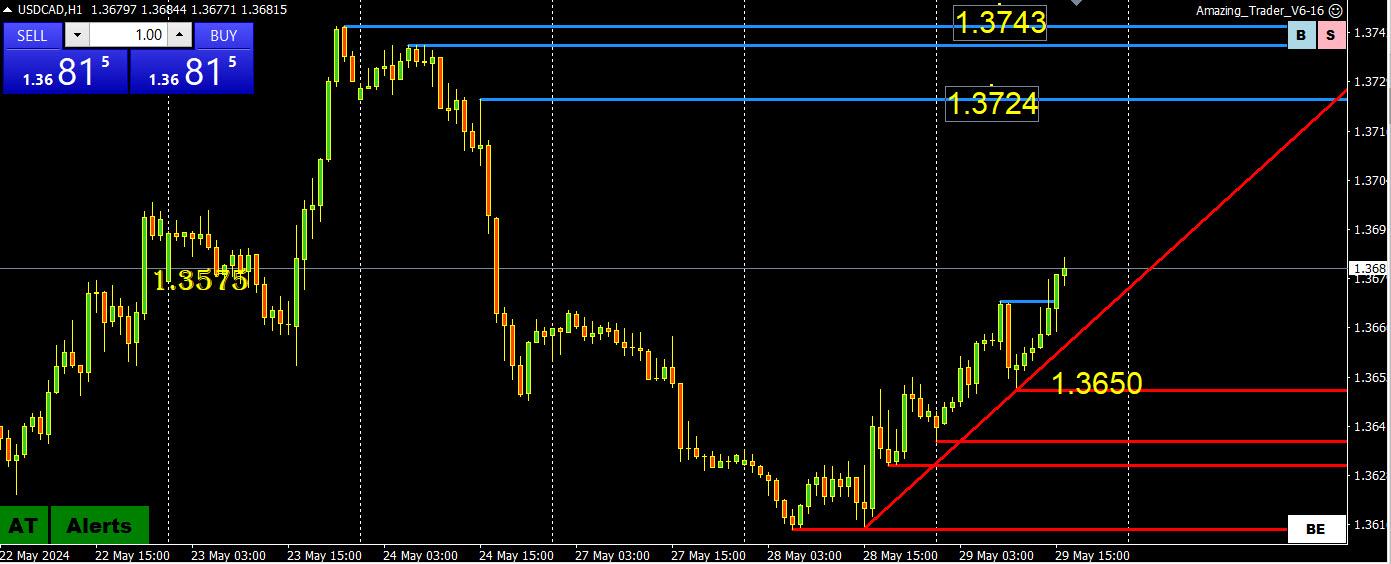
A risk off tone in equities is weighing on commodity currencies.
As can be seen on this chart, rising red AT lines are showing up momentum with support while above 1.3650.
However, there is a void of key levels on top until above 1.37, which means no obvious stop levels to go after, making the high of the day the closest resistance.
-
AuthorPosts


- You must be logged in to reply to this topic.
Search
© 2024 Global View