
- This topic has 28,092 replies, 54 voices, and was last updated 7 hours, 38 minutes ago by GVI Forex 2.
-
AuthorPosts
-
June 3, 2024 at 2:07 am #7151June 2, 2024 at 11:55 pm #7150
THIS WEEK’S MARKET-MOVING EVENTS (all days local)
Despite some talk it might hold steady, the Bank of Canada is expected to begin cutting rates on Wednesday with an incremental 25-basis-point move. There is no uncertainty at all that the European Central Bank will begin cutting rates, also by an expected 25 basis points on Thursday. The Reserve Bank of India on Friday is expected to hold its policy rate steady.
Eurozone retail sales on Thursday are expected to show slowing monthly growth, while German manufacturing orders on Thursday and German industrial production on Friday are both expected to rebound modestly from prior declines.
Moderate growth is the call for both US and Canadian employment on Friday. US nonfarm payrolls are expected to rise 195,000 with average hourly earnings seen up 0.3 percent on the month for a steady annual rate of 3.9
Econoday
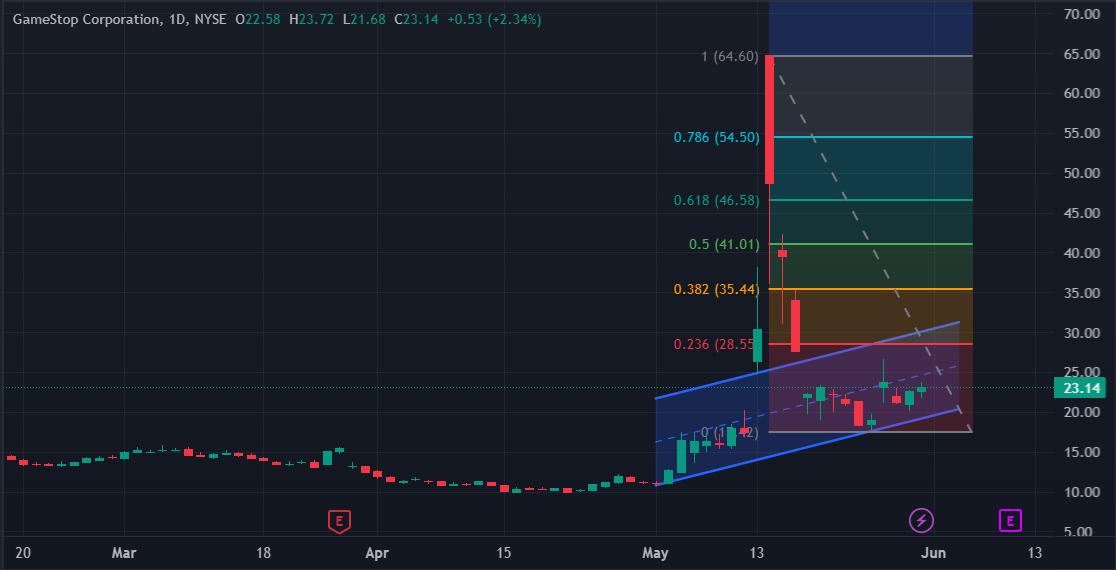
June 2, 2024 at 10:10 pm #7148June 2, 2024 at 4:56 pm #7147GME (NYSE) GameStop Corp. is considered the king of meme stocks and most of the investing literature that can be found around the stock revolves around its meme feature.
The purpose of this discussion is to present an analysis of the company’s fundamentals beyond its fading meme feature. Indeed, GameStop is a business with shrinking sales and a falling investor base. At a current price-earnings ratio of above 1,000, the potential meme premium in its valuation is unsustainable in the absence of the retail investors’ euphoria that existed in 2021. The business continues to decline and the possibility for the stock to become unlisted at some point in the future is real.
 June 2, 2024 at 4:50 pm #7146
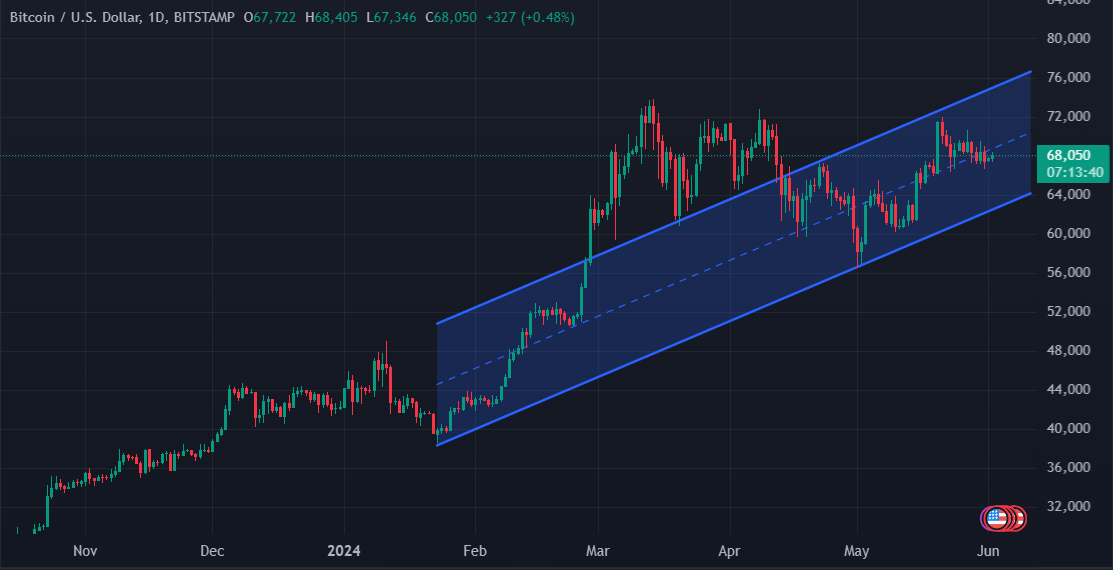
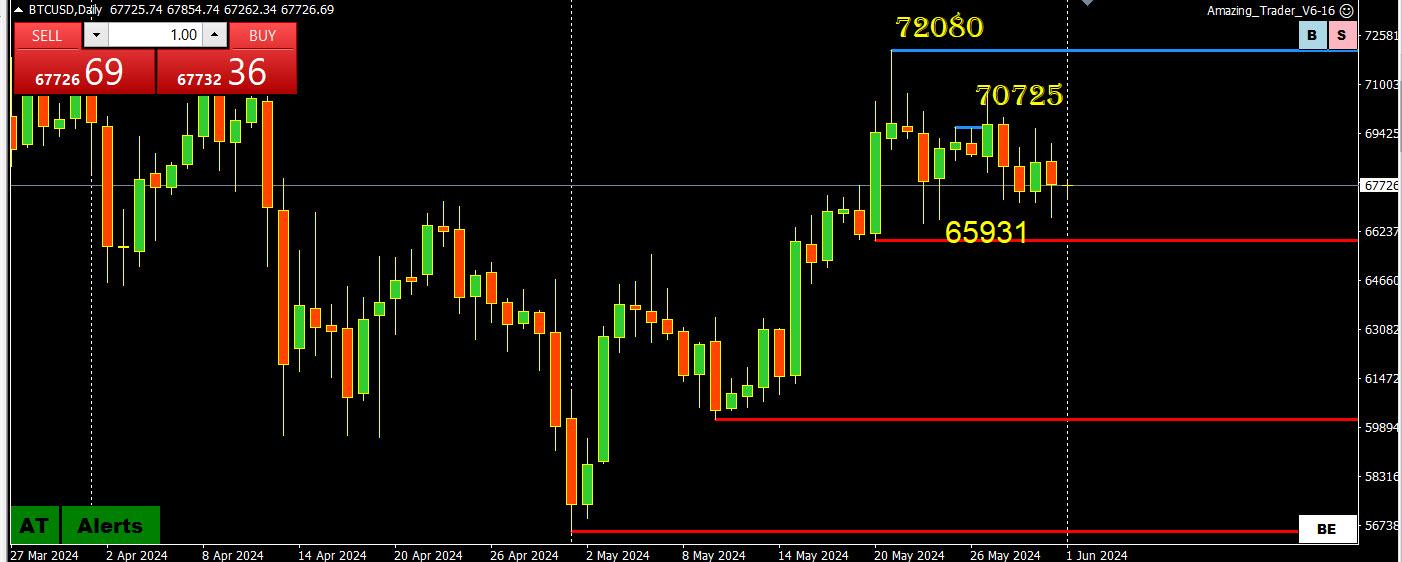
BTCUSD – Bitcoin
The price of Bitcoin appears to have returned to a choppy market condition, quashing any hopes of a breakout to new highs soon. However, the good news is that the current bull cycle may still not be over, even though it is taking a while for the premier cryptocurrency to resume its upward momentum.
Specifically, the latest on-chain observation shows that Bitcoin has been going through a “euphoria wave” over the past few months.
 June 2, 2024 at 4:44 pm #7145
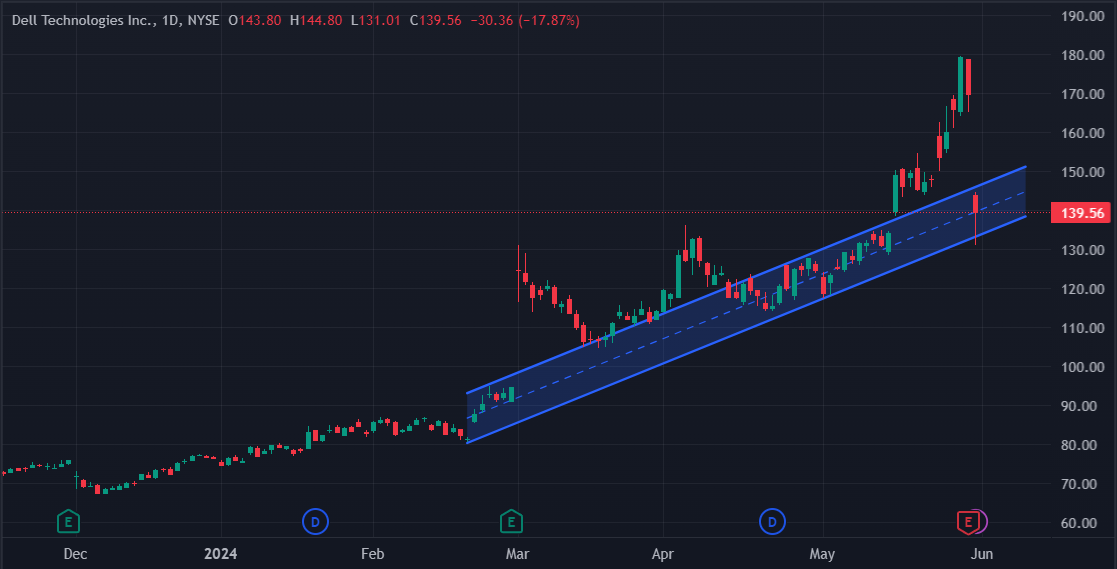
Dell Technologies DELL shares experienced a decline Friday afternoon despite reporting better-than-expected Q1 financial results.
Dell Technologies reported a 6% year-over-year increase in revenue, reaching $22.24 billion and surpassing the consensus estimate of $21.67 billion. The company also reported adjusted EPS of $1.27, slightly ahead of estimates of $1.26.
 June 2, 2024 at 2:33 pm #7144June 2, 2024 at 12:21 pm #7137June 2, 2024 at 12:01 pm #7136June 2, 2024 at 10:51 am #7133June 2, 2024 at 9:42 am #7131
AUDUSD DAILY CHART – CONSOLIDATION AS WELL
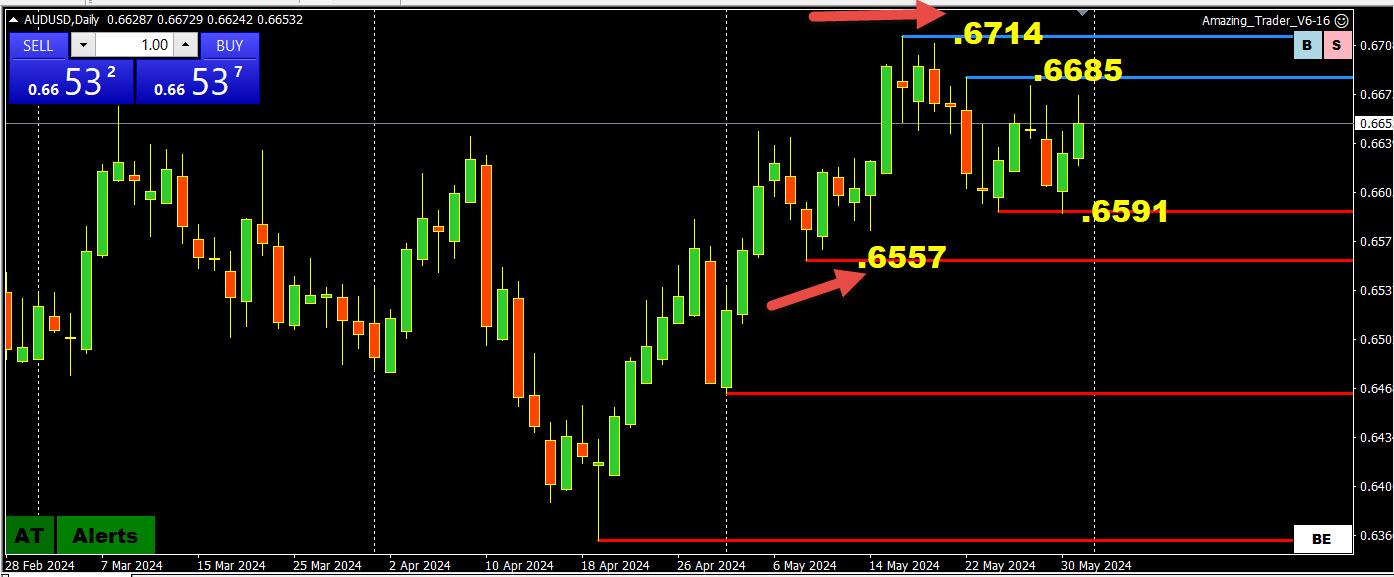
If you take a step back here as well you will see that the AUDUSD uptrend is still inatct but consolidating after setting a high at .6714 12 days ago.
Key levels are highlighted on the chartt: .6714 on top, .6557 on the downside. Only a break of ,6557 would confirm a break of the uptrend.
Consolidation range is also shown on this chart.
As we start a new month mark down the prior month’s range (.6454-.6714) as a reference.
June 2, 2024 at 9:32 am #7130USDJPY DAILY CHART – CONSOLIDATION BELOW KEY HIGHS
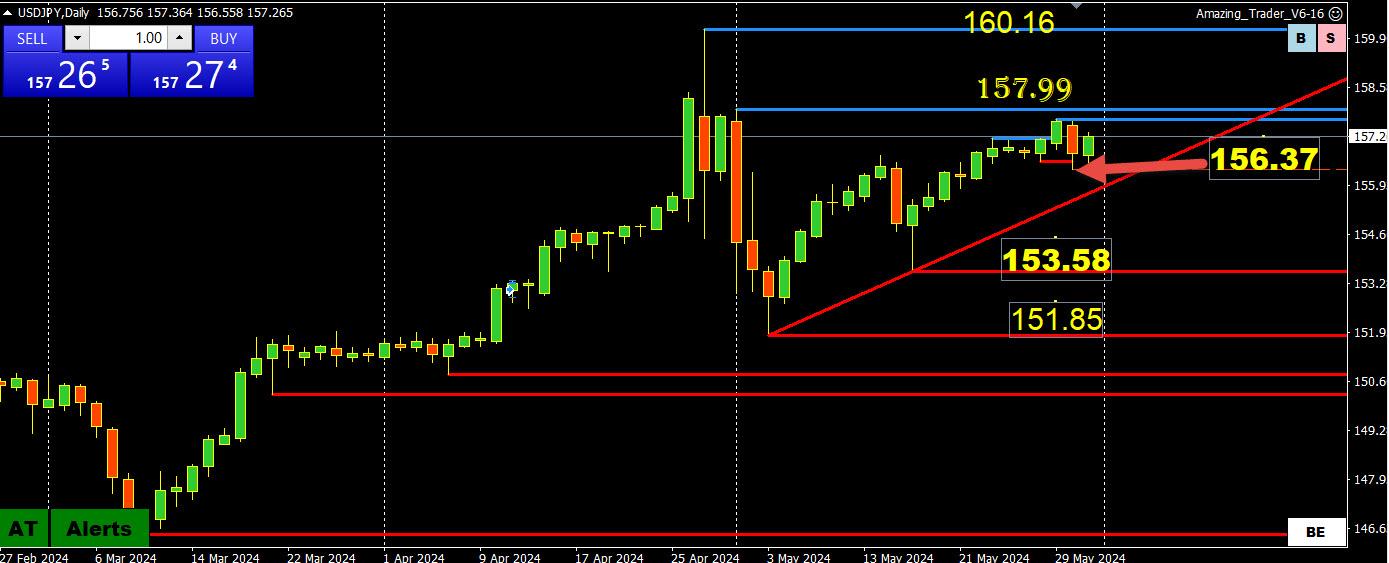
If you take a step back and look at the daily chart you will see that USDJPY spent the month of May trading below the 160.16 high and almost the entire month below 157.99.
As I have been saying, if I was in the BoJ’s shoes I would want to keep it trading below 158.00 lest the focus shift to 160.16 if above it,
There have been bouts of what seems like interventiion (not confirmed) that found support on deep dips (last one was at 156.34).
On the downside, it is easier to focus on the midpoint of 150-160 and use 155 as the pivotal level to set the tone within this range (finds support while above it).
On the upside, expect a limit if it stays below 158.
Normally I would say mark down the prio month;s range but in this case mark down 151.85-160.16.
June 1, 2024 at 10:52 pm #7129Given the way markets have been trading, this is a week where the reaction to news will be more important than the news itself.
Central bank meetings
US data
See our Economic Calendar and/or scroll down and click on the Week Ahead report.
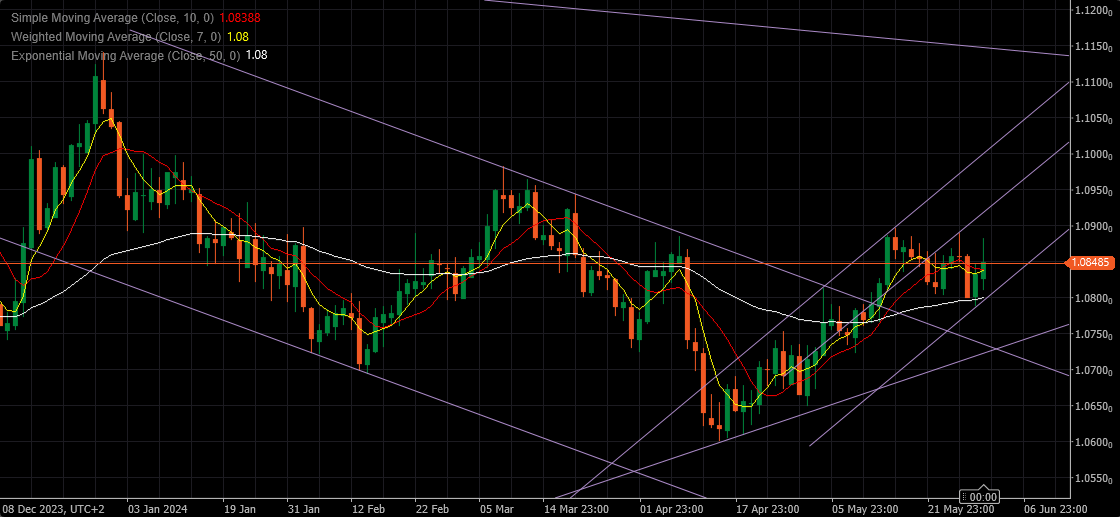
June 1, 2024 at 4:57 pm #7128June 1, 2024 at 4:14 pm #7127June 1, 2024 at 3:39 pm #7126June 1, 2024 at 2:54 pm #7125EURUSD Daily
Lots of action on Friday, but situation is not really crystal clear, yet.
Supports come at 1.08400, 1.08200 & 1.08050
Resistances at 1.08700, 1.08900/1.09000 & 1.09250
I can see it breaking Up on Monday, but am worried about that third lower uptick from Friday…
Let’s both options sink in till Monday and we’ll follow it intraday.
 June 1, 2024 at 10:39 am #7122June 1, 2024 at 10:33 am #7121
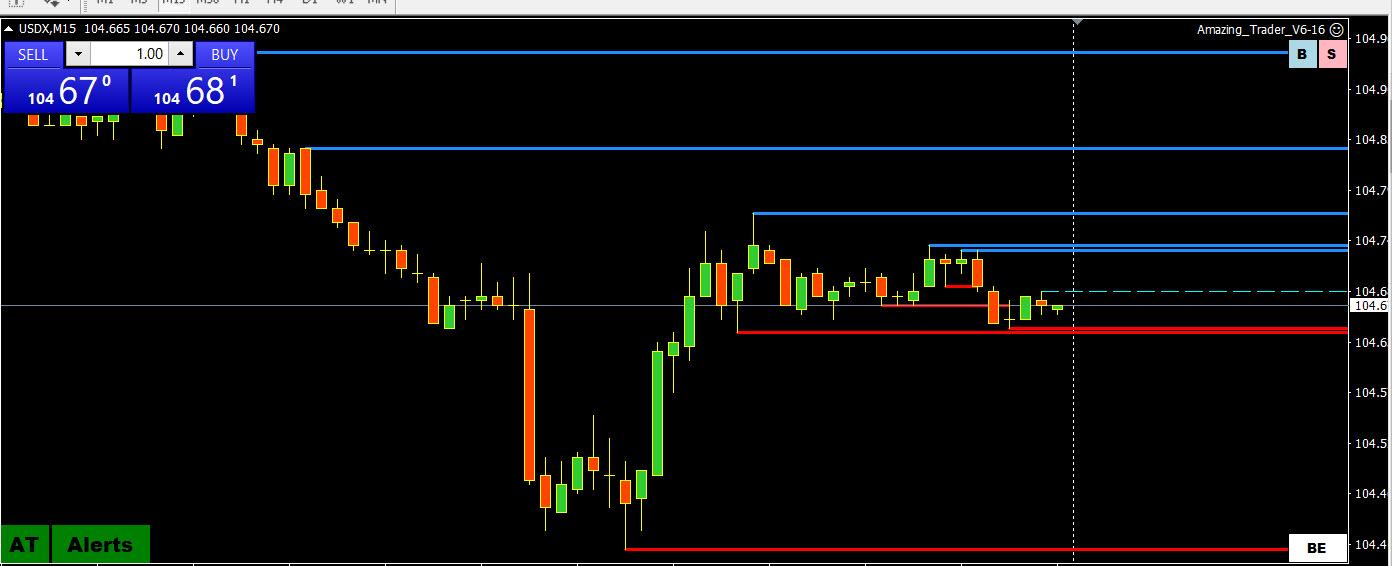 USDZ 15 MINUTE CHART – EURUSD PROXY (57.6% OF THE INDEX)
Why am I posting a 15-minute chart on a Saturday?
The reason is to show how the index ended the week in a well-defined range, reflecting how EURUSD settled into one trading around the neutral 1.0850 level.
Keep an eye on this level into the new week unless either side of 1.0801.09 is decisively broken.
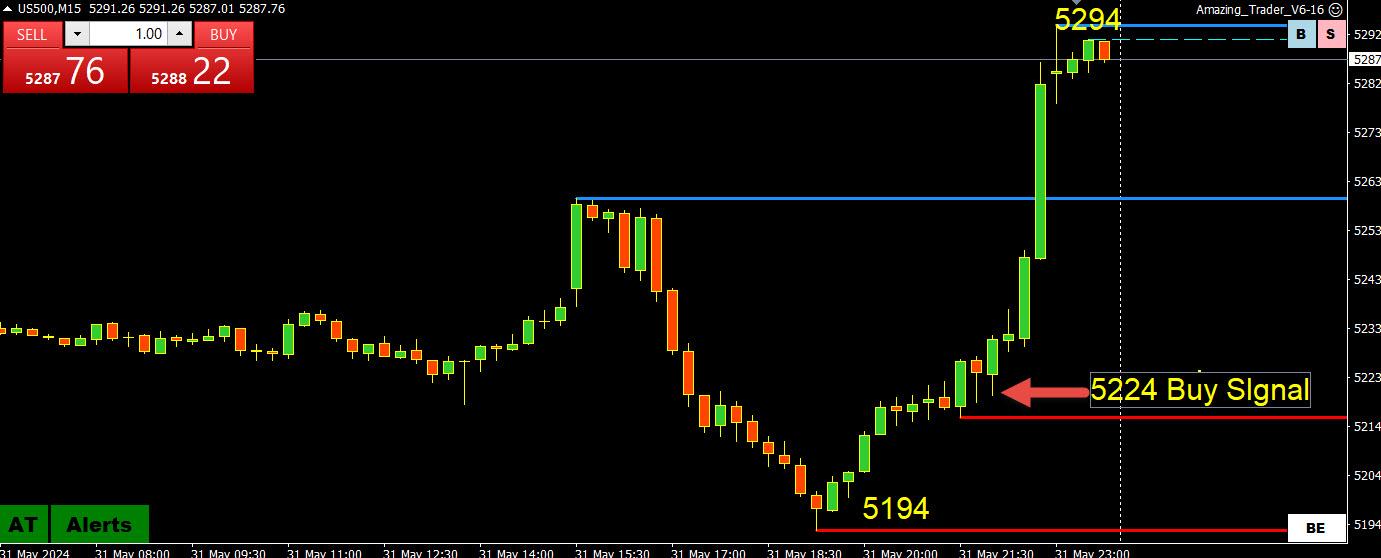
June 1, 2024 at 10:25 am #7120May 31, 2024 at 7:15 pm #7113May 31, 2024 at 6:11 pm #7106May 31, 2024 at 5:45 pm #7105US500 DAILY CHART UPDATE – WHY LEVELS MATTER
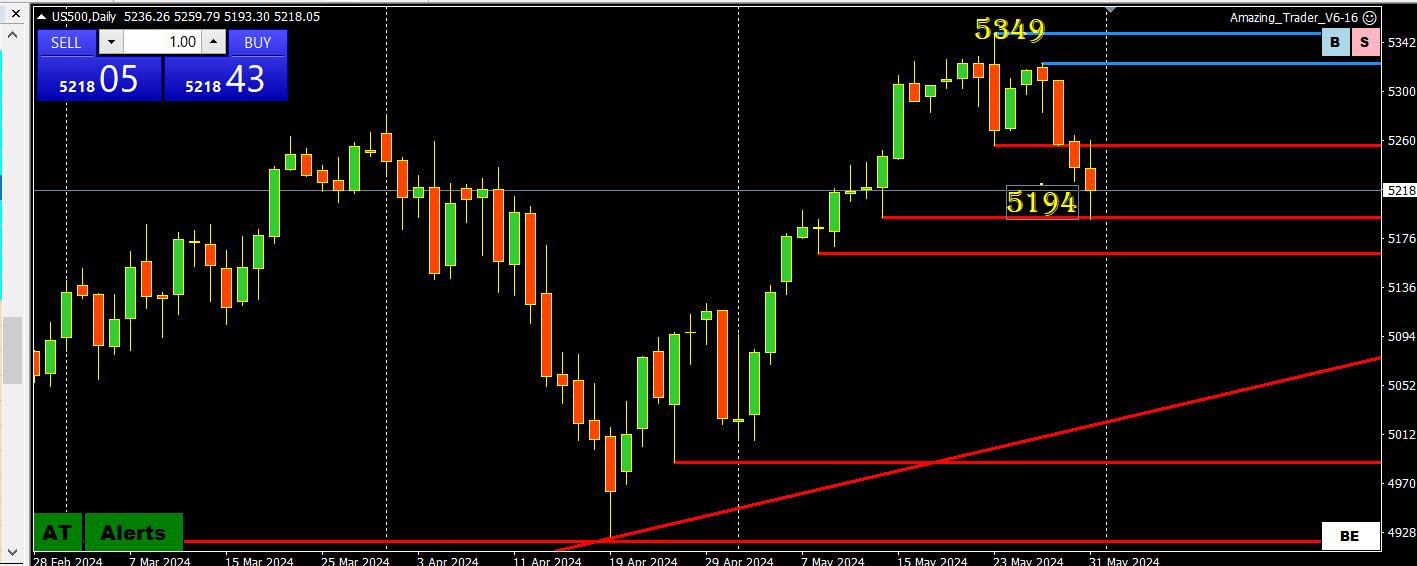
A strength of my creation, The Amazing Trader charting algo, is the levels on its charts. I created it and it still amazes me how well the levels work.
Look at this US500 chart, which reached my 5200 target and its low was dead on at the Amazing Trader key 5194 chart support.
May 31, 2024 at 5:43 pm #7104May 31, 2024 at 5:32 pm #7103May 31, 2024 at 5:25 pm #7102May 31, 2024 at 5:08 pm #7101May 31, 2024 at 4:50 pm #7100May 31, 2024 at 4:40 pm #7099May 31, 2024 at 4:11 pm #7098 -
AuthorPosts

- You must be logged in to reply to this topic.
Search
© 2024 Global View