
- This topic has 28,092 replies, 54 voices, and was last updated 8 hours, 33 minutes ago by GVI Forex 2.
-
AuthorPosts
-
June 7, 2024 at 9:19 am #7395
XAUUSD 4 HOUR CHART – CHINA STOPPED BUYING
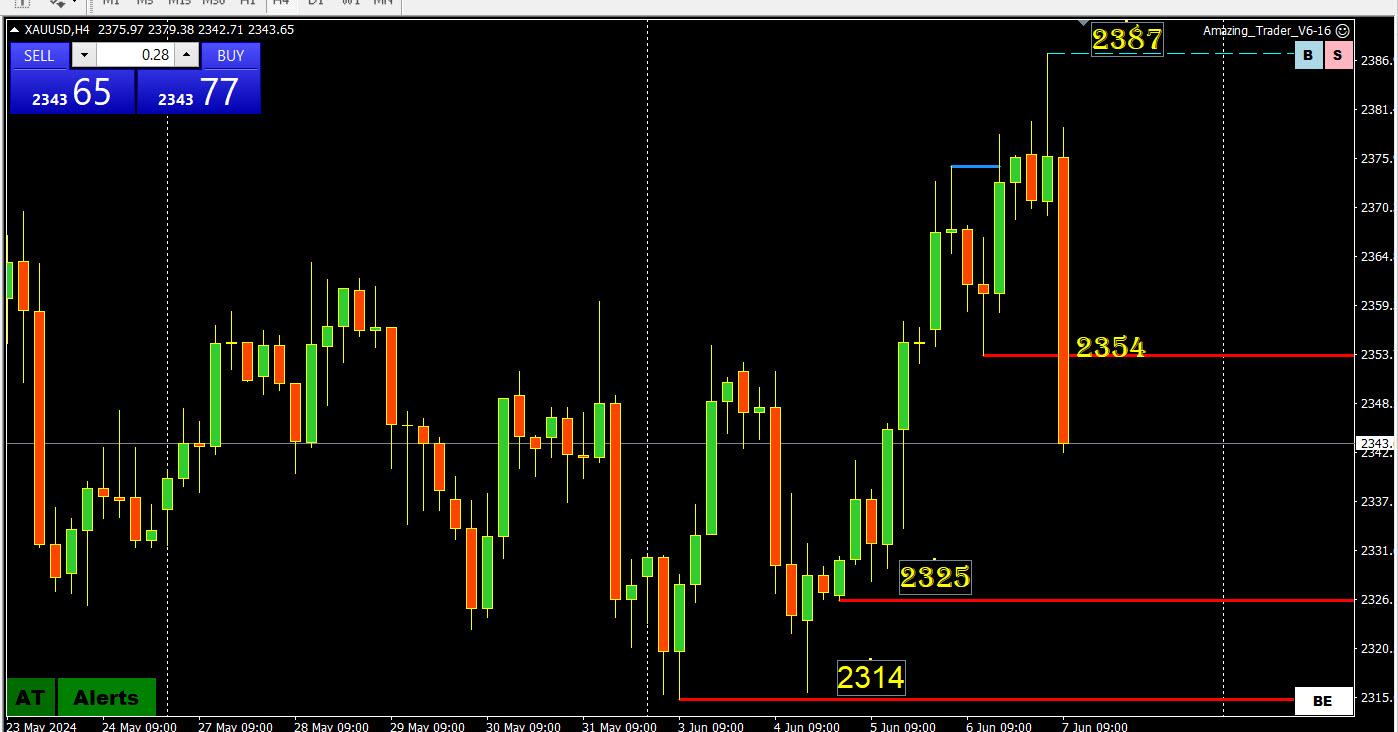

As can be seen on this chart, XAUUSD tumbled afer news reports that China’s central bank didn’t buy any gold in May, ending a massive gold buying spree that had run for 18 months after the precious metal surged to a record high.
This leaves the market in a quandry after the breakout to the upside saw a quick retreat on the news.
For the risk to shift back to the downside and the 2314 bottom of the range, XAUUSD would need to stay below 2354.
June 7, 2024 at 9:19 am #7394XAUUSD 4 HOUR CHART – CHINA STOPPED BUYING

As can be seen on this chart, XAUUSD tumbled afer news reports that China’s central bank didn’t buy any gold in May, ending a massive gold buying spree that had run for 18 months after the precious metal surged to a record high.
This leaves the market in a quandry after the breakout to the upside saw a quick retreat on the news.
For the risk to shift back to the downside and the 2314 bottom of the range, XAUUSD would need to stay below 2354.
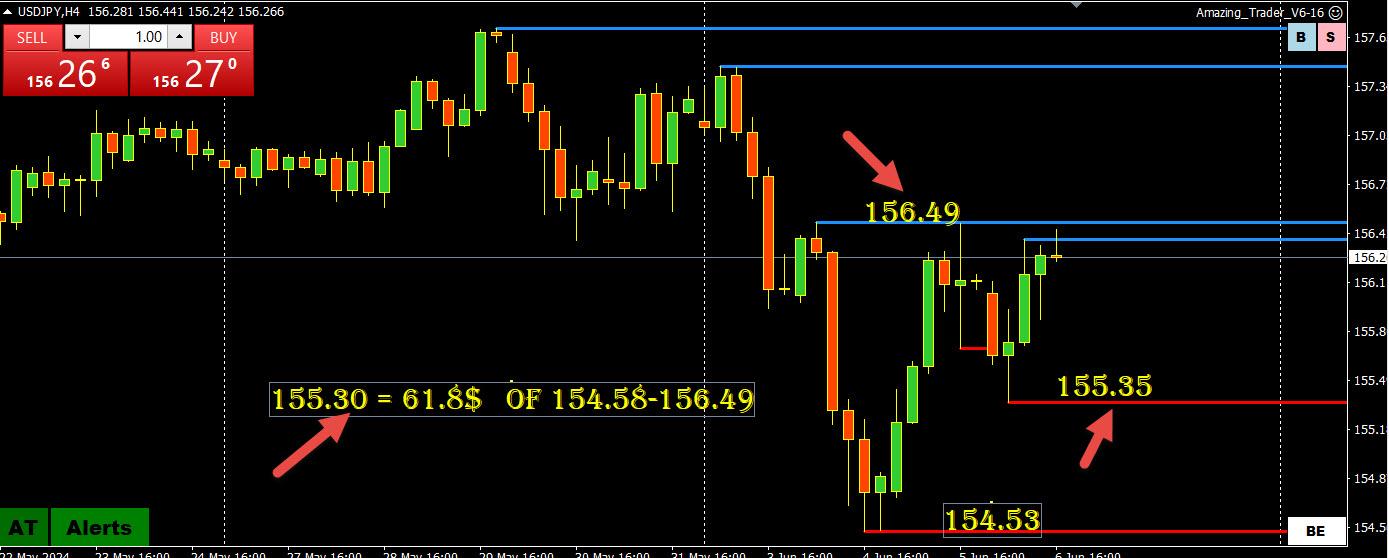
June 6, 2024 at 11:55 pm #7389June 6, 2024 at 10:35 pm #7388June 6, 2024 at 10:32 pm #7387USDJPY 4 HOUR CHART – ON THE ROPES?
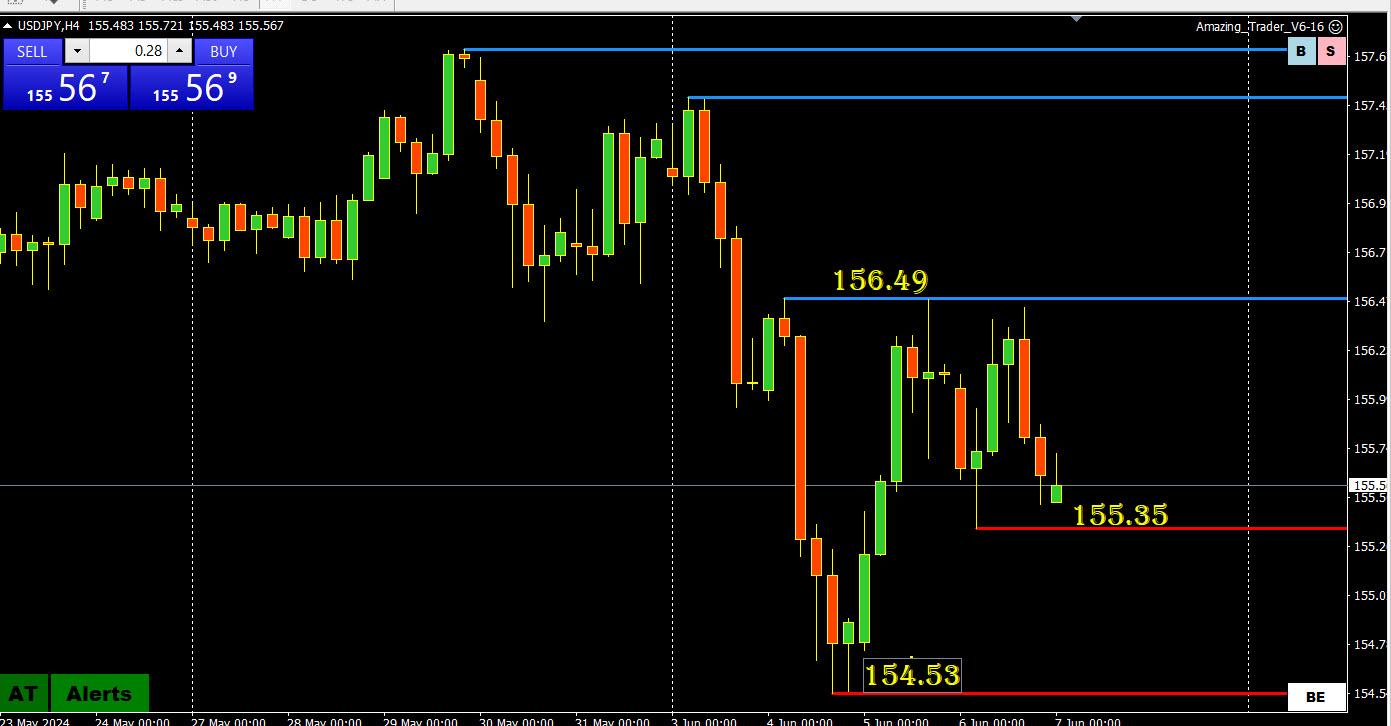
USDJPY following lower US yields and a generally weaker USD.
‘
This has USDJPY staying on the defensive as long as it trades below 156.49This sets the stage for a key Friday where the reaction to the US jobs report will dictate whether sub-155 can be established for a more serious run to the downside.
June 6, 2024 at 7:11 pm #7386NAS100 4 HOUR CHART -no reason to guess
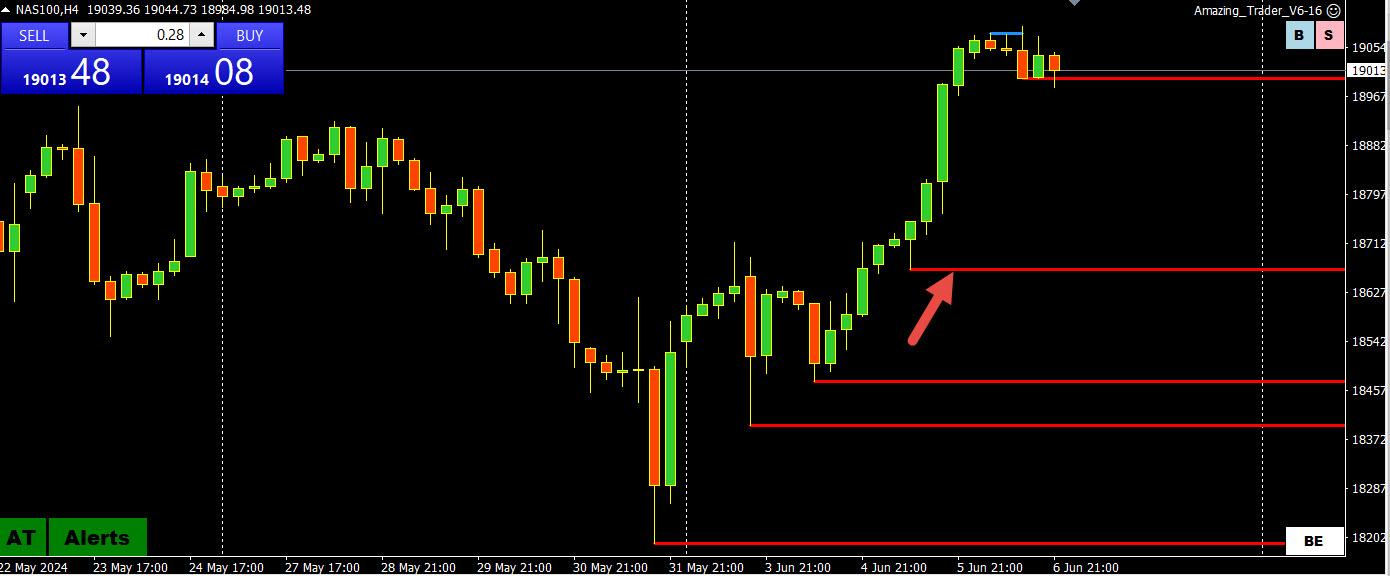
As I have been noting there is noireason to guess at a top unless there is a reason to do so.
On this chart I pointed out a level that would need to be broken to signal a pause.
On the upside, the only resistance worth noting is the most recent set record high.
June 6, 2024 at 6:32 pm #7385June 6, 2024 at 6:28 pm #7384June 6, 2024 at 6:28 pm #7383June 6, 2024 at 6:21 pm #7382June 6, 2024 at 5:41 pm #7381June 6, 2024 at 3:54 pm #7380Gold up at 2377
–
Biden saysBiden reveals if he will ever let Ukraine use American missiles to strike Moscow or the Kremlin and dodges question on whether US weapons have already been fired inside Russia
The full interview with Biden will air Thursday at 6:30 p.m. on ABC’s World News Tonight with David Muir program.
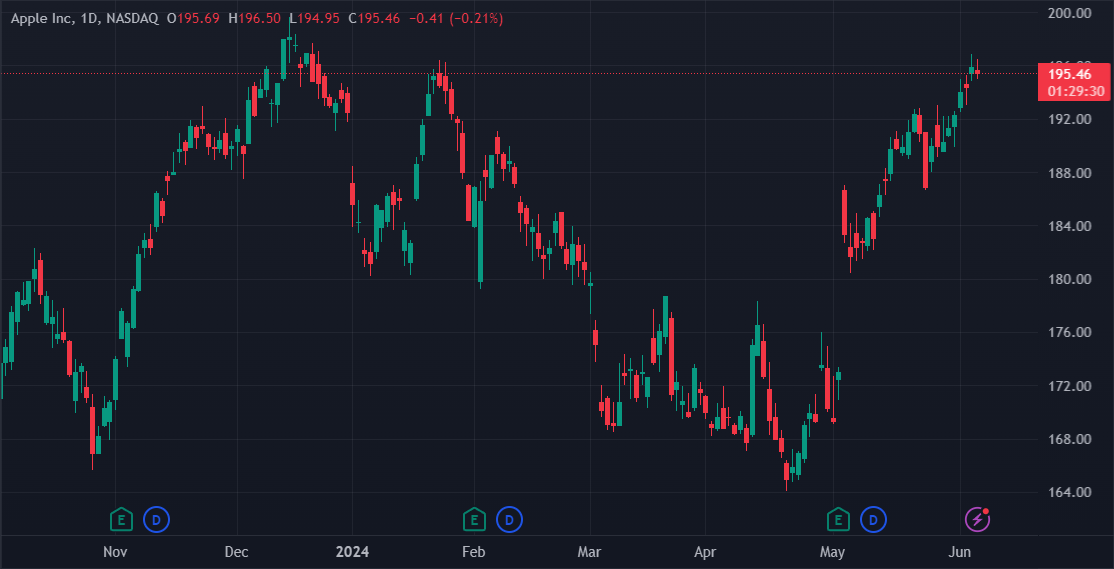
June 6, 2024 at 3:50 pm #7379June 6, 2024 at 3:09 pm #7378A component to watch – If JP Morgan holds selling interest at 192 stocks are going straight up for a near term duration and would be sound a reflection of market interest. Currently 196.90 and under pressure. It can get there in a day. Euro would at a minimum benefit in terms of selling being not overly robust. Some say there is more to trading Euro than your MACD and moving averages.
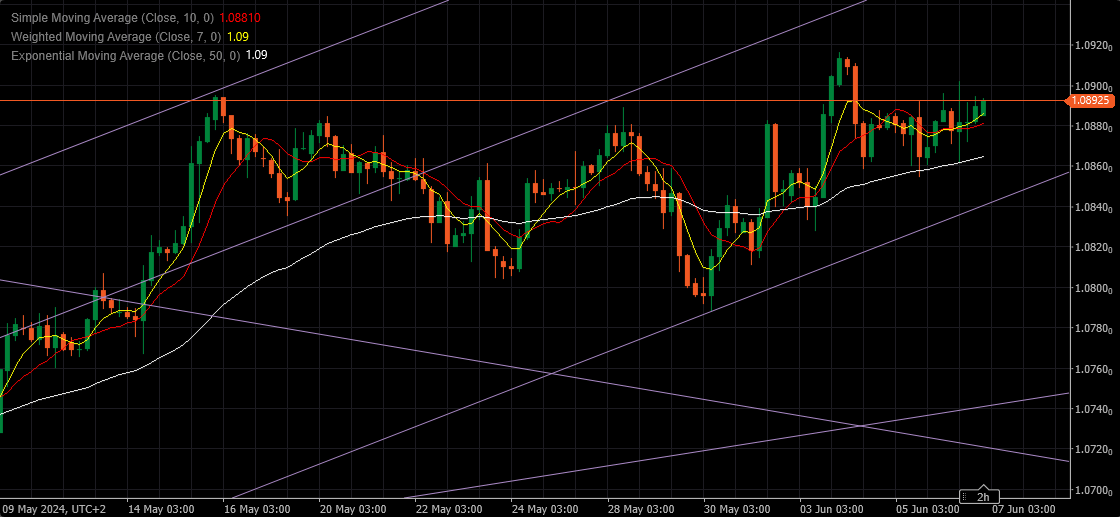
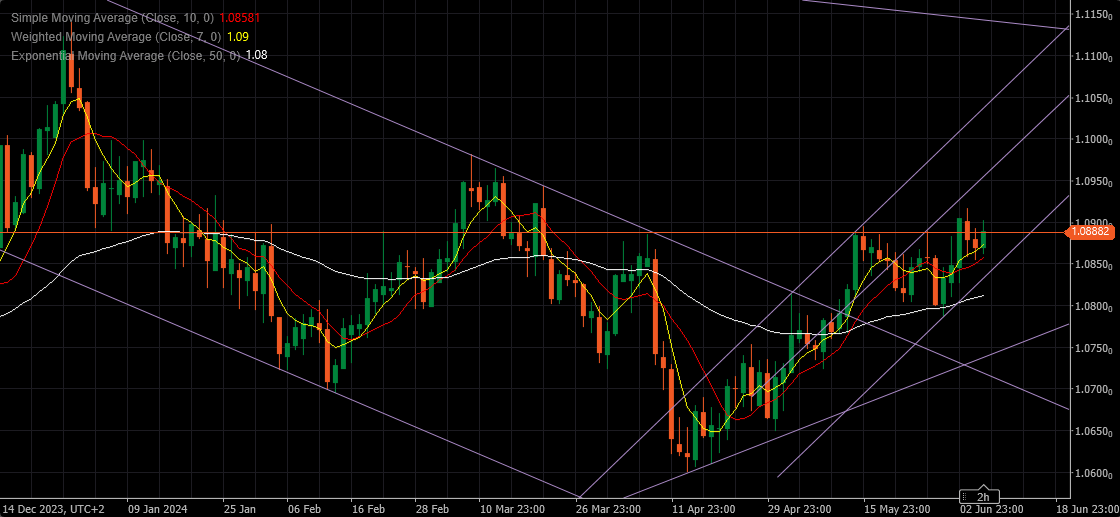
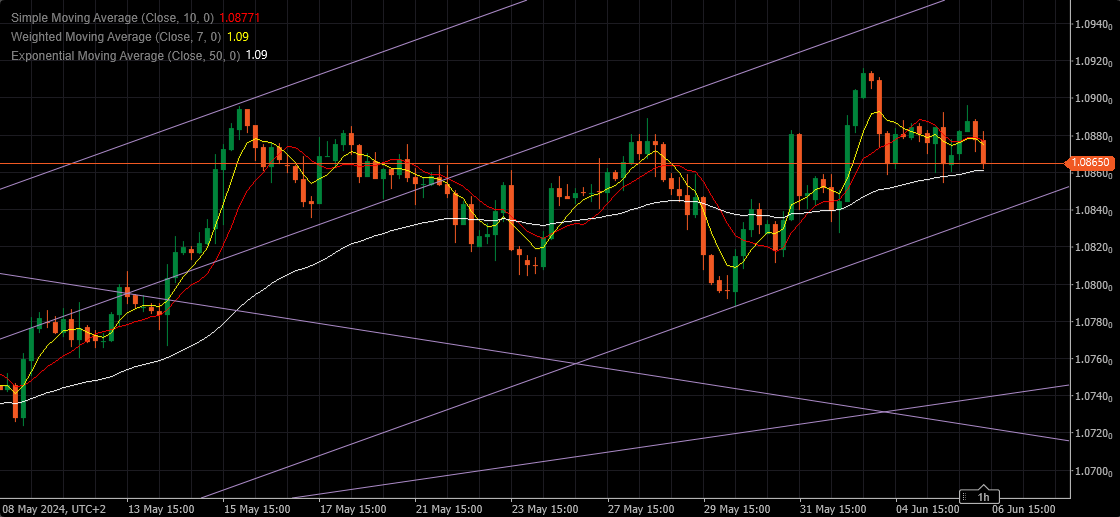
June 6, 2024 at 2:53 pm #7377June 6, 2024 at 2:42 pm #7376June 6, 2024 at 2:18 pm #7375EURUSD DAILY CHART – 17 DAYS AND COUNTING
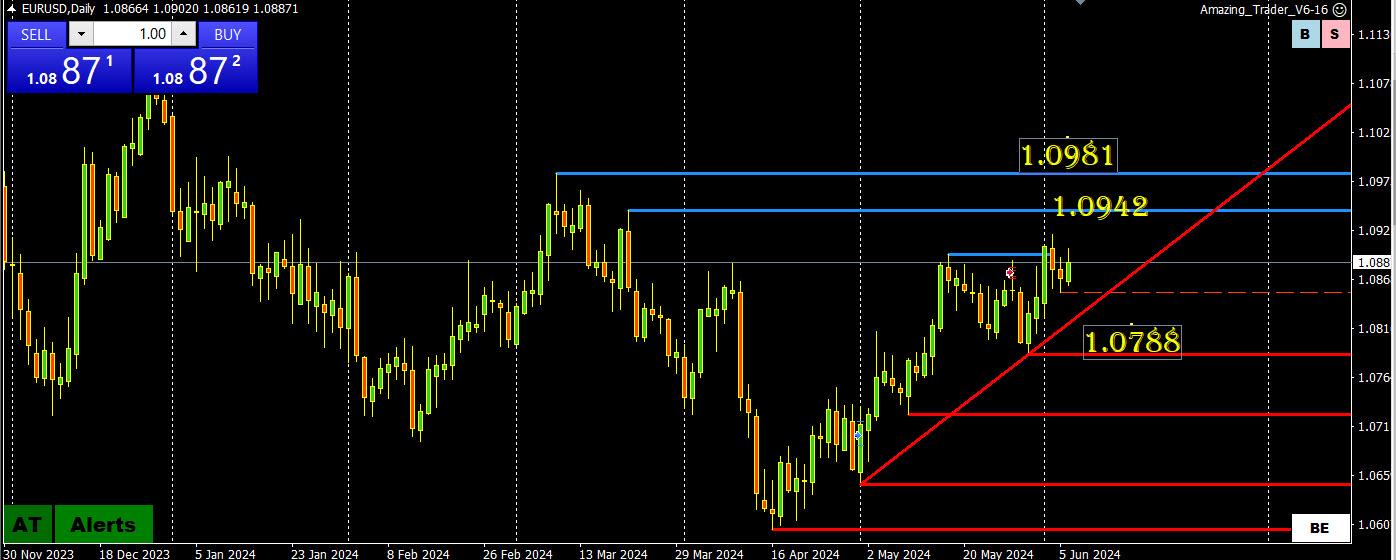
EURUSD has been trading with ony a few exceptions in a 1.08-1.09 range FOR 17 DAYS IN A ROW.
This pattern will not go on foreever and while this chart shows a risk for an eventual move higher, during this period trading the range has worked better than betting on breakouts.
‘
.June 6, 2024 at 1:56 pm #7374June 6, 2024 at 1:47 pm #7373June 6, 2024 at 1:43 pm #7372June 6, 2024 at 1:42 pm #7371
The focus now shifts to the US jobs report on Friday where markets will be hoping fpor a miss to continue to trends seen this week.
From Newsquawk
US JOBS REPORT (FRI): Analysts expect the pace of monthly payrolls to pick up a touch in May; the consensus expects 180k, according to Bloomberg, vs the prior 175k (vs the three- and six-month average of 242k, 12-month average of 234k)….
June 6, 2024 at 1:35 pm #7370June 6, 2024 at 1:25 pm #7368June 6, 2024 at 1:14 pm #7367June 6, 2024 at 1:12 pm #7366June 6, 2024 at 12:36 pm #7364June 6, 2024 at 12:31 pm #7358June 6, 2024 at 12:19 pm #7357June 6, 2024 at 12:00 pm #7356June 6, 2024 at 11:59 am #7355 -
AuthorPosts

- You must be logged in to reply to this topic.
Search
© 2024 Global View