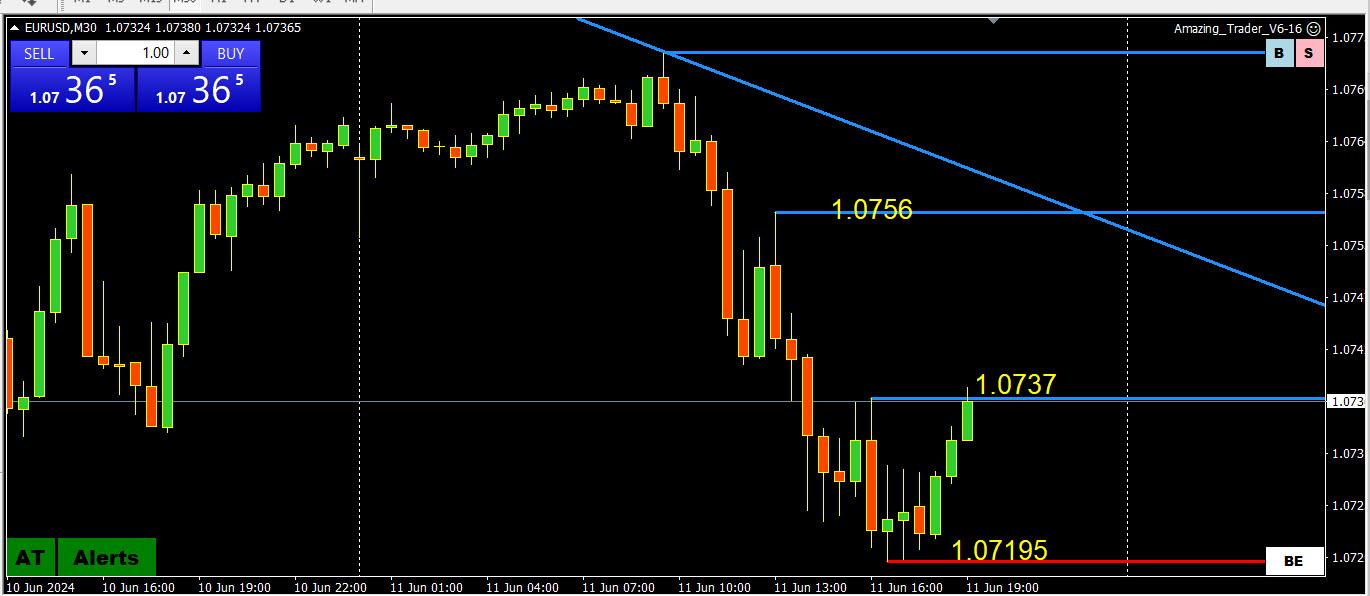
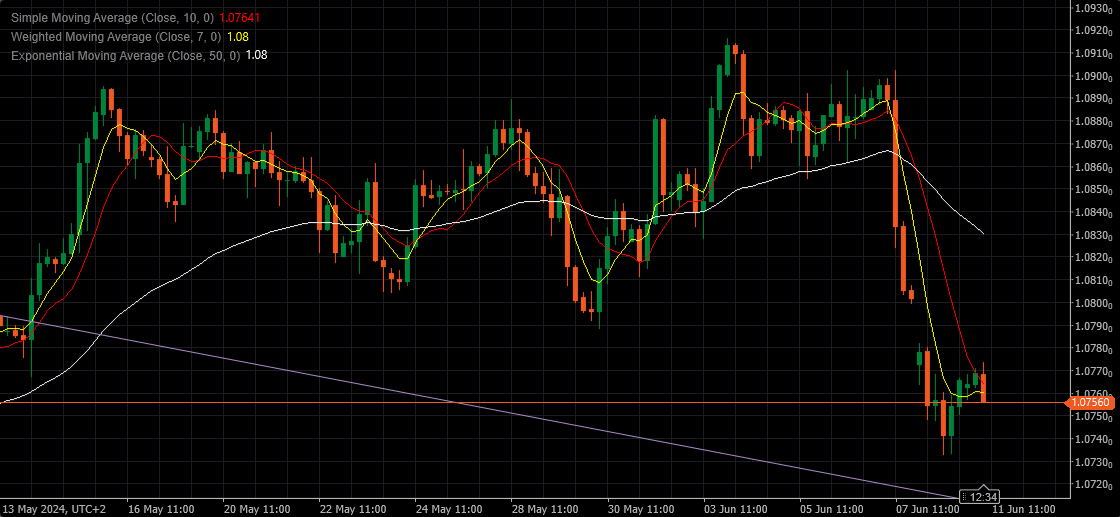
EURUSD 30 MINUTE CHART – Too tight to last

EURUSD testing upside but would need to get through 1.0895 to break the current range.
As this 30 minute chart shows, it has been trading in a 9-pip range for over 2 hours, one so tight that it will not last for much longer (the intra-day range has so far been just 20 pips, 1.0860-80)
So there is nothing to get excited about the upside unless 1.0895 is decisively taken out.
Otherwise, look for 1.o850 tp continue to set its intra-day tone.
ECB Consumer Expectations Survey (Apr) – 12 month inflation 2.9% (prev 3.0%), 3-tear ahead 2.4% (prev 2.5&); growth outlook less negative and labour market seen stable.
Source; Newsquawk.com
A look at the day ahead in European and global markets from Tom Westbrook
The European Central Bank publishes inflation expectation surveys on Tuesday, which along with policymaker speeches are the highlight of an otherwise quiet calendar
Thanks Bobby on your 8:38pm post, and sincere congratulations for making it that far.
As noted by BMO Capital Markets chief investment strategist Brian BelskiIn years where the S&P 500 rallies more than 8% in the first five months of the year, as it just did, the index gains more than 7% to finish the year 70% of the time. Euro should ordinarily benefit if such a percentage sticks this year. So regardless of inflation effect, rates of decline in pullbacks, interest rates, or anything else such as economic slowdown, that is something to consider. The bottom line is what is the market doing this week for most active participants.
For those who transact on bi-weekly or longer time frames the options markets, sovereign, and bank positioning matters a bit more. For those who are tuned to larger time frames then the economics matter in different ways and so you have 10,000 economists saying the age old phrase “on the other hand.”
EURUSD failed to break 1.0863
Last 1.0842
The only news I have seen
ECB’s Villeroy said that a June interest rate cut is a done deal barring a surprises
His comments are not a surprise – the focus should be on what comes next in terms of rate cuts
If you are trading today it is like you are trading with yourself.
USDX 4 HOUR CHART – EURUSD PROXY?

As I noted, with EURUSD representing 57.6% of the index, it often acts as a proxy for the currency.
In this chart, the highlighted red AT line being broken would need to be sustained and then confirmed by a solid EURUSD move above 1.0863 to suggest a potential shift in direction or at least a loss of upward momentum
EURUSD 4 HOUR CHART – TOO TIGHT A RANGE TO LAST FOR TOO LONG’

The best I can say in this holiday-thinned session is how EURUSD ends the week is more important than how it starts.
I can also say that the current 1.0805-1.0895 range is too tight to last for too long.
Is it a coincidence that 1.085, the intra-day bias setter, is also the midpoint of the current range?
Otherwise, chart levels are clear as indicated on this chart.
‘
Let me state from the outset that the forex market is one of limits. It’s a fickle market more prone to intra-day reversals than breakouts and sustained moves.
This is why I look at the forex market as trading in episodes rather than trends.
Why You Need to Focus on Trading Episodes and Not Trends

THIS WEEK’S MARKET-MOVING EVENTS (all days local)
The week’s inflation news will start with Australia on Wednesday where no meaningful improvement is expected at 3.4 percent for April. Wednesday’s consumer price data from Germany are expected to accelerate but remain with quiet looking 2 percent handles. Eurozone HICP flashes for May are also expected to look normal, at 2.5 percent overall and 2.7 percent for the narrow core. Tokyo consumer prices are expected to firm in May following a jolt lower in April on special factors.
Other Japanese data will include industrial production and retail sales, both on Friday. China’s CFLP PMIs on Friday are expected to hold steady in data for May. Monthly GDP from Canada is expected to stall in March though the first quarter as a whole is seen posting respectable growth of 2.3 percent.
Econoday
US PCE and month end on Friday could make it an active end to the week.
In the never-ending supply of Doomsday callers on the net, sooner or later one will be right…ONE…and it does happen every now and then ( like every 25 years or so) , and will give a wind in the sails of others impostors that lurk around our markets…
Problem is that overall majority of participants are ignorant (fools ) , that believe there is a conspiracy going on that prevents them from getting rich over night and pose in front of the Ferrari , with Rolex on one hand and two blondes on the other…
One of the first things that I learned early on in this byz is that positioning yourself based on the expected top or bottom most of the time runs your margin dry…
Later on, I had to force myself to ignore completely those expectations to be able to catch a good trade in opposite direction of it…that was probably even harder…
Today, as you can see I always separate my own opinion /expectation from what the charts are telling me – said it thousand times: I don’t trade my opinion ( and I have over 30 years of experience…then I might be just your average IQ guy)
You told them the truth Monedge – even they don’t like it , so……. – Jay warned me against the profanity, but you know what comes next 😀
I was allowed to post this on Marketwatch last week (which was edited) in response to a known Top/Bottom/Doom/Sky is the limit Superhero caller saying the “top” is in and the sky is about to fall in markets. They said what I posted belongs on Barings as well so I thought I would share it here as well, and so I said this …
I ran an investment firm and we had unusually good returns. Being the President I had to take a good look at common sense early on though when it was apparent what used to work no longer was. Though some are very good at it, I discovered, among other things, was that calling tops/bottoms is a recipe for an early vacation on a deserted island with no money. There is a long graveyard of top and bottom callers. Flashy but you had better be accurate. Markets are a window into a mass of humanity trying to deploy a mass of agendas.
Yet, there is a rythm to it and markets are very cyclical no matter the time frame of interest. If you are losing money you either don’t have enough time or haven’t figured some things out yet.
In our opinion at Monedge (.net), US stock markets are bid overall, yields are here for longer, the US Dollar is strong overall for now, and that is it. What is happening today is what matters.
If they sky falls you will know. Why prognosticate trying to look like the next Oracle of Wall Street? Unless you are trying to impress your boss or make conversation, it might not be pragmatic.
Hear Ye Hear Ye
jeff cox:
The Fed probably won’t be delivering any interest rate cuts this summer
* It looks increasingly unlikely that the Federal Reserve will be cutting interest rates after a batch of stronger-than-expected economic data coupled with fresh commentary from policymakers.
* Economic growth is at least stable if not on the rise, while inflation is ever-present.
* Central bankers still lack the confidence to cut and even an unspecified few say they could be open to hiking if inflation gets worse.
You have seen me post my charts with red and blue lines forming patterns. This is the Amazing Trader charting algo. Let me show you how it all began and then evolved in

Trade like a pro
How can you make sure you trade like the professionals? One of the best ways is to make sure you treat your trading like a business. You need to be sure that when you are trading you are trading; it is not for fun or speculation, but to make money.
We have some tips and ideas to help you make that a reality.
Trade like a Pro – 8-STEP CHECKLIST TO DETERMINE IF YOU’RE TREATING TRADING LIKE A BUSINESS

Trade like a Pro – 8 STEP CHECKLIST TO DETERMINE IF YOU’RE TREATING TRADING LIKE A BUSINESS
USDJPY WEEKLY CHART – UPTREND SINCE THE START OF 2023

USDJPY has been in a weekly uptrend since the start of 2023, which elevates the importance of its weekly trendline. There is already a 10% range from the low to the high this yeasr
Where is the risk?
While the techincal risk is still pointed up (note the trendline), the volatility risk is if the currency reverses to the downside. However, betting on intervention or other policy moves to reverse the trend is expensive given the cost of a rollover being long JPY, pitting those trading on hope vs. those trading on fundamentals.
To keep it simple,
152.92 = 50% of this year’s range and 151.91 is last year’s high.
To make it even simpler, USDJPY trades with support as long as it stays above 155 and only sub-150 trade would suggest the high is in.
On the upside, levels are clear
158.00 and 160.16
This suggests 158-160 would be the intervention alert zone.
I haven’t mentioned JPY crosses, where there is less chance of intervention.
EURUSD WEEKLY CHART – INSIDE YEAR

I remember when central banks used to look at 10 big figure ranges, such as EURUSD 1.00-1.10, 1.05-1.15. 1.10-1.20
Looking at this weekly chart not only is the range less than 10 big figures but is also so far an inside year.
Taking it one step further, 50% of the 2023 range is 1.0860 vs Friday’s close around 1.0845
Compare that with USDJPY and you can see why the EURUSD has been better suited for short-term trends rather than betting on longer-term trends and breakouts.
This does not mean it will not trade like this forever but at least it puts the price action in perspective.
So without fine-tuning, you can either use 1.0860 (I prefer 1.0850, which is close enough) to set its tone for day trading while within 1.08-1.09, a range too tight to last,.
Fed’s preferred inflation indicator (PCE) will likely show that disinflation stalled in April
Eurozone inflation is forecast to have increased in May but the move up is seen as atemporary.

© 2024 Global View