
- This topic has 28,070 replies, 54 voices, and was last updated 38 minutes ago by GVI Forex 2.
-
AuthorPosts
-
June 11, 2024 at 12:19 pm #7558June 11, 2024 at 11:04 am #7553June 11, 2024 at 10:34 am #7543
A look at the day ahead in U.S. and global markets by Amanda Cooper.
To anyone watching the stock market over the last year, it would seem the letters “AI” are akin to a magic wand that will pump up the share price of any company involved in it.
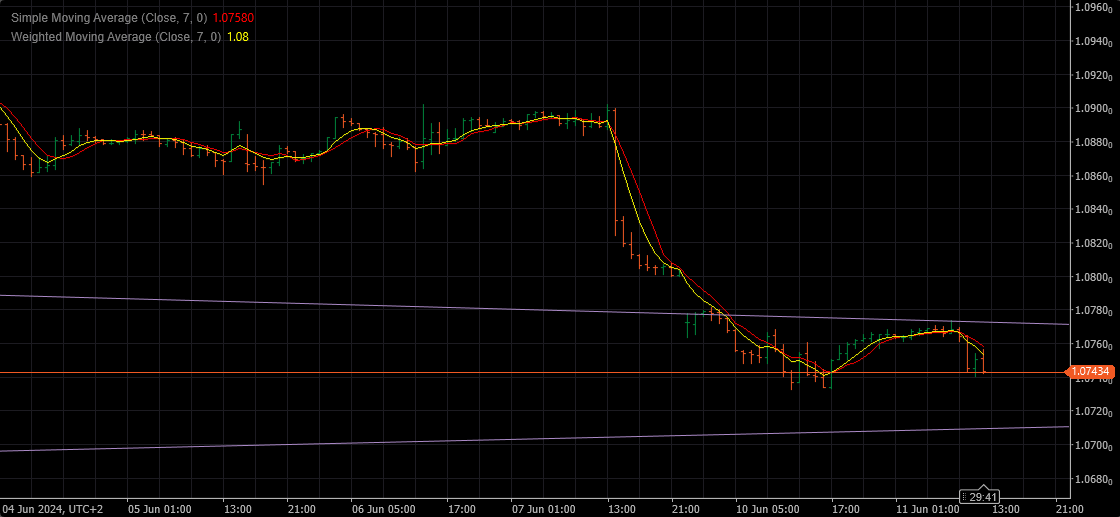
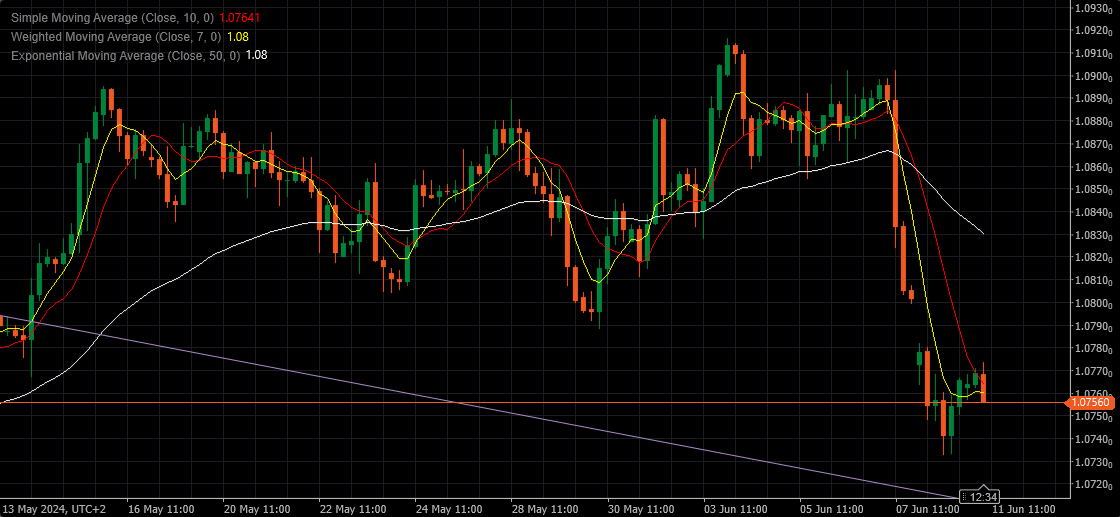
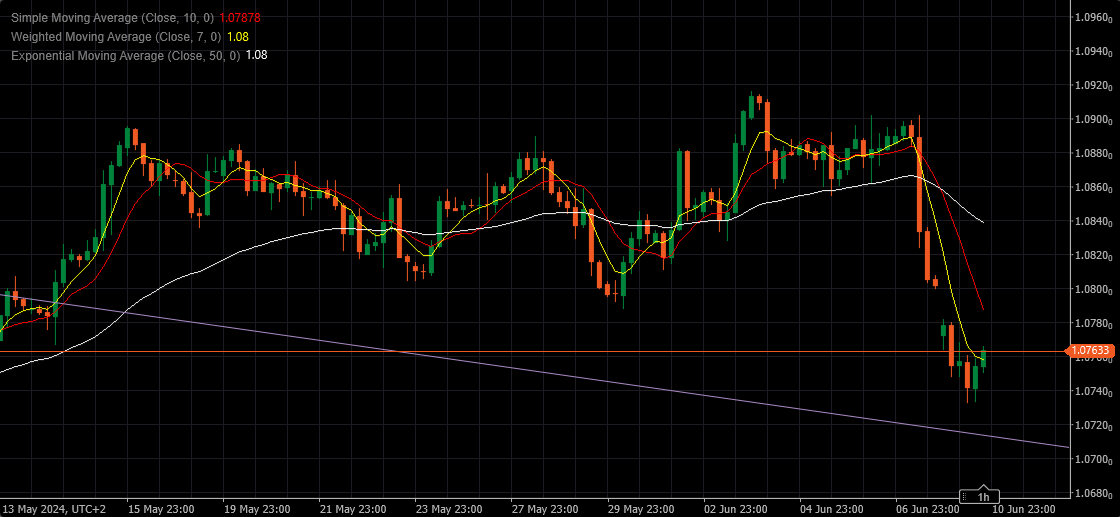
June 11, 2024 at 10:31 am #7542EURUSD 1h
I am going to try to explain :
That line above the head that it couldn’t go over this morning is the very same trend line that was resistance, should have held …but didn’t.
So we are back to square one, going for 1.07100.
Problem is FOMC and all the possible outcomes and expectations – it all depends on pre positioning.
 June 11, 2024 at 10:29 am #7541June 11, 2024 at 10:10 am #7540June 11, 2024 at 10:01 am #7539June 11, 2024 at 9:57 am #7538June 11, 2024 at 9:46 am #7537June 11, 2024 at 8:48 am #7535June 11, 2024 at 1:23 am #7533June 10, 2024 at 7:28 pm #7527June 10, 2024 at 7:24 pm #7526June 10, 2024 at 7:16 pm #7525June 10, 2024 at 6:06 pm #7524June 10, 2024 at 4:23 pm #7521June 10, 2024 at 3:59 pm #7520June 10, 2024 at 3:41 pm #7519June 10, 2024 at 2:57 pm #7518June 10, 2024 at 2:26 pm #7517
Markets do noit like ucnertainty. Here is an article
Summary
Macron calls early election after far-right surge in EU vote
Finance minister predicts historic impact of French election
Possible hung parliament, risk to Macron’s domestic agenda
Euro and French stocks fall after far-right gains at EU level
PARIS, June 10 (Reuters) – Political parties and business leaders alike tried to figure out what a possible far-right win could mean for France following President Emmanuel Macron’s decision to call a snap election after a bruising loss in a European Parliament ballot.
France weighs up prospect of far-right power as countdown to snap election starts
June 10, 2024 at 2:24 pm #7516June 10, 2024 at 2:17 pm #7515June 10, 2024 at 2:10 pm #7514June 10, 2024 at 2:06 pm #7513June 10, 2024 at 1:52 pm #7512June 10, 2024 at 1:41 pm #7511EURGBP WEEKLY CHART -MIND THE GAP HERE AS WELL
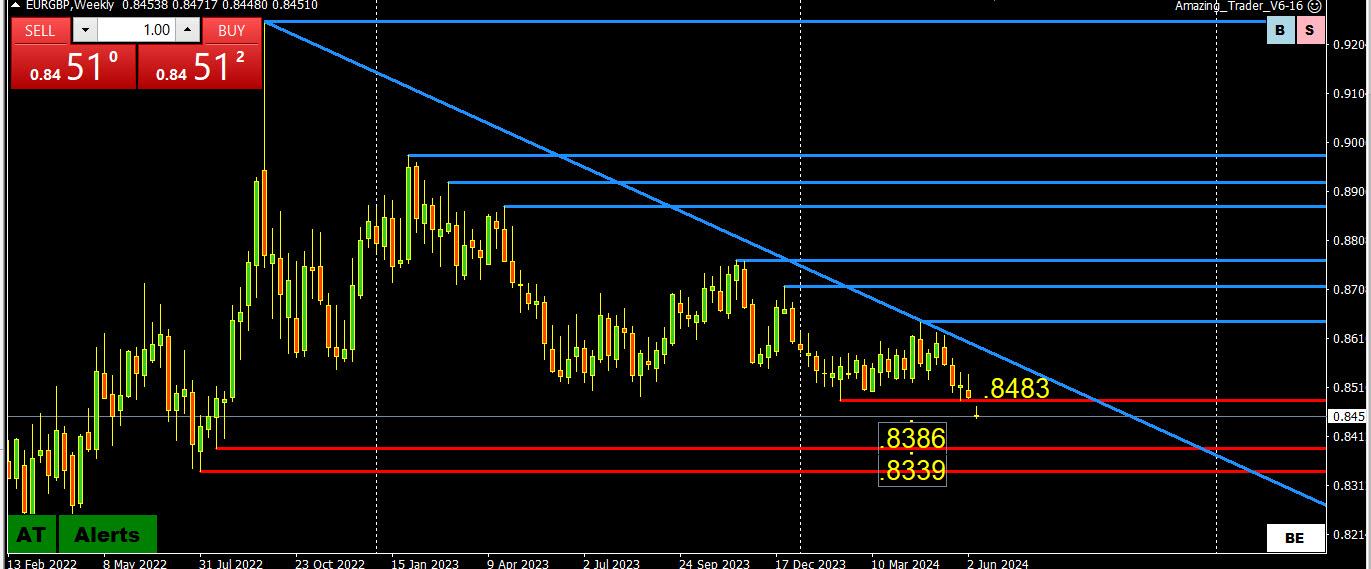
THIS IS A GOOD CROSS TO USE AS AN INDICATOIR OF EUR STRENGTH IN WEAKNESS, CURRENTLY THE LATTER AFTER THE GAP LOWER OPENING. –GAP is from .8490-.8371
‘
With next key supports noit until the .83xxs, use .8450 as a focal point wiuthin .84-85 and a move above .85 WOULD BE needed to suggest cooling concenrs.June 10, 2024 at 1:40 pm #7510June 10, 2024 at 1:22 pm #7509Geoplotiical driven markets are a different animal as you will see in this blog article
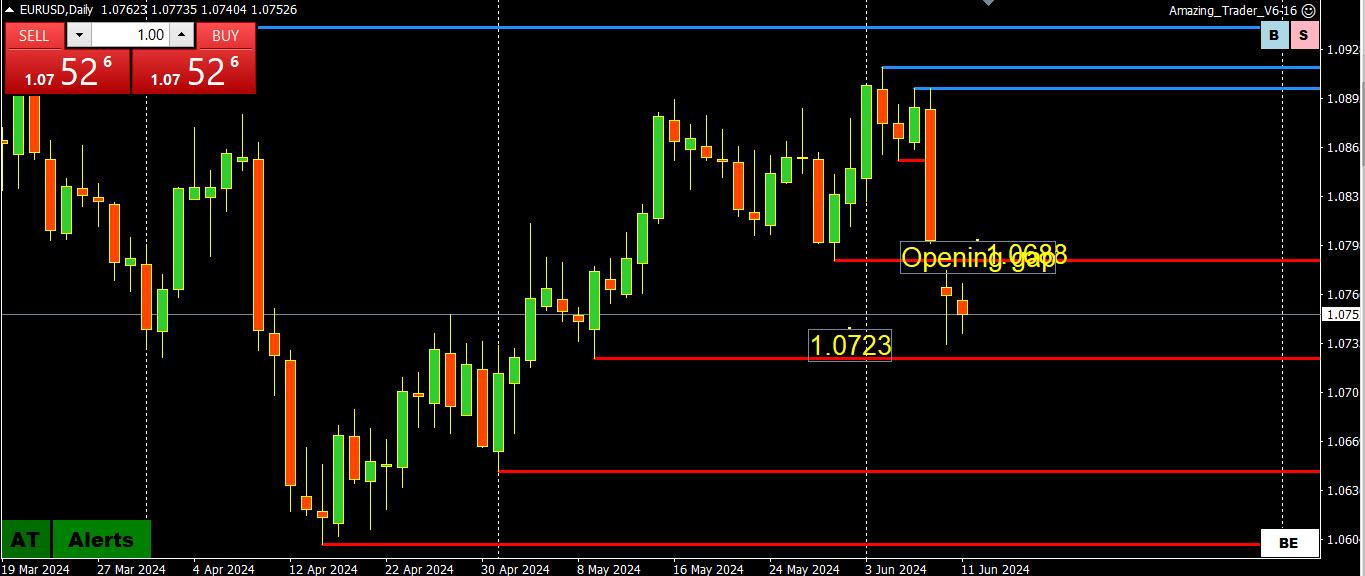
EURUSD Gaps Lower: How to Trade in a Geopolitical Market
 June 10, 2024 at 12:58 pm #7508
EURUSD 15 MINUTE CHART – TRENDLINE
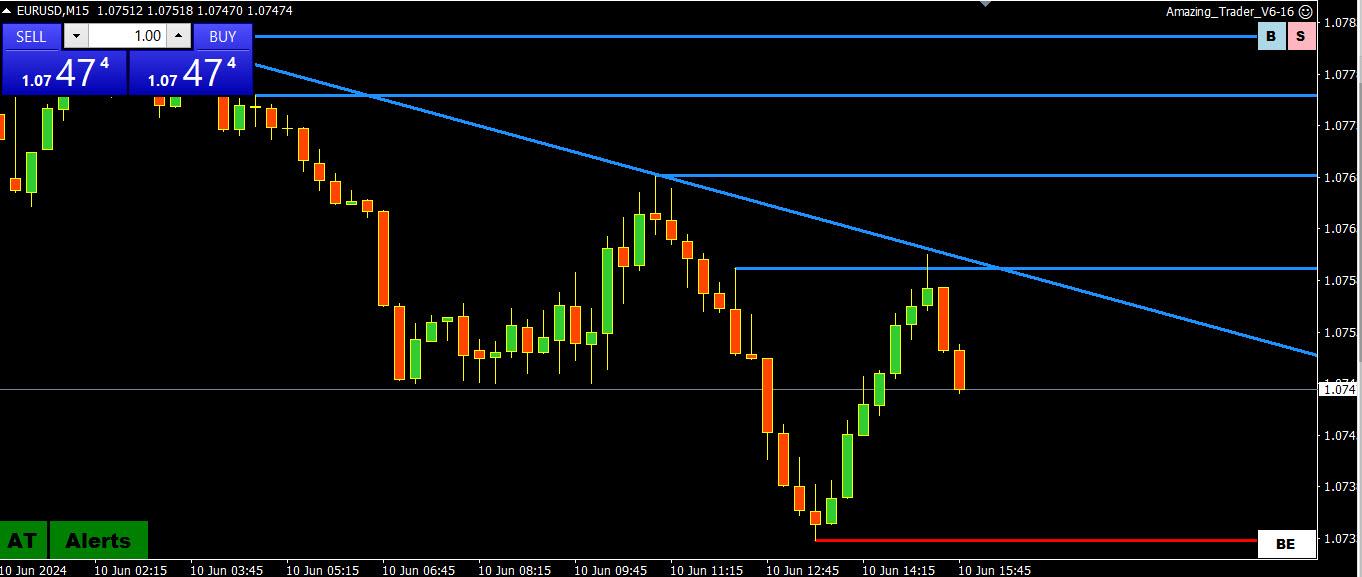
I scan through charts looking for whatever indicator is working. AND THEN KEEP AN EYE ON IT.
In this case, using THE Amazing Trader, note how the 15 miunte trendlkine capped the biounce off the low.
June 10, 2024 at 12:54 pm #7507 -
AuthorPosts
- You must be logged in to reply to this topic.
Search
© 2024 Global View