
- This topic has 27,652 replies, 54 voices, and was last updated 1 hour, 24 minutes ago by Mtl JP.
-
AuthorPosts
-
July 22, 2024 at 2:33 pm #9474July 22, 2024 at 2:07 pm #9472
USDCAD WEEKLY CHART
The following was posted over the weekend in the Global-View Trading Club Weekly Charts
Note USDCAD bounced off the 1.3707 level… last at 1.3772
\
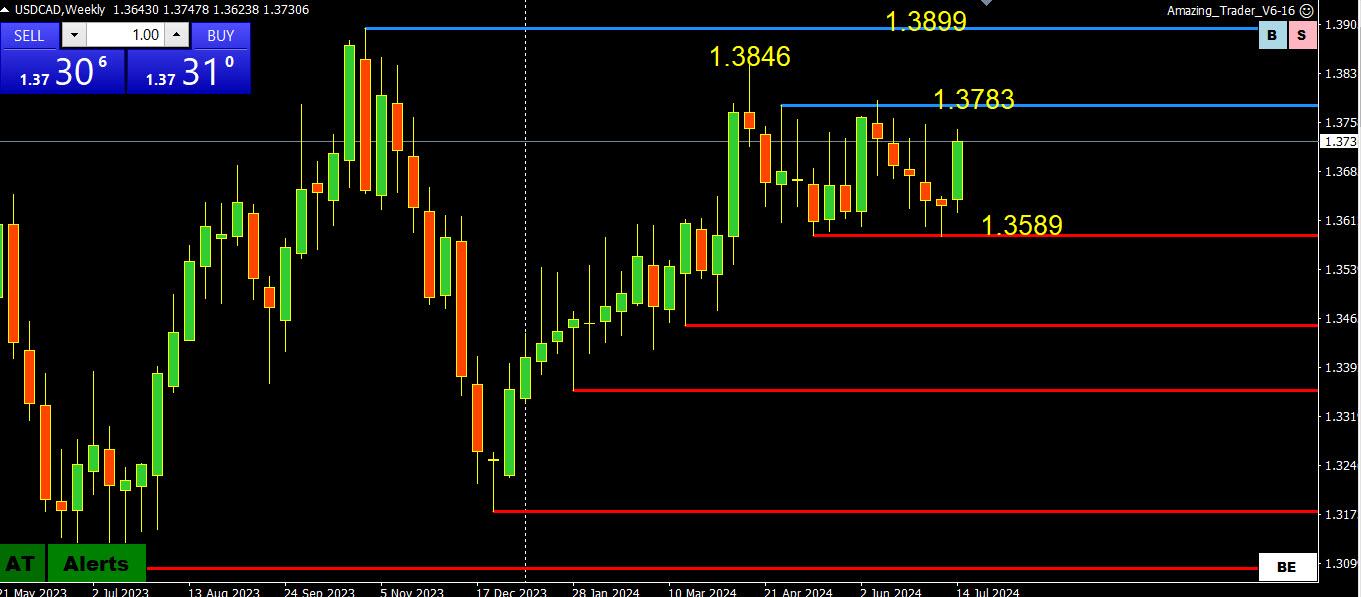
THe focus is on the BoC rate decision on Wednesday where expectations run as high as 80% for a rate cut.
This suggests support on dips ahead of the decision, starting at 1.3707-17.
Targets on the upside can be seen on the chart but 1.3750 and 1.3800 are the pivotal levels on top.
July 22, 2024 at 2:01 pm #9471THIS WEEK’S MARKET-MOVING EVENTS (all days local)
The People’s Bank of China is expected to keep its loan prime rates unchanged on Monday. For the Bank of Canada on Wednesday, though views are split, a second rate cut is expected by most forecasters. Both banks are facing underperforming economies.The first estimate for second-quarter US GDP on Thursday is expected to show an uptick in growth to an annualized 1.8 percent from the first quarter’s 1.4 percent. Consumption expenditures are seen at 2.0 percent versus 1.5 percent. Friday will see the PCE price indexes as part of the personal income and outlays report; marginal slowing to 2.5 percent is seen for both the overall and ex-food ex-energy core rates. And despite two week’s of intense political drama, no change is expected for the month-end consumer sentiment report on Friday.
Wednesday will see the round of July PMI flashes with modest improvement expected for Germany, the Eurozone, and the UK. The PMIs for the US are expected to be little changed to slightly lower.
Econoday
July 22, 2024 at 1:56 pm #9470Good R/R in Singapore Dollar vs US Dollar (UsdSgd) from the 3440’s if it gets there again.
The good portfolio managers are taking risk off the table and hedging a bit in recent weeks. The bad ones are blaming it on Trump and losing money. Not sold on the doom and gloom permeating some media and money manager sources in the US should he take office, rather Europe looks more disjointed and unstable to me at present both ideologically and fundamentally, bearing in mind the US currently has no president or vice president.
The bottom line on rates is the FED will cut in September and that is being gradually priced in.
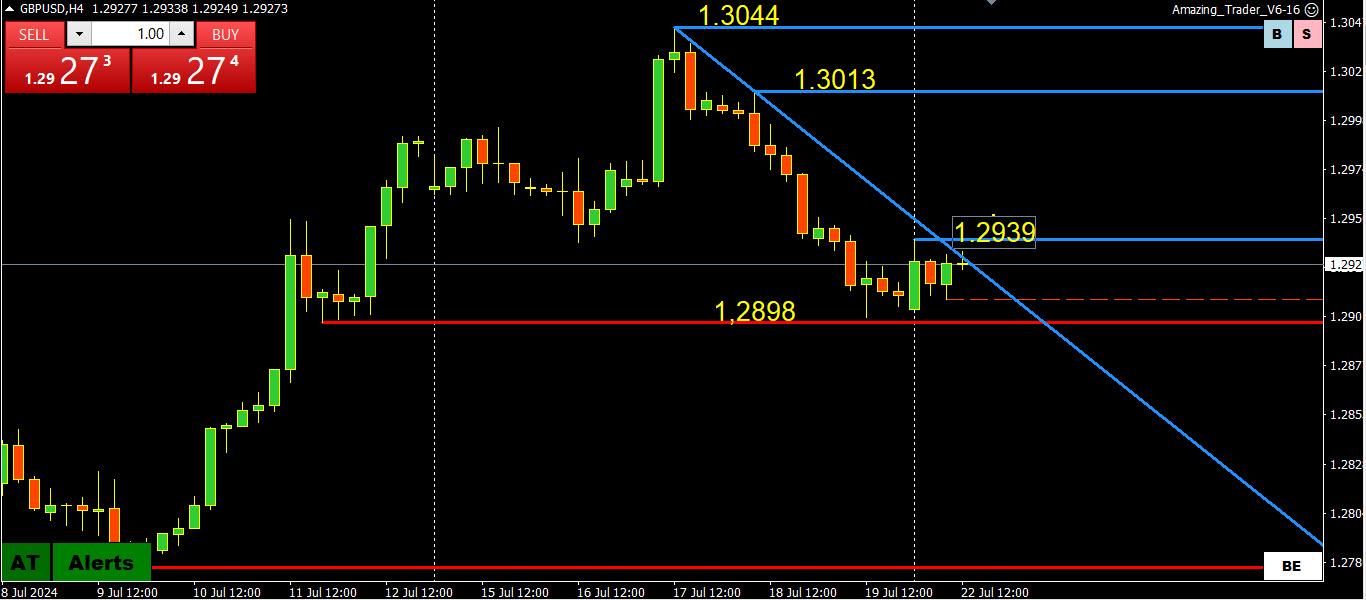
July 22, 2024 at 1:39 pm #9469July 22, 2024 at 1:18 pm #9468Sterling looks the best to me at the moment from the buy side perspective as it nears 2900. Not so much on Euro or Aud which would entail greater risk on the buy side this morning. That said, I still prefer the buy side overall in Aussie in a larger view and do not believe price has gone low enough to change that. Euro is a sell from higher than current market and not at a price offering good R/R here at 0870. Prefer buy side of UsdCad today.
July 22, 2024 at 1:14 pm #9467AUDJPY DAILY CHART – RED CANDLES!
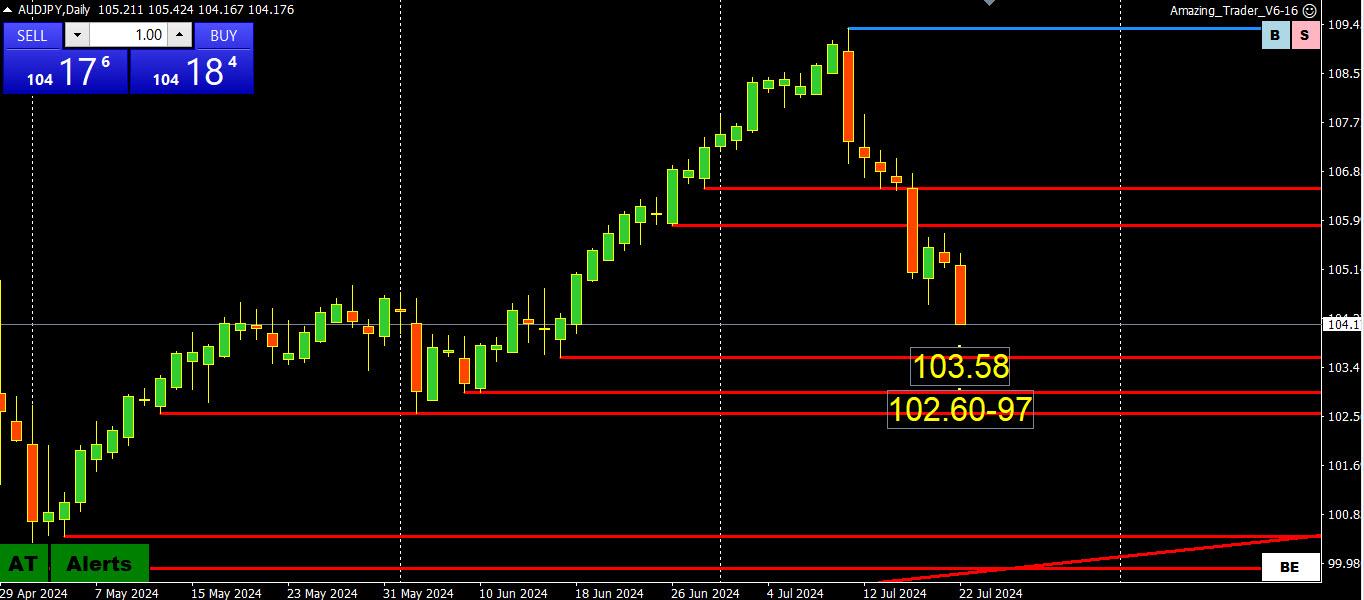
Chart shows 7 red candles out of the opast 8 days with key supports shown on the charts.
aUD weakness ius also evident on an AUDUSD daily chart where there are 6 red candles in a row. As I noited, keep an eye on these patterns if looking for a sign of a pause or bottom.
July 22, 2024 at 12:50 pm #9466USDJPY 4 HOIUR CHART
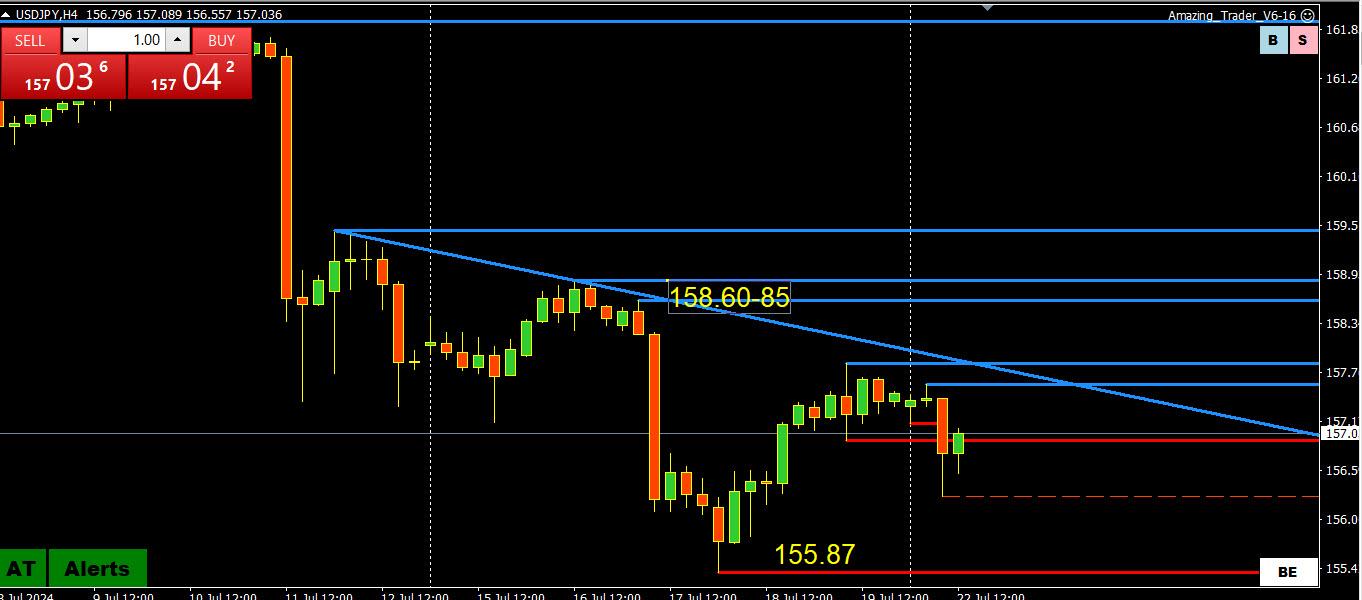
JPY has been the outperformer today as it is the only currency currently up vs the dollar although USDJPY is off its lows.
If looking for the leading cross, look at an AUDJPY chart.
As this chart shows, I highlighted the key levels, and for now it looks like 155-158 may be a range, at least for now.
July 22, 2024 at 12:07 pm #9462July 22, 2024 at 12:00 pm #9458US 10-YR 4.216%
curve ever so slightly flatteningusd on backfoot little bit while dlrx under its 200d ma
yen uP someharris broohaha rather opaque effect on the dlr atm, needs time to develop imo
FED gang is in blackout period so any yakkings not related to policy
market likely more attuned to gaming claims, durable god & PCE over GDP
I am tuned in to bonds for potential gaming opps
July 22, 2024 at 11:36 am #9457GBPJPY 1 HOUR CHART – KEY LEVELS
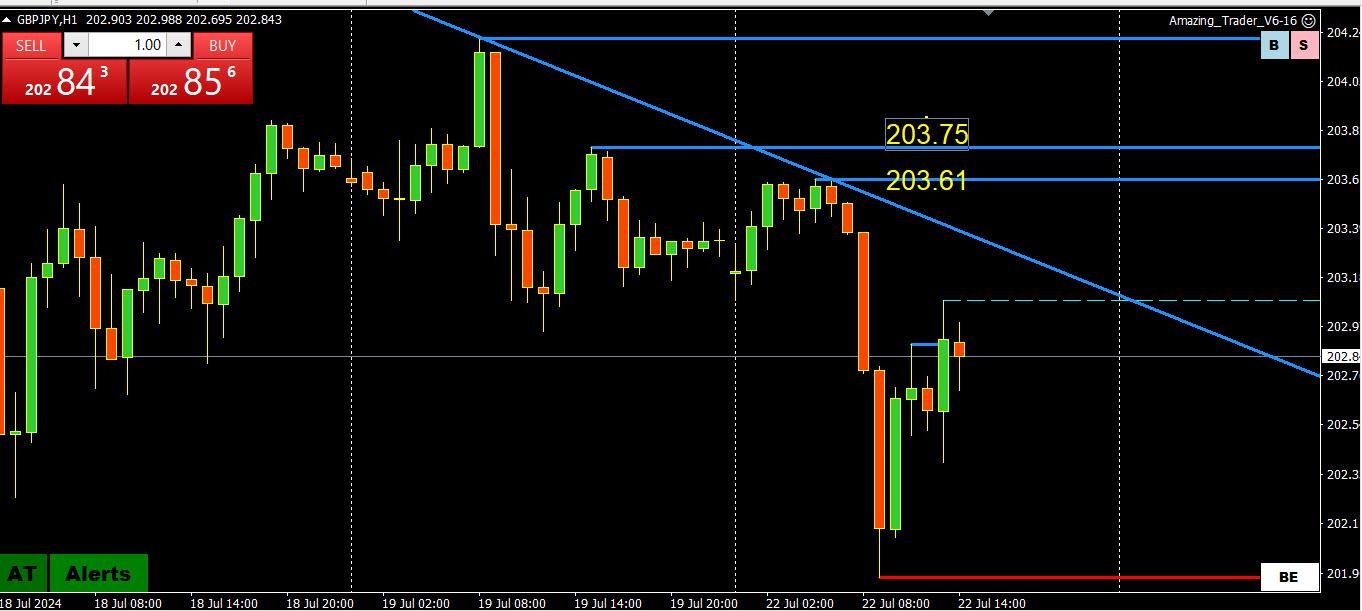
KEY LEVELS TO CONFIRM THE LOW IS IN AND SHIFT IN RISK REQUIRES A BREAK OF THE TRENDLINE AND BREAK ABOVE 203.60-75
GBP IS GETTING SOME OF THE CROSS FLOWS, INCLUDING VS THE JPY, AS THE FOCUS STARTS TO LOOK AHEAD TO THE END OF MIONTH BOJ MEETING ALTHOUGH NOT REFLECTED AS YET IN USDJPY (DOWN ON THE DAY).
‘
THIS CAME OUT A SHORT WHILE AGOBoJ is reportedly said to see weak consumption comp;licating its rate decision, according to Bloomberg
Source. Newsquawk.com
July 22, 2024 at 10:55 am #9455A look at the day ahead in U.S. and global markets from Mike Dolan
U.S. President Joe Biden’s weekend withdrawal from the White House race can hardly be seen as a big surprise, but it adds some doubts to market bets that Republican challenger Donald Trump is a shoo-in in November’s election.
Morning Bid: Biden bows out, election bets shift, China cuts
July 22, 2024 at 10:15 am #9454BTC DAILY CHART – Can it make a run at the record high?

As I noted on Friday, there is already chatter of another run at the record 73759 record high after BTC bucked the liquidation trends pn Friday and traded higher. To suggest this risk, 70000+ needs to trade.
My view on a something that can move 5-10% ovwer a weekend remains that pivotal levels like 65000 and 70000 are as or more important indicators than technical levels.
Using this logic, above 65000 sees a bid and keeps the focus on 70000.
Technical levels are seen on this chartt.
July 22, 2024 at 10:08 am #9453XAUUSD 4 HOUR CHART – 2400
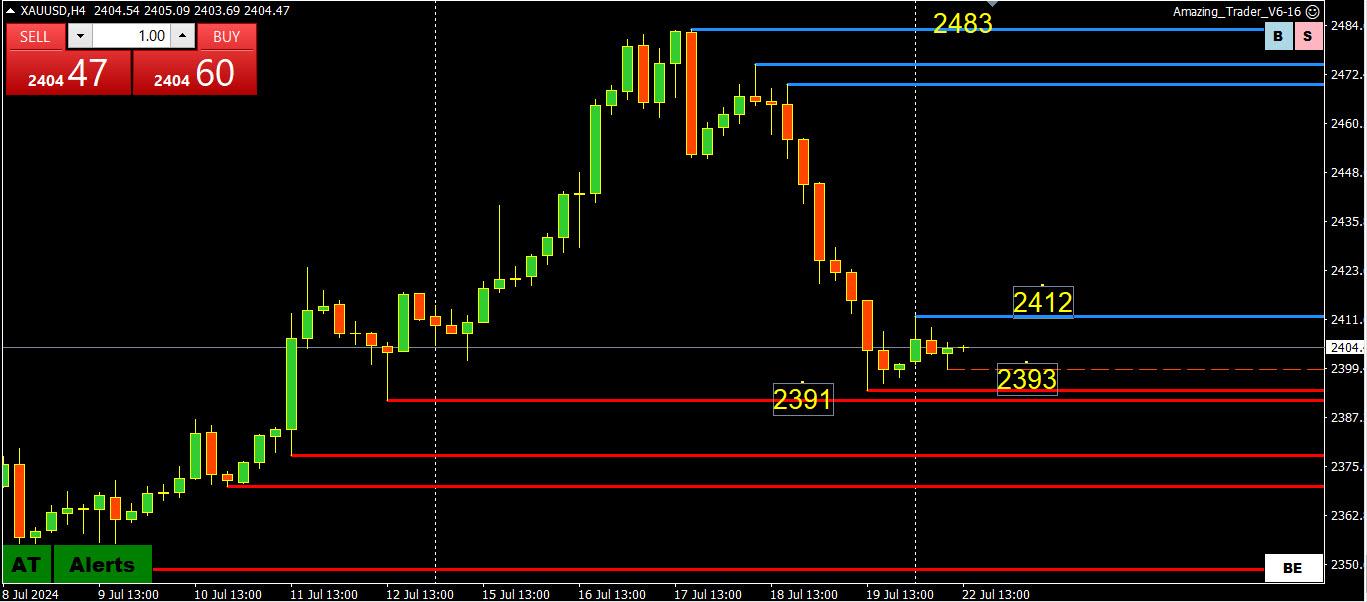
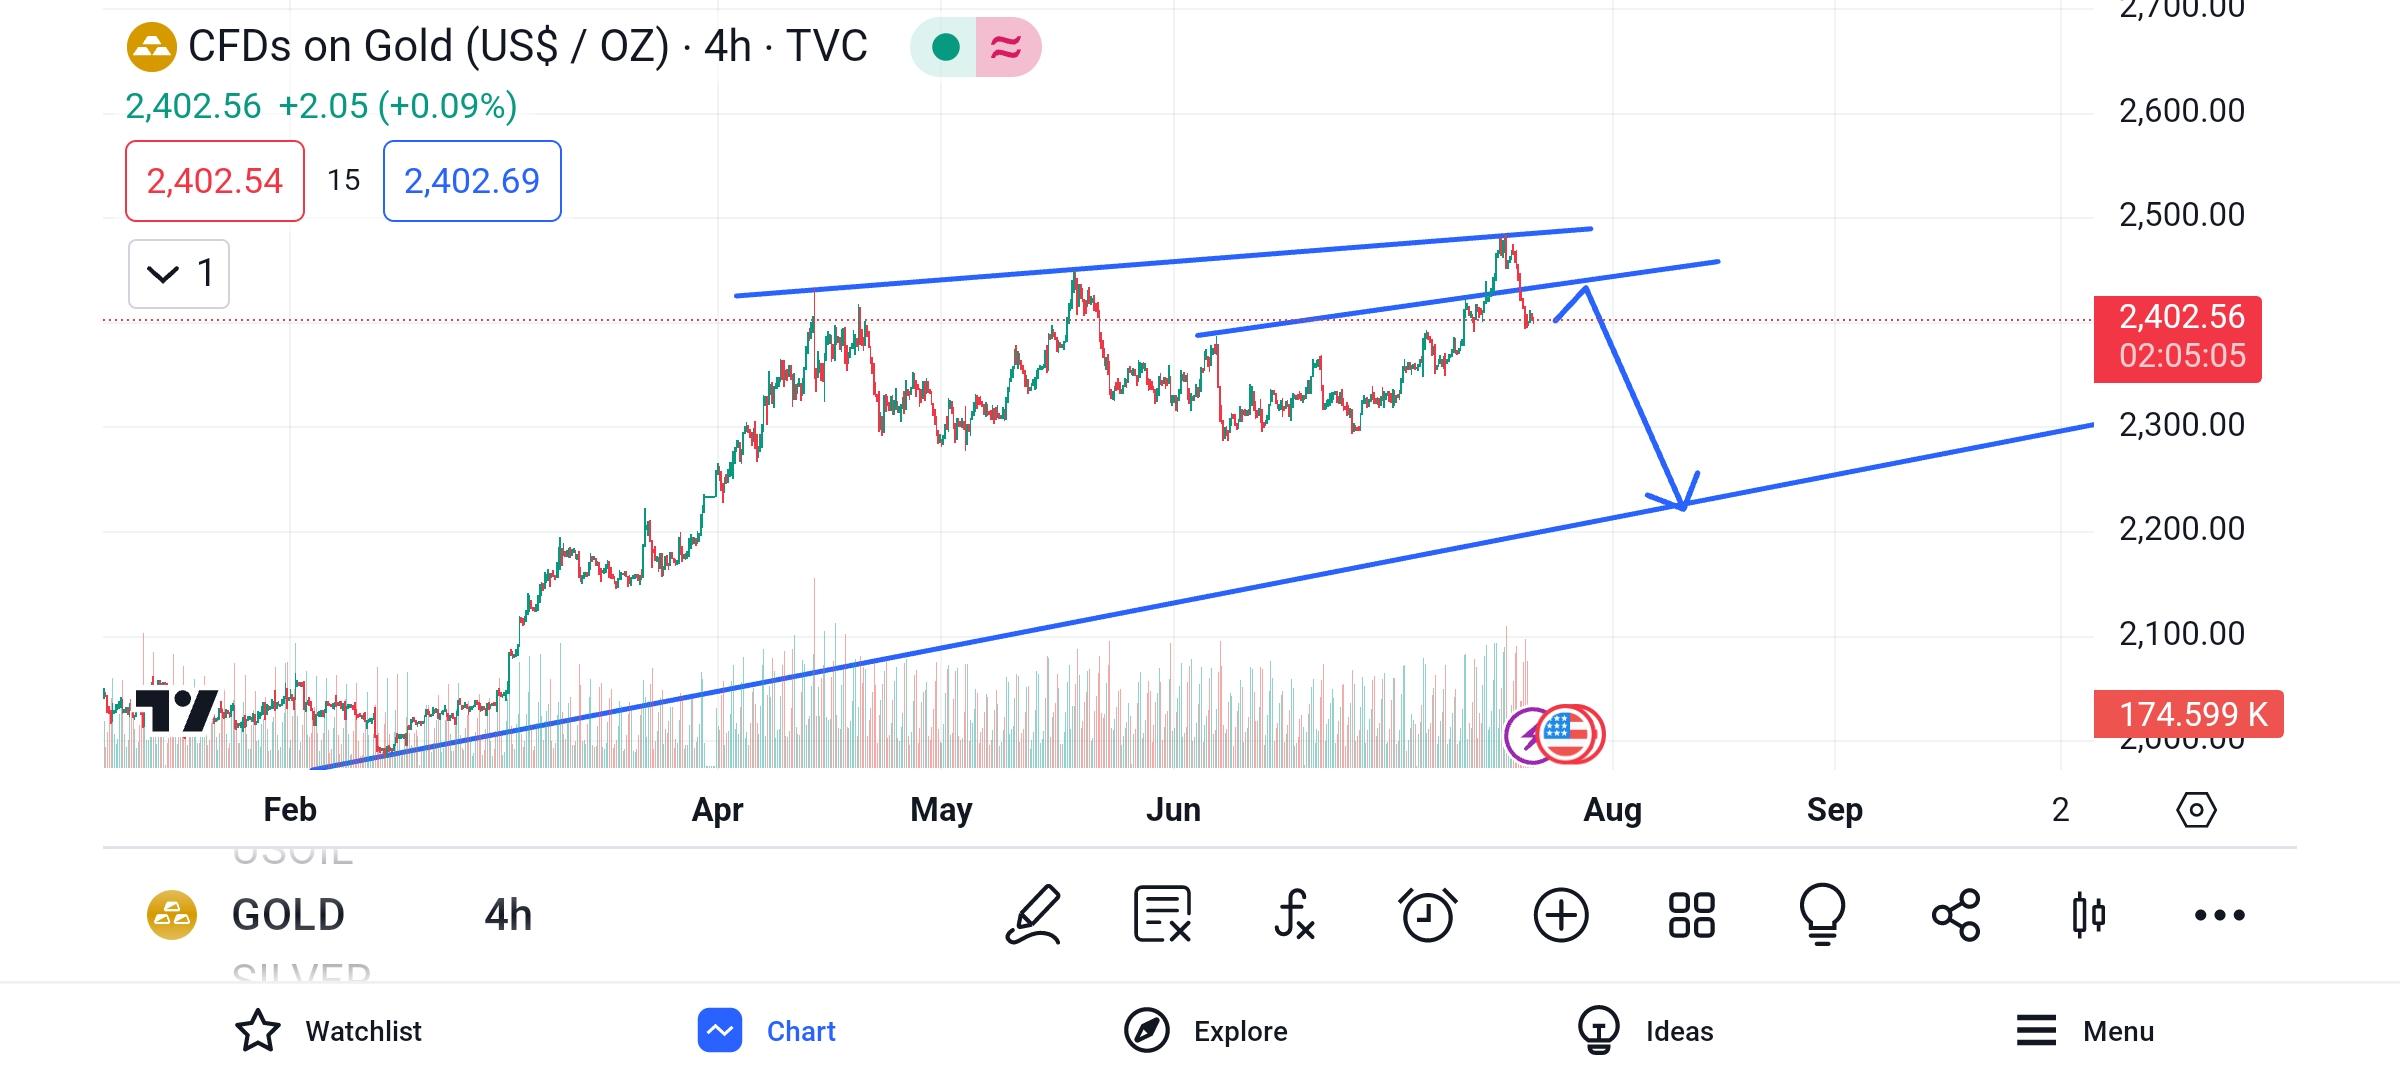
2400 is clearly the pivotal level; as XAUUSD needs to hold above it to contain the retracement from the 2483 record high.
The key level on the downside is 2391, the base of the move to the record high.
Note the pause just above it at 2393. Downside contained whille it holds, A firm break would signal more to come.
July 22, 2024 at 10:02 am #9452July 22, 2024 at 9:56 am #9451July 22, 2024 at 9:42 am #9449July 22, 2024 at 8:44 am #9447Welcome Charlotte !
What you draw on this chart might be right or not – BUT – if you play it Right, at the end of the game ( day/week/month) you will be winning.
By “playing it right “ I mean , if you Sell it on that first resistance , with the tight stop, with what you draw you are looking at R/R about 1:20 , and take care not to overplay it with a position too big – so don’t allocate more then let’s say 2% of your margin to it , you are in clear.
This might not be my favourite style of trading , but even with the probability of 50/50 , you will make it.
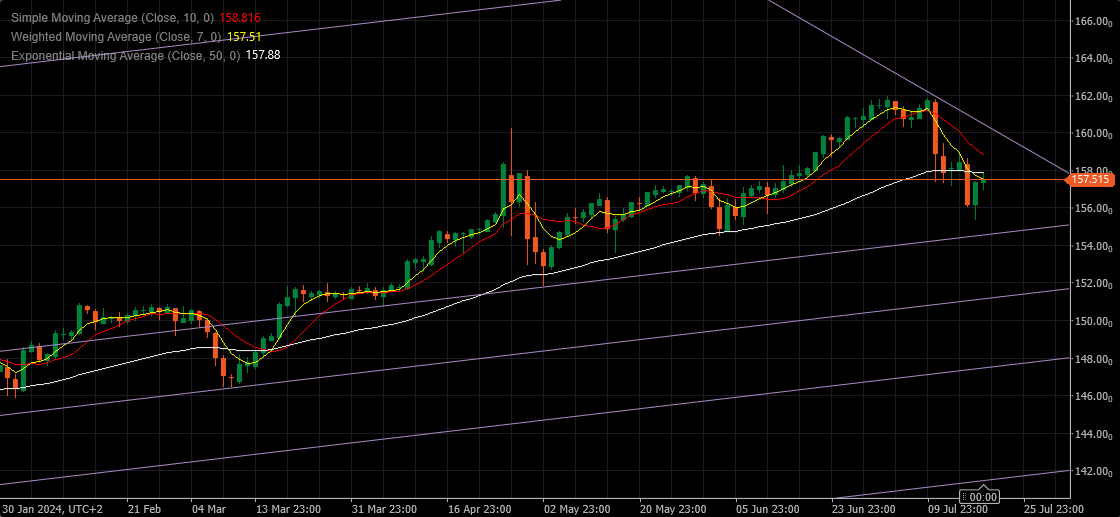
July 22, 2024 at 8:09 am #9445July 22, 2024 at 8:04 am #9444July 22, 2024 at 1:15 am #9442July 21, 2024 at 11:30 pm #9437July 21, 2024 at 8:14 pm #9427July 21, 2024 at 7:51 pm #9425USDJPY Daily
Supports at : 155.350 , 154.650 & 151.050
Resistances at : 157.850 , 158.450 & 160.500
We have here a possible Bullish Pattern Creation – not to be mistaken for a sure thing – but I have to warn you about it.
So far, USDJPY repeatedly had very sharp corrections, just to continue Up and reach a new High.
There is nothing visible right now to confirm something else – so we have to treat this drop as a correction , for now..
Talks about BoJ, Hidden agendas and conspiracy theories of all kinds shouldn’t be taken into account while trading.
 July 21, 2024 at 7:43 pm #9424
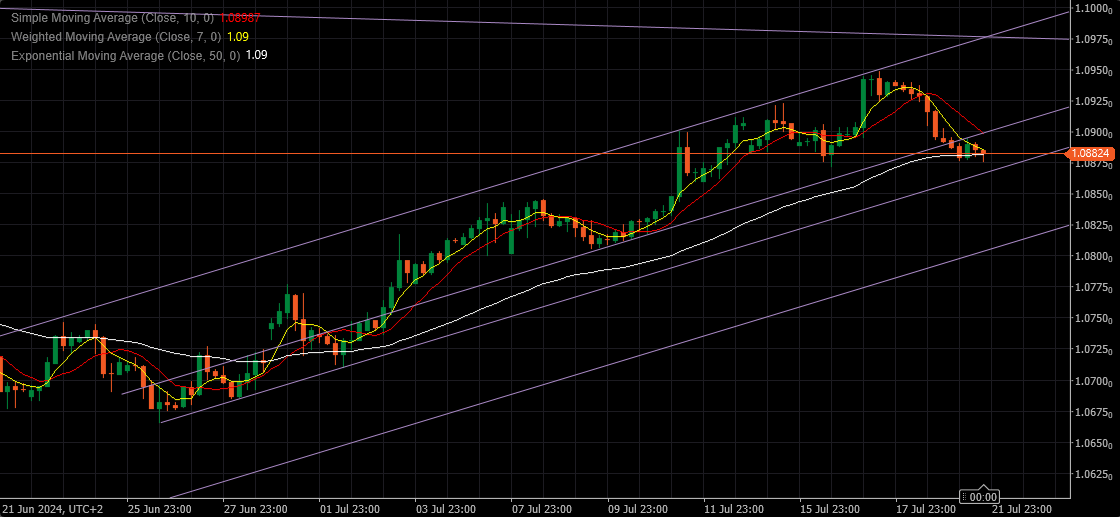
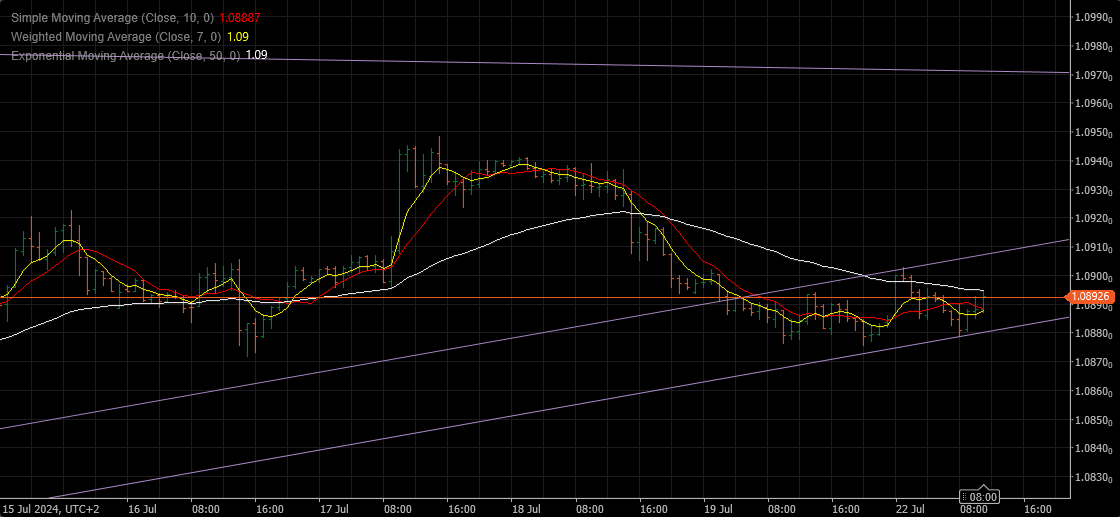
EURUSD 4h – Pre Open
Resistances at : 1.08850 , 1.09000 & 1.09050
Supports at : 1.08750 , 1.08650 & 1.08050
1.08650 is a crucial support right now, and will decide are we going to return to further advances Up, or we’ll face a deeper correction.
We have a Major Resistance ( and the target ) at 1.09750.
 July 21, 2024 at 6:51 pm #9422July 21, 2024 at 5:16 pm #9420July 21, 2024 at 3:56 pm #9417July 20, 2024 at 11:06 pm #9405July 20, 2024 at 11:03 pm #9404
Click below for detailed previews
Newsquawk Week Ahead: Highlights include US PCE, BoC, PBoC LPR, PMI’s and Tokyo CPI\\

-
AuthorPosts



- You must be logged in to reply to this topic.
Search
© 2024 Global View