
- This topic has 27,923 replies, 54 voices, and was last updated 1 hour, 57 minutes ago by GVI Forex 2.
-
AuthorPosts
-
October 10, 2024 at 9:44 am #12740
USDCAD Daily Chart – TESTS KEY RESISTANCE

When I start my day I scan the charts to see what catches my eye.
Today it has been USDCAD which tested 1.3738, the target following the break of 1.3647.
There are times that USDCAD act as a lead USD indicator so keep an eye on 1.3738 (and 1.3750 for confirmation should it be broken)
On the downside, support starts at 1,3690
October 10, 2024 at 8:32 am #12739October 10, 2024 at 8:21 am #12738EURUSD DAILY CHART – WAITING FOR CPI

Testing its 100 day mva (1.0933) with 1.0881 and the 200 day mva (1.0875) exposed as long as EURUDSD trades below 1.0950.
Next up are weekly jobless claims (distorted by Hurricane Helene>) and CPI. The latter i the key focus but unless 1.0850+ is renewed, risk will stay on the downside.
October 9, 2024 at 11:50 pm #12737Fed’s Daly sees one or two more interest rate cuts this year
By Reuters
(Reuters) – San Francisco Federal Reserve Bank President Mary Daly on Wednesday said she “fully” supported the U.S. central bank’s half-of-a-percentage-point interest-rate cut last month, and said one or two more rate cuts this year are likely if the economy evolves as she expects. “The labor market has downshifted,” Daly said in an interview with KTVB anchor Carolyn Holly at Boise State University, adding she is now “quite confident” inflation is headed toward the Fed’s 2% goal.
“I do not want to see further slowing in the labor market.”
but you will mary. because it has to slow
October 9, 2024 at 11:49 pm #12736This blog article is worth revisiting as you saw today how stops drive the forex market
Forex Trading Tip: Watch Out for Stops and Use Them to Your Advantage!
\
 October 9, 2024 at 11:45 pm #12735October 9, 2024 at 8:00 pm #12732
Any trader knows that trading is tough but I hope this makes it easier.
Day Trader’s Guide to Beating the Market
 October 9, 2024 at 7:58 pm #12731
XAUUSD DAILY CHART – Retreating

Retreat from its record high continues and now dependent on 2600 holding or risk shifts to 2546.
On the upside, stays offered as long as it trades below 2624.
As I have been noting, the lack of a safe haven bid for despite rising Middle East geopolitical risk has contributed to the retracement.
October 9, 2024 at 7:52 pm #12730October 9, 2024 at 6:00 pm #12713October 9, 2024 at 5:57 pm #12712October 9, 2024 at 5:41 pm #12711USDCAD DAILY CHART – ANOTHER TEXTBOOK MOVE?

This is another currency that is trading as PER THE WEKKLY FX CHART OUTLOOK— ABOVE KEY RESISTANCE AND THE 100 AND 200 MVAS… It now needs to stay above 1.3647 to maaintain the bid.
FROM THE WEEKLY CHART OUTLOOK”
Trying to build some upward momentum but would need to move above the 100 and 200 day would plus 1.3647 to suggest this is turning into an uptrend.October 9, 2024 at 5:19 pm #12706EURUSD DAILY CHART – TEXTBOOK MOVE IN THE EURUSD

The following is the update in our Weekly FX Chart Outlook posted over the weekend
EURUSD WILL STAY ON THE DFENSIVE AS LONG AS IT TRADES BELOW 1.10
To accelerate the move to the downside, and expose 1.0880, 1.0949 would need to be firmly broken.
Note the 100 and 200 day moving averages (mvas)… potential targets if further momentum builds to the downside.
October 9, 2024 at 3:59 pm #12703October 9, 2024 at 3:49 pm #12702Regarding Iran launching 1000’s of missiles if attacked, I think the western militaries should just obliterate their military in the span of 48 hours. Not being a war monger but those sub-humans are a global threat especially if they achieve nuclear ability. They have already been shooting missiles at allied targets.
October 9, 2024 at 3:46 pm #12701October 9, 2024 at 3:35 pm #12700October 9, 2024 at 2:23 pm #12684EURO 1.0956
sooooo much s been said
sooooooo little done (trading wise)must be some mysterious “hold” on the puppy
simple chart technical price-point not nuff, probably some fundamental OR some evil power-player ditzing with lesser player heads n patience.what is there not to love about pulling and stretching tactics and strategy elasticity (or is it atrophy ?)
October 9, 2024 at 2:22 pm #12683October 9, 2024 at 1:55 pm #12678October 9, 2024 at 1:25 pm #12677October 9, 2024 at 1:10 pm #12676October 9, 2024 at 12:59 pm #12675October 9, 2024 at 10:55 am #12674A look at the day ahead in U.S. and global markets from Mike Dolan
Wall St stocks roared back on Tuesday just as China doubts re-emerge – but a scattergun week now has investors navigating the impact from a potentially devastating hurricane in Florida and a recoiling oil price in the face of Middle East tensions.
Adding to this heavy and sometimes conflicting newsflow, the U.S. Justice Department late Tuesday said it may ask a judge to force Alphabet’s (GOOGL.O), opens new tab Google to divest parts of its business, such as its Chrome browser and Android operating system – claiming they sustain an illegal monopoly in online search.
Morning Bid: Braced for Milton as oil recoils, China retreats
October 9, 2024 at 10:53 am #12673October 9, 2024 at 10:44 am #12672US500 4 HOUR CHART – Correlation?

In the absence of fresh economic news, markets are like steering a boat without a rudder.
This leads to looking for correlations to steer the boat. In this regard, early USD strength seemed to correlate with weaker stocks, which have since recovered and the USD has backed off its day highs.
Note, correlations work until they stop working so keep an eye on Stocks to see if the pattern continues (or not).
As for U5500, trading with a bid (while above 5700) but consolidating unless 5758-73 are taken out.
‘October 9, 2024 at 9:38 am #12671Posted by JP:
EURO 1.0955 = Sup
the Qtn is . will it holdand the A is __
JP, the answer to your question depends on whether there are stops below 1.0950. Right now there is a double bottom, suggesting someone defending this level but the more times a level is tested the weaker it becomes unless of course if it holds rock solid.
As I noted, test may have to wait until US CPI but in any case, a 50 pip range is too tight to last for long.
October 9, 2024 at 9:26 am #12670USDJPY 4 HOUR CHART – Key levels cited
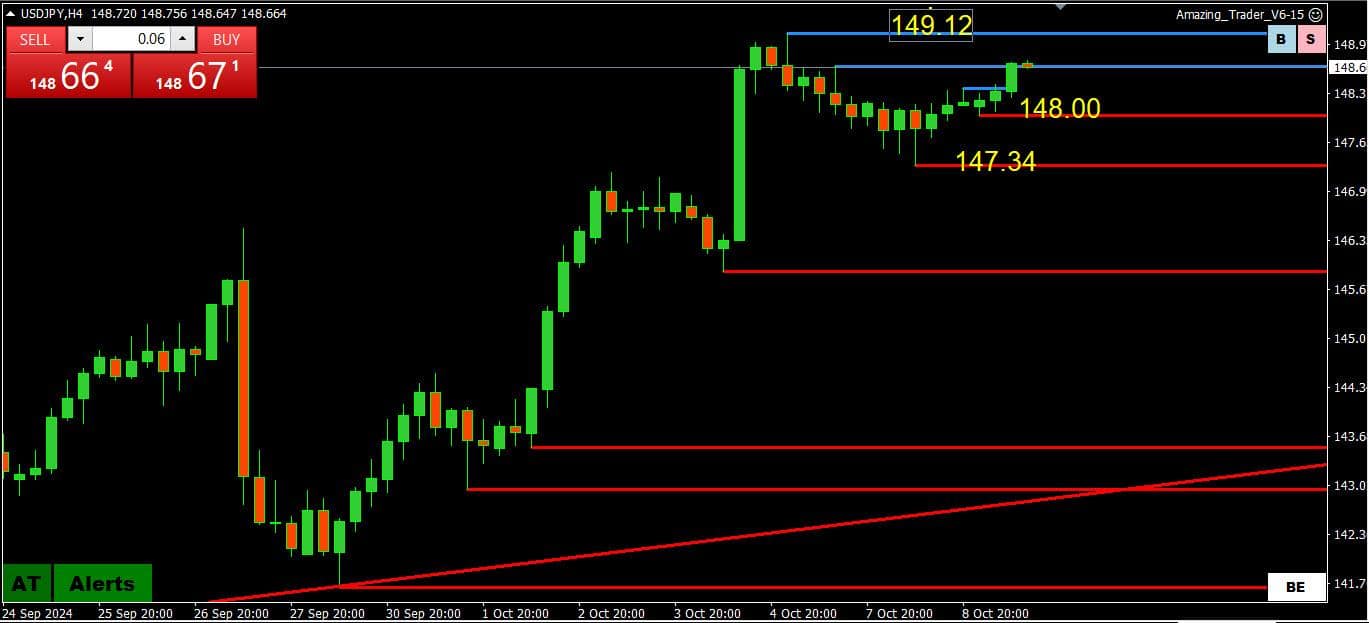
As noted yesterday, key levels are at 147.20-149.37 and tests of both side at 147.34-140.12) have paused within this band.
Pivotal level is clearly 148, which will dictate the next directional move.
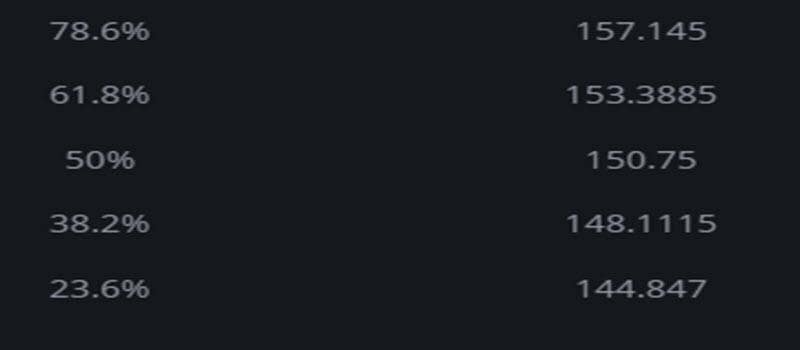
For those still looking at this as a retracement, here are the FIBO levels for 161.93-139.58
 October 9, 2024 at 9:14 am #12669
EURUSD 4 HOUR CHART – POWER OF 50

Turing on my screen what popped out was EURUSD making another run at 1.0950 (1.0951 double bottom).
The significance is not only the psychological 1.0950 level but the 1.0949 key chart support just below it.
Lending potential support could be caution at some stage ahead of tomorrow’s US CPI report although the focus will soon shift to next week, ECB meeting, where a 25 bps rate cut is widely expected.
On the other side, there is the ongoing Middle East situation with traders waiting for the other shoe to drop (Israel reprisal against Iran).
In any case, our view that EURUSD will stay defensive as long as it trades below 1.10 has so far worked out. a firm break of 1.0949 would put 1.0881 on the radar as next key support.
October 9, 2024 at 9:04 am #12668AUDNZD DAILY CHART – RBNZ FALLOUT

It is the reaction to news that matters played out overnight with the NZDUSD falling sharply (down about 1%) after the RBNZ, as generally expected, cut rates by 50bps
AUDNZD reaction (up) would need to establish above 1.1056 to expose the Major level at 1.1151.
Otherwise, range is to 1.0980-00,
-
AuthorPosts


- You must be logged in to reply to this topic.
Search
© 2024 Global View