
- This topic has 28,273 replies, 54 voices, and was last updated 1 hour, 31 minutes ago by GVI Forex 2.
-
AuthorPosts
-
November 14, 2024 at 8:45 am #14389
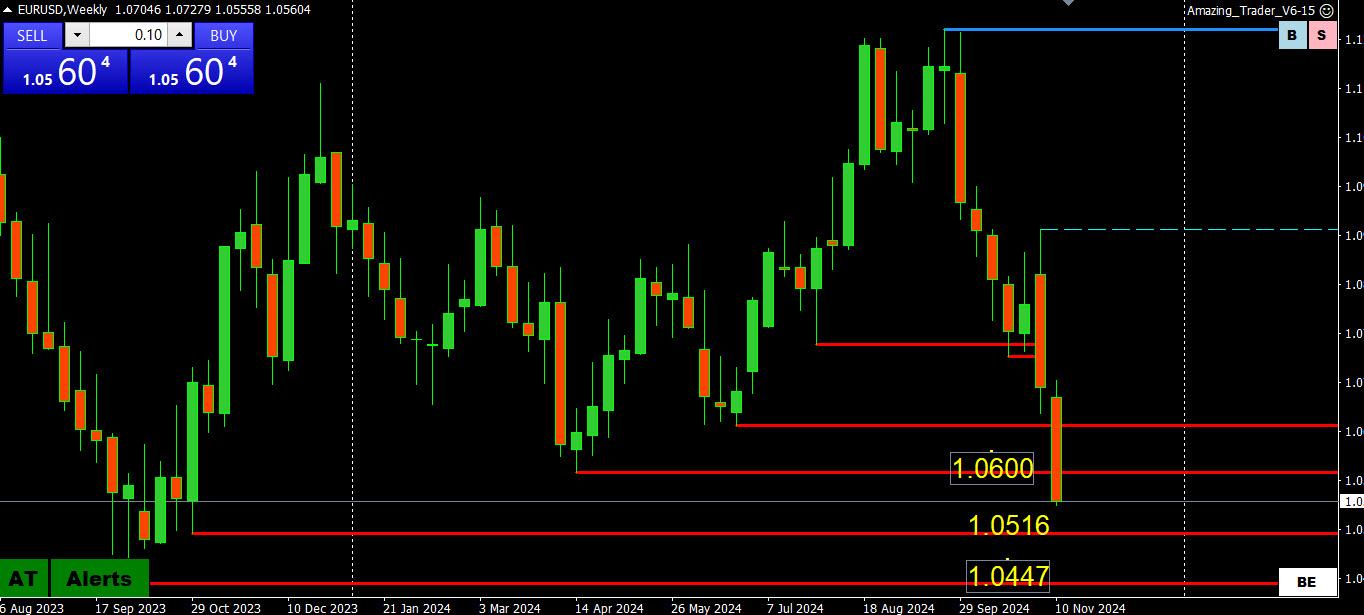
EURUSD 1 HOUR CHART – POWER OF 50

Question is whether EURUSD needs another failed retracement to make a run at 1.05 or will 1,0500-50 prove to be a sticky zone.
For day traders, it is a Power of 50 day with 1.0550 likely to set the tone.
Otherwise, a move above 1.0577 would be needed to slow the threat to key targets at 1.0500-15 and the major one at 1.0446.
November 14, 2024 at 8:38 am #14388XAUUSD DAILY CHART – CRUNCH TIME FOR THE BULLS

XAUUSD is down for the 5th day in a row and about 8.5% from its record 2790 high in just 2 week
CRUNCH TIME FOR THE BULLS::
2546 = next support/target
2543 = 100 day mva
Below 2543-46 would expose 2500 with key support below this level
On the upside, a solid move back above 2600 would be needed to ease the risk.
November 14, 2024 at 12:32 am #14386An uptick in U.S. consumer price inflation last month that was in line with forecasts propped up Wall Street indexes on Wednesday, and lifted the dollar close to levels against the yen that had been concerning to the Bank of Japan.M
November 13, 2024 at 11:31 pm #14384Markets like certainty and hate uncertainty. The former allows expectations to be formed for what may lie ahead. It is harder to form a consensus when the outlook is uncertain although it does create a backdrop for volatility.,,,
How to Trade in the New Trump Era
 November 13, 2024 at 11:25 pm #14383
BTCUSD 4 HOUR CHART – ANOTHER NEW RECORD HIGH

It has been almost straight up since around 67K, setting another record high at 93555, before correctly back to around 90K.
So let’s keep it simple. 90K will eventually dictate whether BTCUSD has enough behind it to make a run at 100K or back off into a range.
November 13, 2024 at 9:10 pm #14380November 13, 2024 at 9:06 pm #14379November 13, 2024 at 9:01 pm #14378November 13, 2024 at 8:58 pm #14377XAUUSD DAILY CHART – Is 2500 a risk?
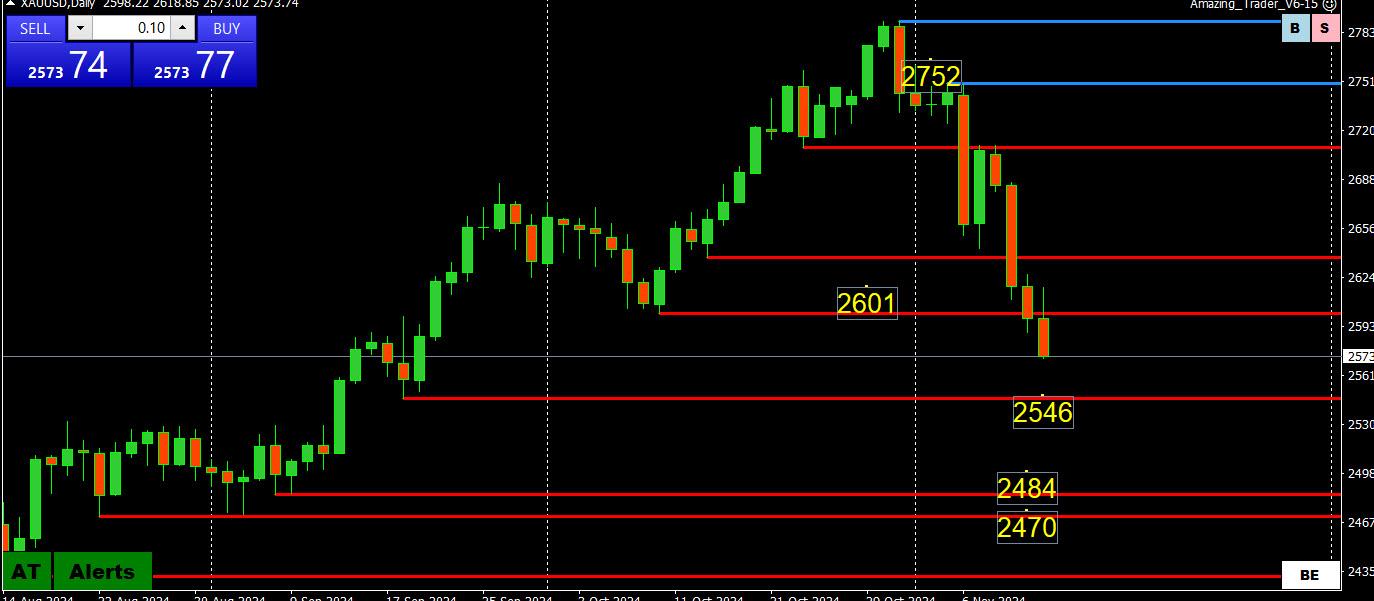
The failure to hold a bounce above 2600 keeps the risk on the downside.
Next support is at 2545 (suggests 2550 is pivotal) with next support below 2500 although this is likely the line in the sand on the downside.
Back above 2600 would be needed to neutralize the risk.
November 13, 2024 at 8:52 pm #14376November 13, 2024 at 8:09 pm #14375November 13, 2024 at 7:40 pm #14374November 13, 2024 at 7:08 pm #14373November 13, 2024 at 6:52 pm #14372November 13, 2024 at 6:39 pm #14371November 13, 2024 at 5:41 pm #14370November 13, 2024 at 5:12 pm #14364November 13, 2024 at 4:55 pm #14361November 13, 2024 at 4:35 pm #14360EURGBP 1 HOUR CHART – Chart speaks for itself
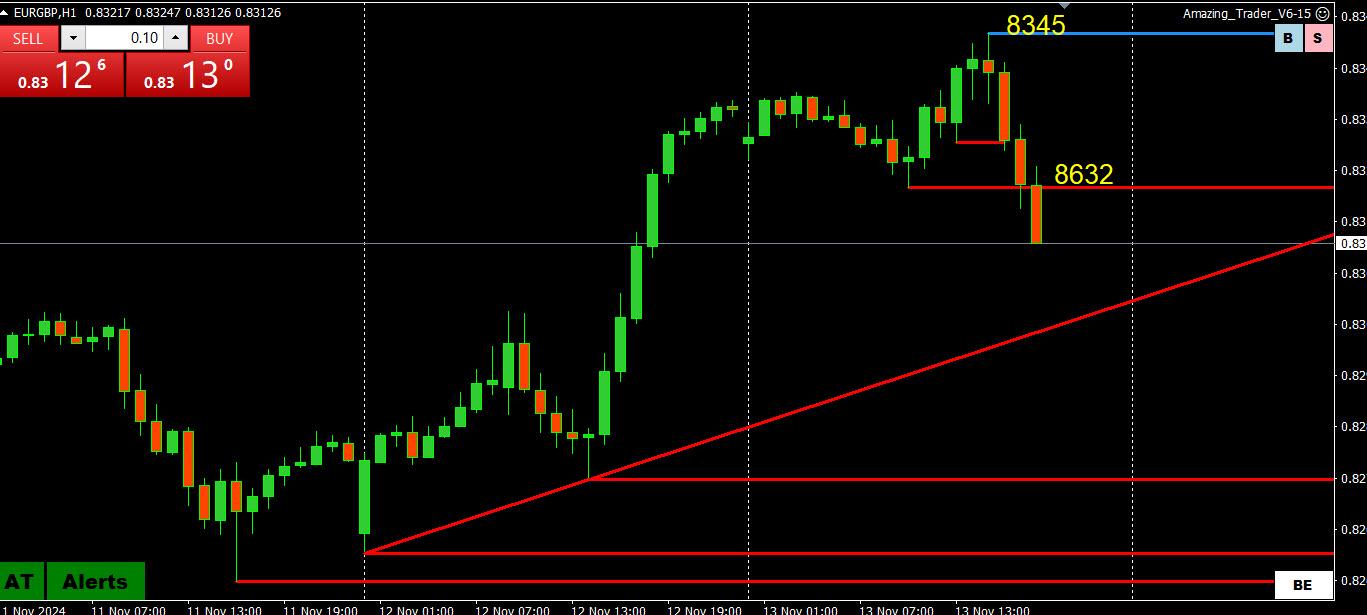
You have seen me focus on this cross as a clue to trading EURUSD and/or GBPUSD o I will let the chart speak for itself to explain the weak EURUSD and lagging GB=PUSD.
As I haver offered before, feel free to contact me (link in the top menu bar) if you want me to elaborate.
November 13, 2024 at 4:28 pm #14359US500 4 HOUR CHART – CONSOLIDATION?
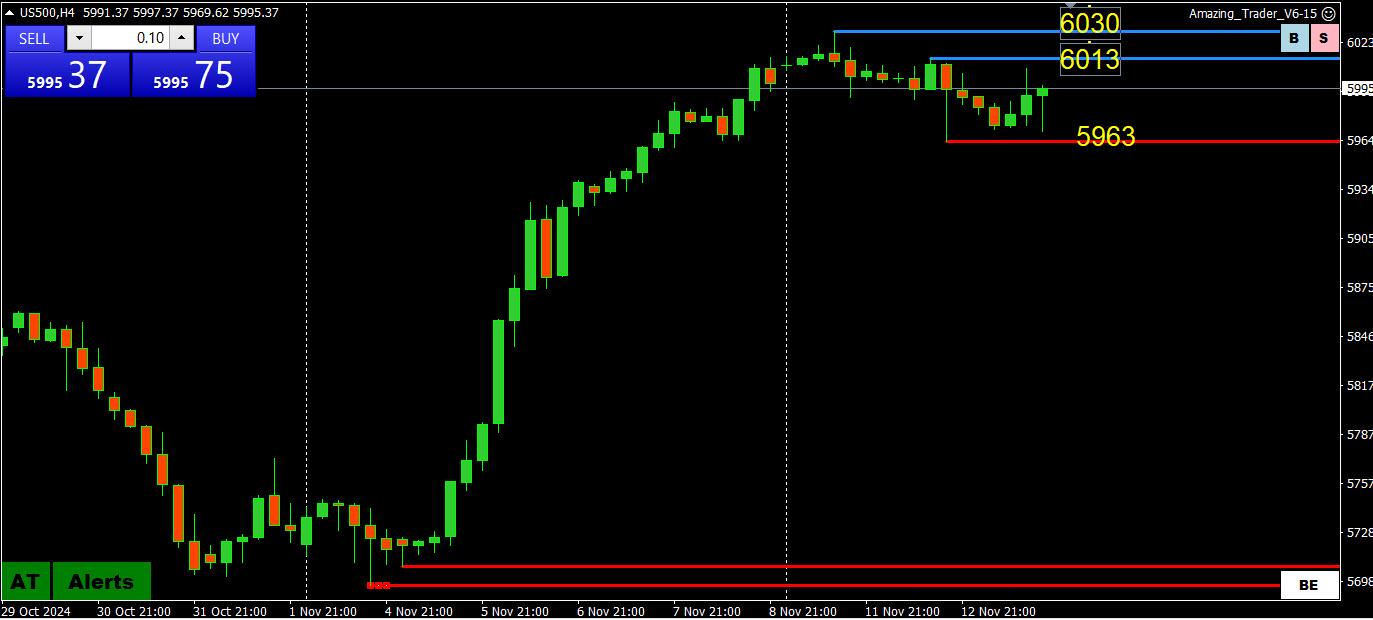
I posted this late yesterday and so far, this is just consolidation.
Keep an eye on 5963 as a break would suggest a pause and risk of a retracement.
On the other side, 6000 is clearly a majo pivotal level that will dictate whether this is just consolidation or risk of a deeper retracement.
November 13, 2024 at 4:23 pm #14358November 13, 2024 at 4:15 pm #14357November 13, 2024 at 3:07 pm #14350November 13, 2024 at 3:02 pm #14349November 13, 2024 at 2:36 pm #14348November 13, 2024 at 2:35 pm #14347MUST READ
I suggest reading this article in our blog, especially when the dollar dip after the CPI report, which ran some stops to take out weak longs, did not follow through. It was like a mini retracement.
Forex Trading Tip: How to Use Retracements to Your Advantage
 November 13, 2024 at 1:34 pm #14346November 13, 2024 at 1:26 pm #14343November 13, 2024 at 12:06 pm #14341
Thinking out loud… If stocks are taking a breather from the Trump Trade, will FX follow?
Reaction to US CPI will give a clue… See our Economic Calendar
November 13, 2024 at 11:45 am #14340NEWSQUAWK US OPEN
Dollar & USTs flat ahead of US CPI and a slew of Fed speakers
Good morning USA traders, hope your day is off to a great start! Here are the top 4 things you need to know for today’s market.
4 Things You Need to Know
European bourses are mostly on a modestly firmer footing; US futures are incrementally lower ahead of US CPI.
Dollar is flat, JPY marginally underperforms with USD/JPY briefly topping 155.00.
USTs are incrementally firmer and ultimately in stasis ahead of US CPI; Gilts continued to underperform.
Crude and precious metals gain but base metals remain subdued.
Not signed up to our squawk service yet?
Listen to our team of analysts broadcast the news that will impact the markets as it happens, and never be caught off guard again.
-
AuthorPosts



- You must be logged in to reply to this topic.
Search
© 2024 Global View