
- This topic has 27,806 replies, 54 voices, and was last updated 11 hours, 17 minutes ago by GVI Forex 2.
-
AuthorPosts
-
July 30, 2025 at 3:59 pm #28175July 30, 2025 at 3:57 pm #28174July 30, 2025 at 3:55 pm #28173July 30, 2025 at 3:46 pm #28172July 30, 2025 at 3:18 pm #28171
What’s Hot and What’s Not?
What’s hot?
USD is firmer across the board…
EURUSD below 1.15
USDCAD above 1.48
AUDUSD below ,6500
USDJPY tests 149+
Crude oil is up
What’ not?
All currencies extending lows vs the USD
Gold is down
US bonds (yields higher)
What’s hot/not?
US stocks treading water ahead of the FOMC decision and key earnings reports
 July 30, 2025 at 2:55 pm #28170July 30, 2025 at 2:36 pm #28169July 30, 2025 at 2:28 pm #28168
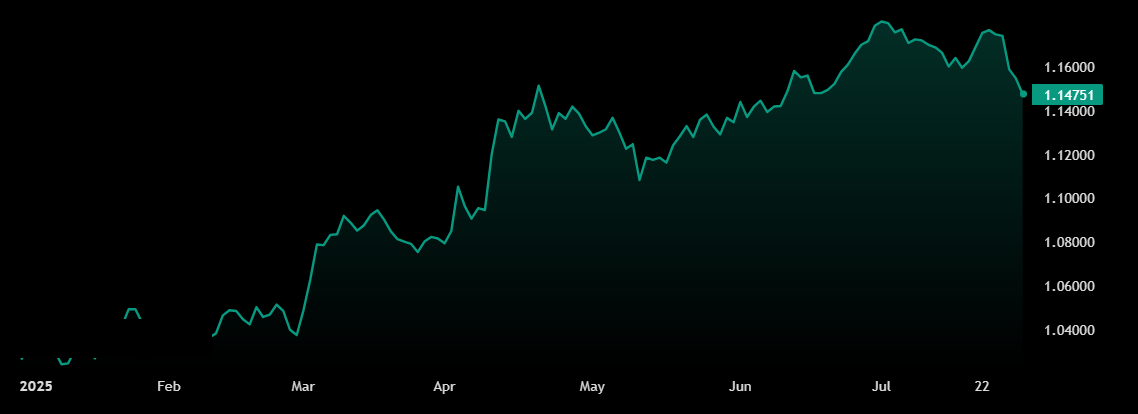
Euro Slips to Lowest Since Mid-June Amid Mixed Data and Fed Focus
The euro extended losses below $1.15, hitting its weakest level since mid-June, as investors digested a slew of economic data and turned their attention to the Federal Reserve’s policy decision on Wednesday.
New Eurostat figures showed the Eurozone economy grew a modest 0.1% in Q2, slowing sharply from 0.6% in Q1 but still exceeding expectations of no growth.
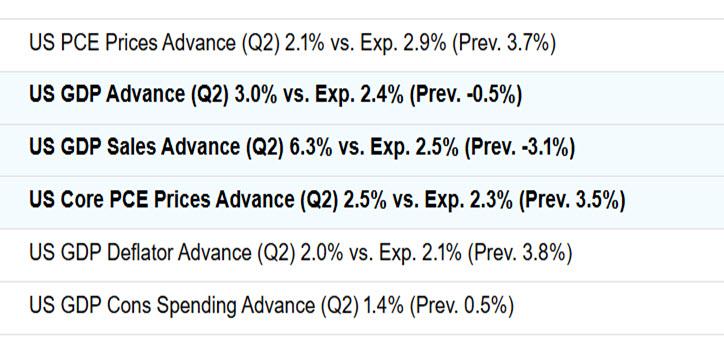
Meanwhile, the US dollar gained strength following strong Q2 GDP numbers and robust July private employment data.
On the trade front, investor sentiment remained cautious amid concerns that the recently announced U.S.-EU trade agreement disproportionately benefits the US, providing little boost to the eurozone’s sluggish outlook.
Expectations for European Central Bank rate cuts have also been pushed further out.
Markets now assign a 90% probability of a 25-basis-point cut by March 2026, while the likelihood of a move in December has fallen to 30%.
 July 30, 2025 at 2:21 pm #28167
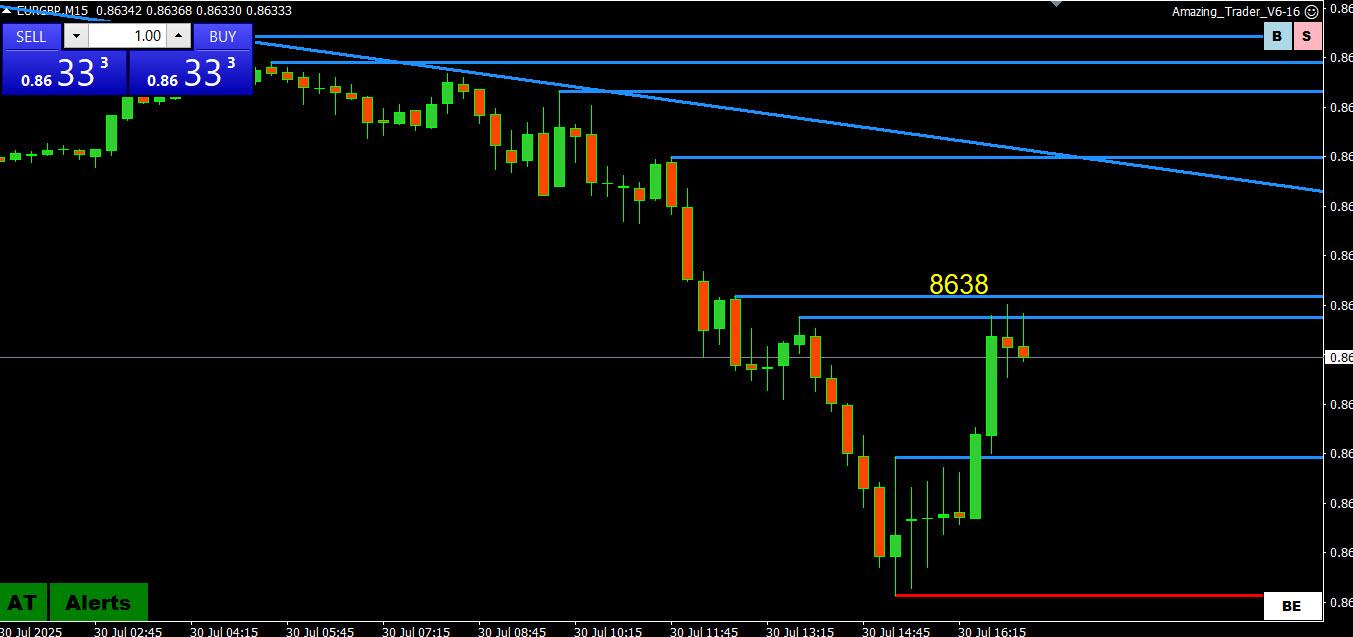
Looking for a reason for the EURUSD pop?
Look at a EURGBP chart… bounce in the cross, reversing some of the earlier sell-off, has created a tug-of-war the other way (i.e. EURUSD up, GBPUSD down)
Waatch .8636… former support broken earlier and 8638 AT resistance
‘
Scroll for earlier posts on EURGBPEURGBP 15 Minute Chart
 July 30, 2025 at 2:16 pm #28166July 30, 2025 at 1:54 pm #28164July 30, 2025 at 1:54 pm #28165July 30, 2025 at 1:49 pm #28163
No surprises from the BoC… Limited reCTION, USDCAD STILL holding above 1.38
 July 30, 2025 at 1:32 pm #28162
BTC Capital Rotation or Fresh Fund Inflows: What’s Really Fueling ETH’s Rally?
The consensus in the crypto market is that the ongoing ether (ETH) rally, which has extended to other altcoins, is driven by capital rotation from bitcoin (BTC). However, on-chain data obtained by CryptoQuant has proven that the information is false.
According to a report by CQ’s analyst Carmelo Aleman, fresh inflow from investors is driving the ETH rally, not capital rotation from bitcoin. Market participants are not selling BTC to buy ETH – the Bitcoin Realized Capitalization serves as evidence for this claim.What is Driving Ether’s Rally?
This month, ETH has climbed over 60% from $2,400 to $3,850. On the other hand, BTC has increased by 14% from $107,000 to hit an all-time high (ATH) above $123,000. Although BTC declined briefly to the $115,000 zone, it has consolidated mostly between $117,000 and $120,000.
As of July 25, bitcoin reached a new ATH in Realized Cap at $1.018 trillion. This metric represents the market cap of bitcoin by telling the price at which each BTC was last moved on-chain. Hence, it reflects the total acquisition cost of all BTC in circulation, factoring in accumulation trends and large-scale selling.
The increase in Realized Cap indicates that the capital invested in bitcoin is rising, not declining. So, instead ofdumpingBTC for ETH and other altcoins, investors are allocating fresh capital to their other crypto holdings.No Major Capital Rotation
Addressing bitcoin’s consolidation concerns, Aleman explained that such price pauses can be attributed to capital accumulation phases that come before exponential rallies. The market has witnessed such dynamics in past bull cycles; this time will be no different.
“So, what’s happening with ETH? The answer is simple: following the Genesis Law, along with the strong growth prospects of the Ethereum ecosystem, there has been a surge in capital invested in ETH this July, but without reducing positions in BTC,” the analyst added.
In conclusion, there is no major capital rotation from BTC to ETH. Investors are just injecting new capital through exchange-traded funds (ETFs) and other investment products. Institutional demand for ETH is currently at peak levels, with spot Ethereum ETF purchasesaccountingfor more than the daily production of ether.
Ethereum investment products just recorded their second-largest weekly inflow at $1.59 billion. Inflows into the products this year have exceeded the total recorded in all of 2023.
Market Cap Chart
 July 30, 2025 at 1:28 pm #28161July 30, 2025 at 1:18 pm #28160July 30, 2025 at 1:05 pm #28158July 30, 2025 at 1:02 pm #28157
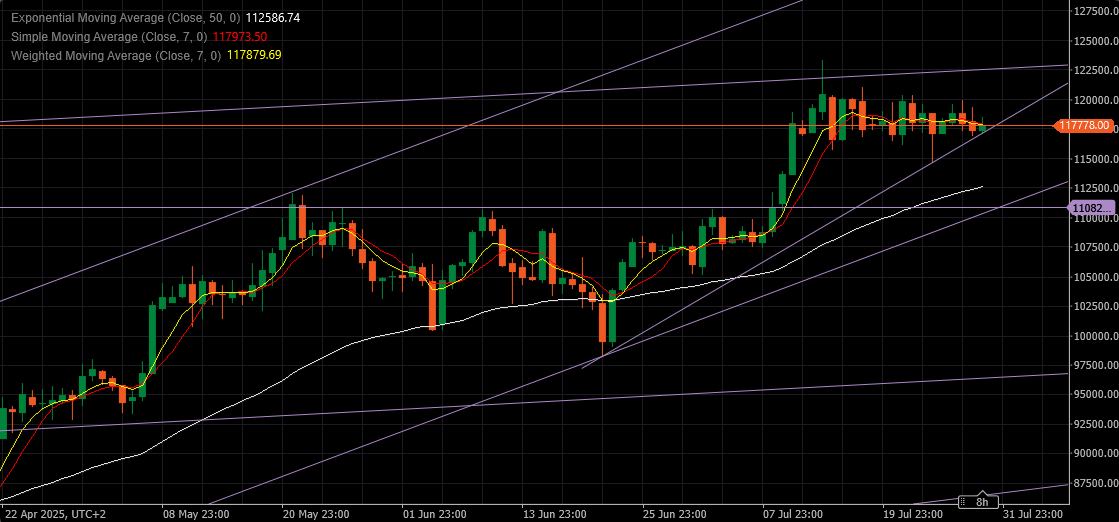
BTCUSD – Bitcoin
BTC is so far consolidating ( going sideways within a range of 116.900 – 120.300 )
Support that is important for keeping the Uptrend Intact is at 117.045
If lost today, opens a way for deeper correction towards 112.800 & 110.800 later on.
Resistances: 118.500, 119.850 & 120.300
Intraday pressure – Down with a game changer at 118.500
 July 30, 2025 at 12:40 pm #28156July 30, 2025 at 12:35 pm #28154July 30, 2025 at 12:33 pm #28153July 30, 2025 at 12:18 pm #28152July 30, 2025 at 12:16 pm #28151July 30, 2025 at 12:12 pm #28150July 30, 2025 at 12:10 pm #28149July 30, 2025 at 12:07 pm #28148July 30, 2025 at 12:00 pm #28147July 30, 2025 at 11:57 am #28146
USDCAD
Trying to extend its 5 day daily up pattern (green candles) ahead of the BoC rate decision.
Faces a a key level at 1.3798, the June high. This also suggests 1.38 will be pivotal going forward.
Support is at 1.3758 on multiple time frame charts, suggest using 1,3750 as well.
USDCAD DAILY CHART
 July 30, 2025 at 11:49 am #28145July 30, 2025 at 11:29 am #28144
 -
AuthorPosts







- You must be logged in to reply to this topic.
Search
© 2024 Global View