
- This topic has 28,112 replies, 54 voices, and was last updated 1 hour, 11 minutes ago by GVI Forex 2.
-
AuthorPosts
-
August 15, 2025 at 8:27 am #29051August 15, 2025 at 6:18 am #29050August 15, 2025 at 1:14 am #29049
GBPUSD Technical Analysis – The dovish bets keep the greenback on the backfoot The USD came under some renewed pressure following the US CPI report. The data was mostly in line with forecasts and not strong enough to deter the market from expecting a cut in September.
A September cut looks unavoidable now and only a hot NFP report in September might get us to a 50% probability, although it would certainly diminish expectations for rate cuts after the September one. For August, we have now just Fed Chair Powell’s speech at the Jackson Hole Symposium as the next major event.
Traders will be eager to see if he changes his stance as well.
On the GBP side, the BoE delivered a hawkish cut last week GBPUSD Daily On the daily chart, we can see that GBPUSD has rallied all the way up to the key swing level at 1.3590.
This is where we can expect the sellers to step in with a defined risk above the level to position for a drop back into the 1.3368 level.
The buyers, on the other hand, will want to see the price breaking higher to increase the bullish bets into the 1.38 handle next.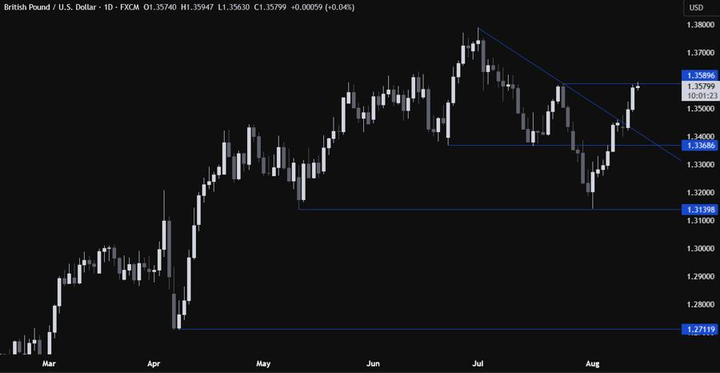 August 15, 2025 at 12:56 am #29048
GVI 11:36 / what is japan’s debt to gdp ?
does anyone care and if they do who and why ?what is japan’s demographics dynamic ?
does anyone care and if they do who and why ?bessent probably did a screw number on Strader’s rationalized trade call
from ballpark 148 to ballpark 146.50why ? because bessent is likely a recognized lawmaker / policymaker amongs his pears.
which the japanese suits likely did not appreciate being lectured to
especially in a public manner.and soooo .. result is unfortunate for the traders outside of the japanese govt brutality circle getting chewed up
August 14, 2025 at 11:36 pm #29045August 14, 2025 at 11:24 pm #29044Dollar Gains 0.26% to 147.77 Yen Dollar/Japanese yen: 147.77 Japanese yen per dollar (0.0068 dollar per Japanese yen)
• Today the dollar gained 0.26% vs. the Japanese yen
• Snaps a two session losing streak
• Off 6.69% from its 52-week high of 158.36 hit Wednesday, Jan. 8, 2025
• Up 5.09% from its 52-week low of 140.613 hit Monday, Sept. 16, 2024
• Down 1.03% vs the Japanese yen from 52 weeks ago
• Month-to-date it is down 1.99% vs the Japanese yen
• Year-to-date the dollar is down 6.00% vs the Japanese yen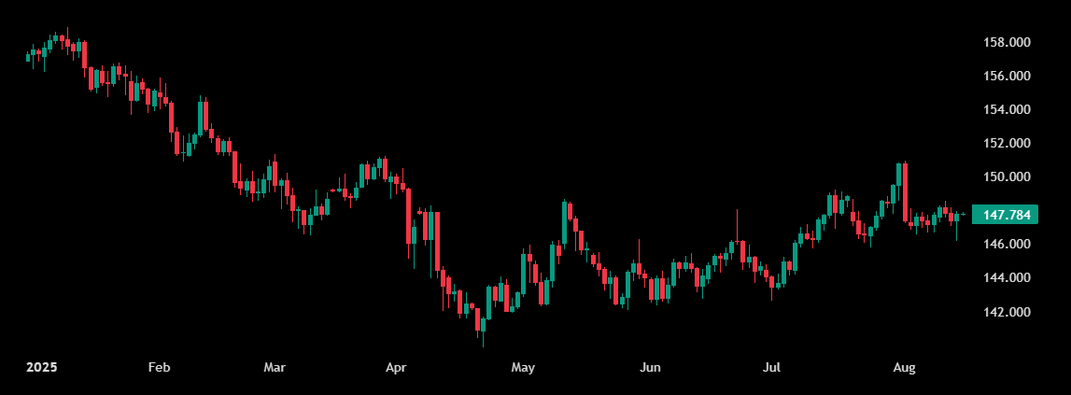 August 14, 2025 at 10:33 pm #29043
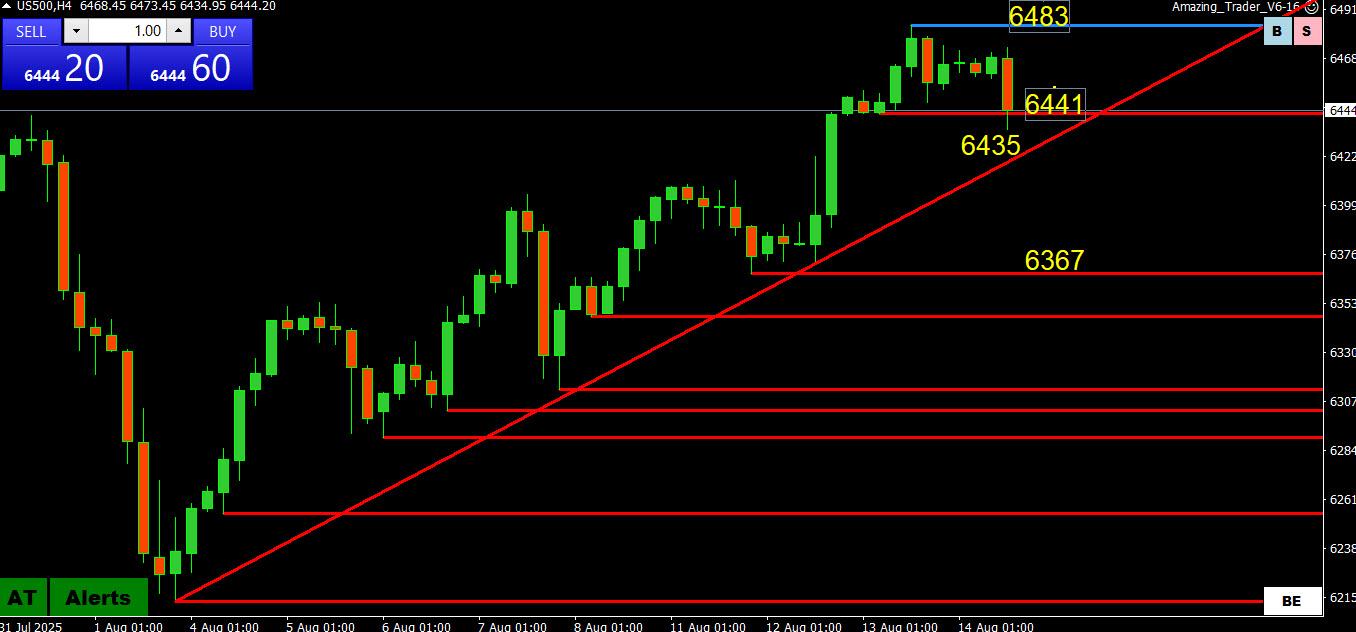
S&P 500 Rises 0.03% to 6468.54, Record Close
The S&P 500 Index is up 1.96 points or 0.03% today to 6468.54
• A new record close
• 18th record close of 2025
• Up for three consecutive trading days
• Up 95.09 points or 1.49% over the last three trading days
• Largest three-day point and percentage gain since Tuesday, Aug. 12, 2025
• Up four of the past five trading days
• Up 11.86% from the Election Day close of 5782.76 on Tuesday, Nov. 5, 2024
• Up 7.87% from the Inauguration Day close of 5996.66 on Monday, Jan 20, 2025
• Up 14.06% since tariffs were announced on Wednesday, April 2, 2025
• Up 29.82% from its 52-week low of 4982.77 hit Tuesday, April 8, 2025
• Rose 16.69% from 52 weeks ago
• Up 29.82% from its 2025 closing low of 4982.77 hit Tuesday, April 8, 2025
• Month-to-date it is up 2.04%
• Year-to-date it is up 586.91 points or 9.98%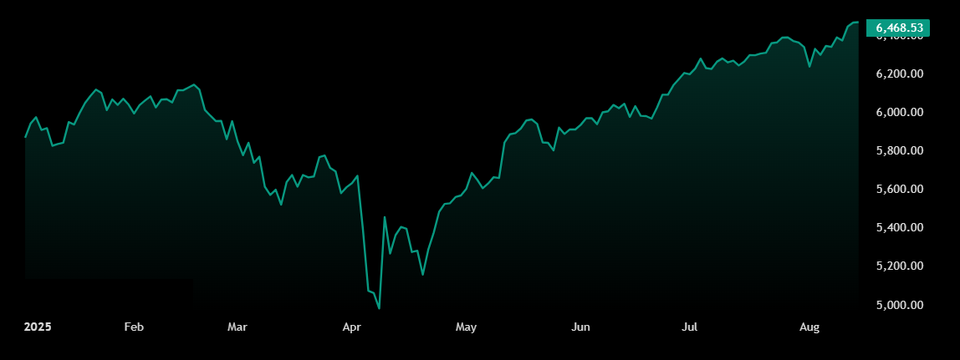 August 14, 2025 at 10:14 pm #29042August 14, 2025 at 8:34 pm #29041August 14, 2025 at 8:25 pm #29040August 14, 2025 at 8:20 pm #29039
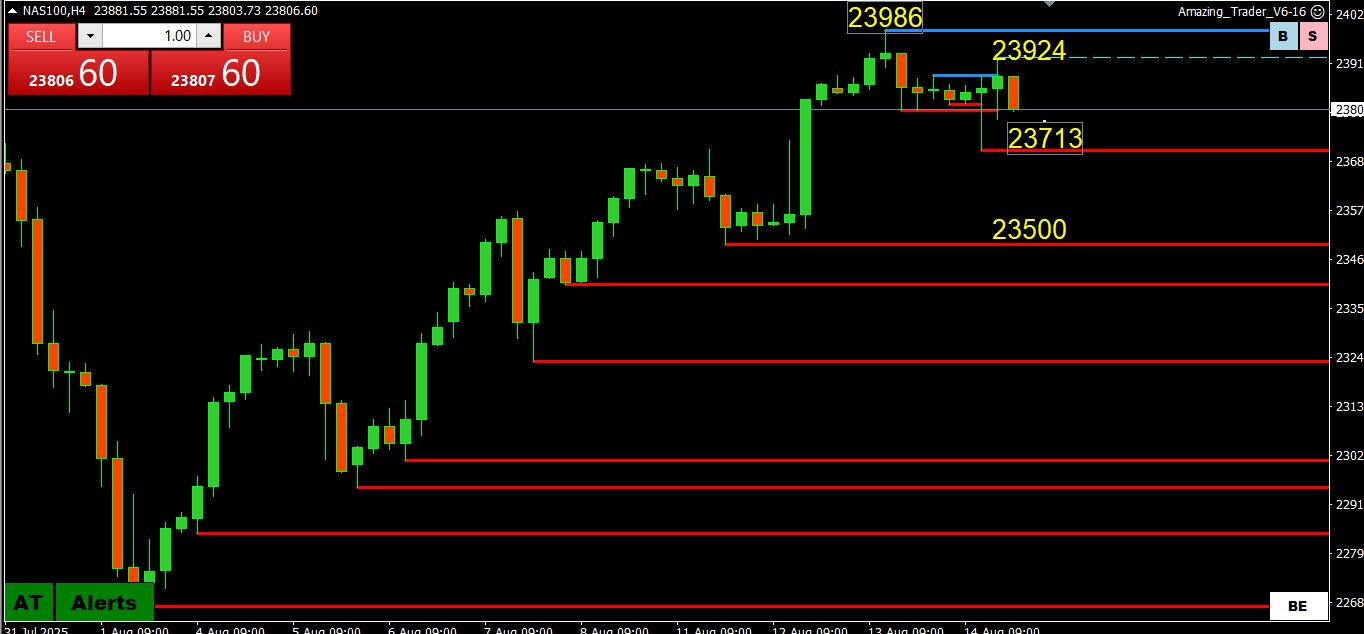
USDJPY
What a day! Not a good one for the bears who overstayed their welcome.
Once again USDJPY found support in the 146.xx handle, this time at a lower 146.21
The leaves the wide range 146.20-148.50 with the move above 147.50 breaking the downward momentum… it is also the level that would need to become support to revive a risk to 148+.
Otherwise, expect choppy trading within the wide range.
USDJPY 4 HOUR CHART
 August 14, 2025 at 8:09 pm #29038August 14, 2025 at 8:06 pm #29037August 14, 2025 at 7:58 pm #29036August 14, 2025 at 7:52 pm #29035August 14, 2025 at 7:42 pm #29034August 14, 2025 at 7:20 pm #29029August 14, 2025 at 7:17 pm #29027August 14, 2025 at 4:31 pm #29026August 14, 2025 at 3:34 pm #29025August 14, 2025 at 3:10 pm #29020August 14, 2025 at 2:55 pm #29019
What’s hot and what’s not?
What’s hot?
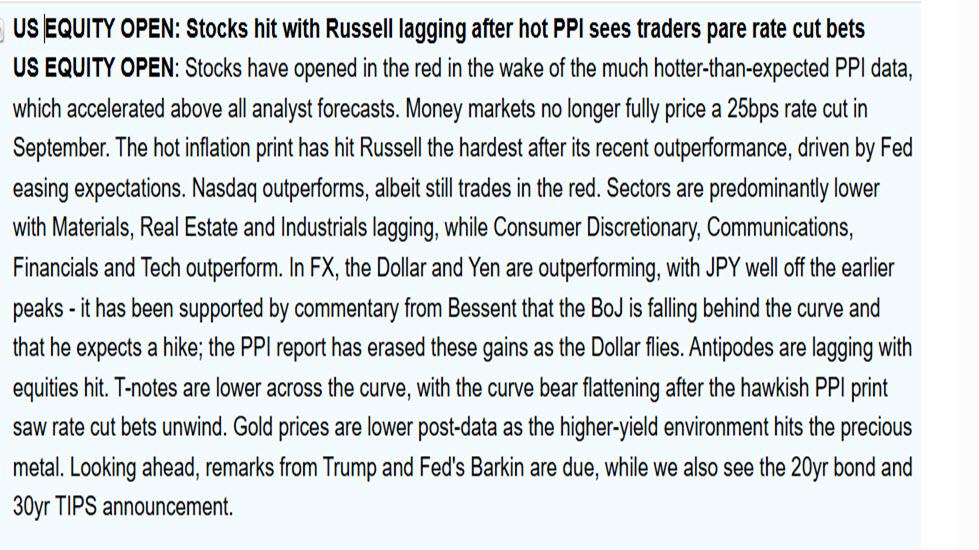
The dollar is up following the hotter PPI
What’s not?
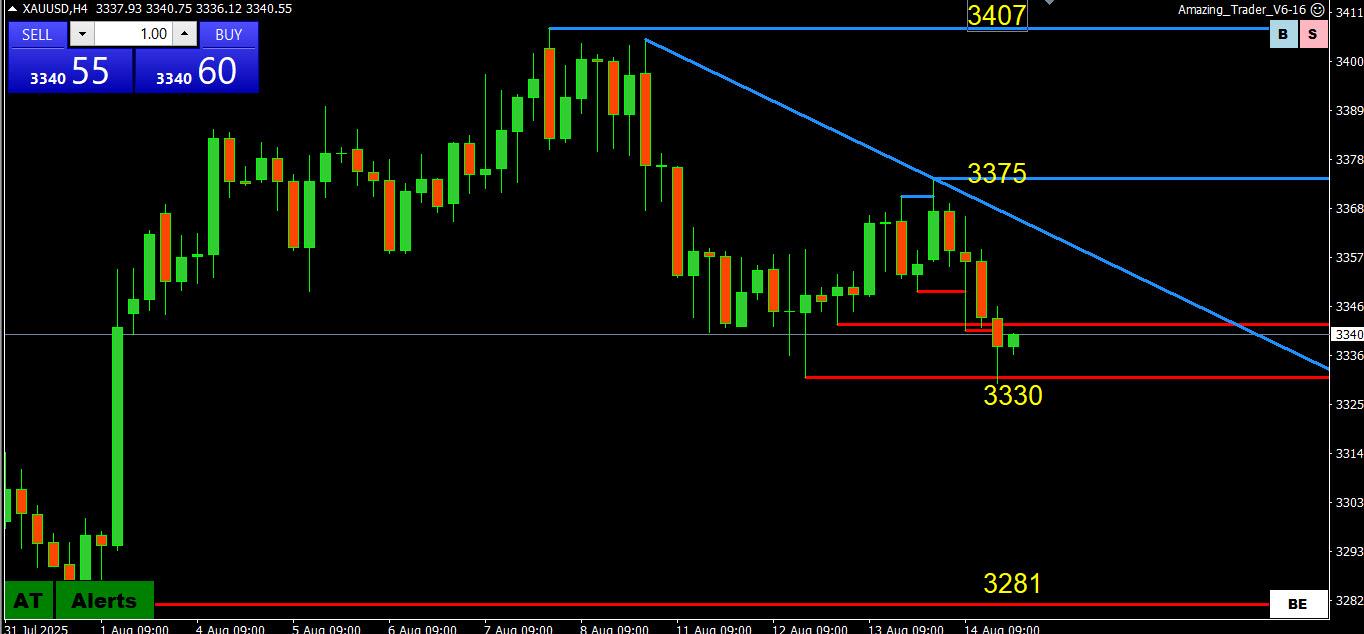
GOLD has retreated from an earlier high
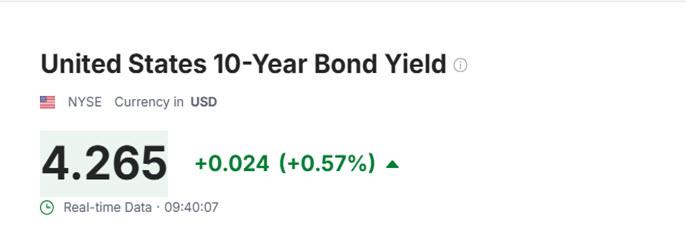
US bonds are down (yields up) but within recent ranges
BITCOIN is back below 120,000 after briefly setting a record high
What’s Hot/Not
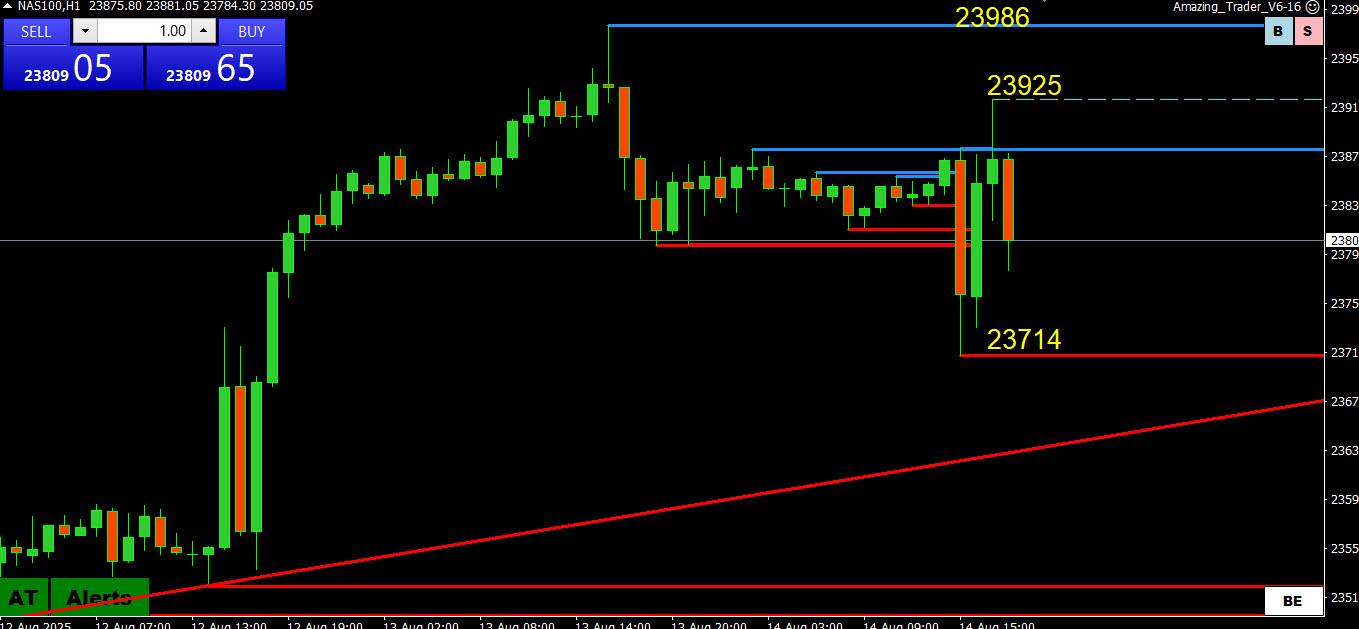
U.S. stocks have bounced from a post-PPI sell off
 August 14, 2025 at 2:09 pm #29018August 14, 2025 at 1:53 pm #29017August 14, 2025 at 1:51 pm #29016August 14, 2025 at 1:45 pm #29015August 14, 2025 at 1:23 pm #29014August 14, 2025 at 1:11 pm #29013August 14, 2025 at 1:07 pm #29012August 14, 2025 at 1:05 pm #29011
 -
AuthorPosts







- You must be logged in to reply to this topic.
Search
© 2024 Global View