
- This topic has 28,115 replies, 54 voices, and was last updated 7 hours, 33 minutes ago by Belgrade Bobby.
-
AuthorPosts
-
September 12, 2025 at 6:14 pm #30670September 12, 2025 at 4:34 pm #30669September 12, 2025 at 3:36 pm #30668September 12, 2025 at 3:28 pm #30667
What’s hot and what’s not?
Feels like a TGIF market
What’s hot?
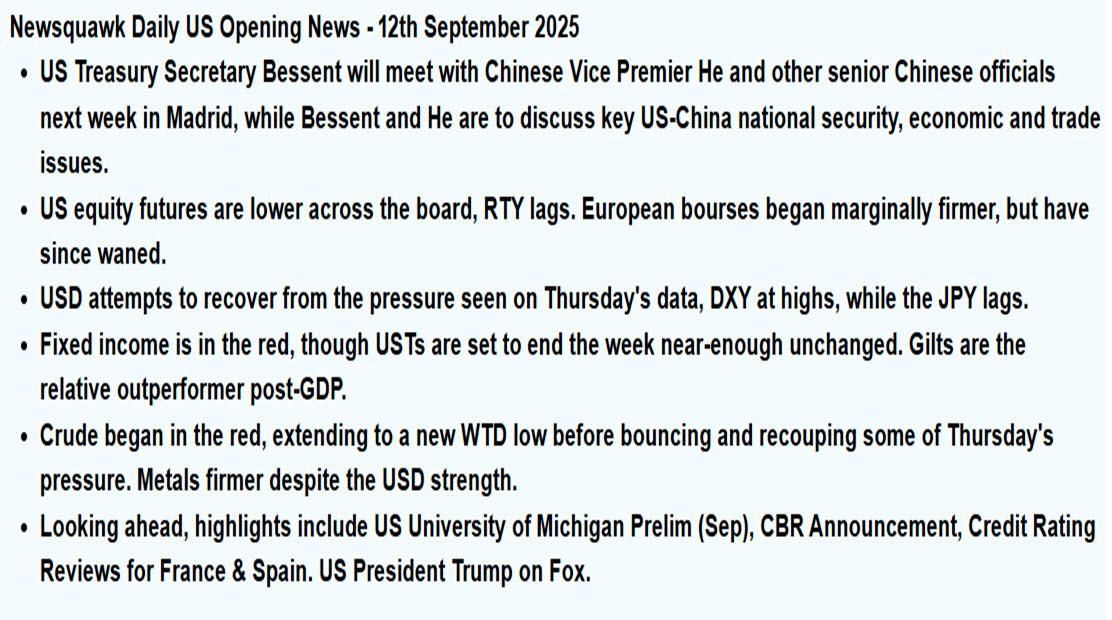
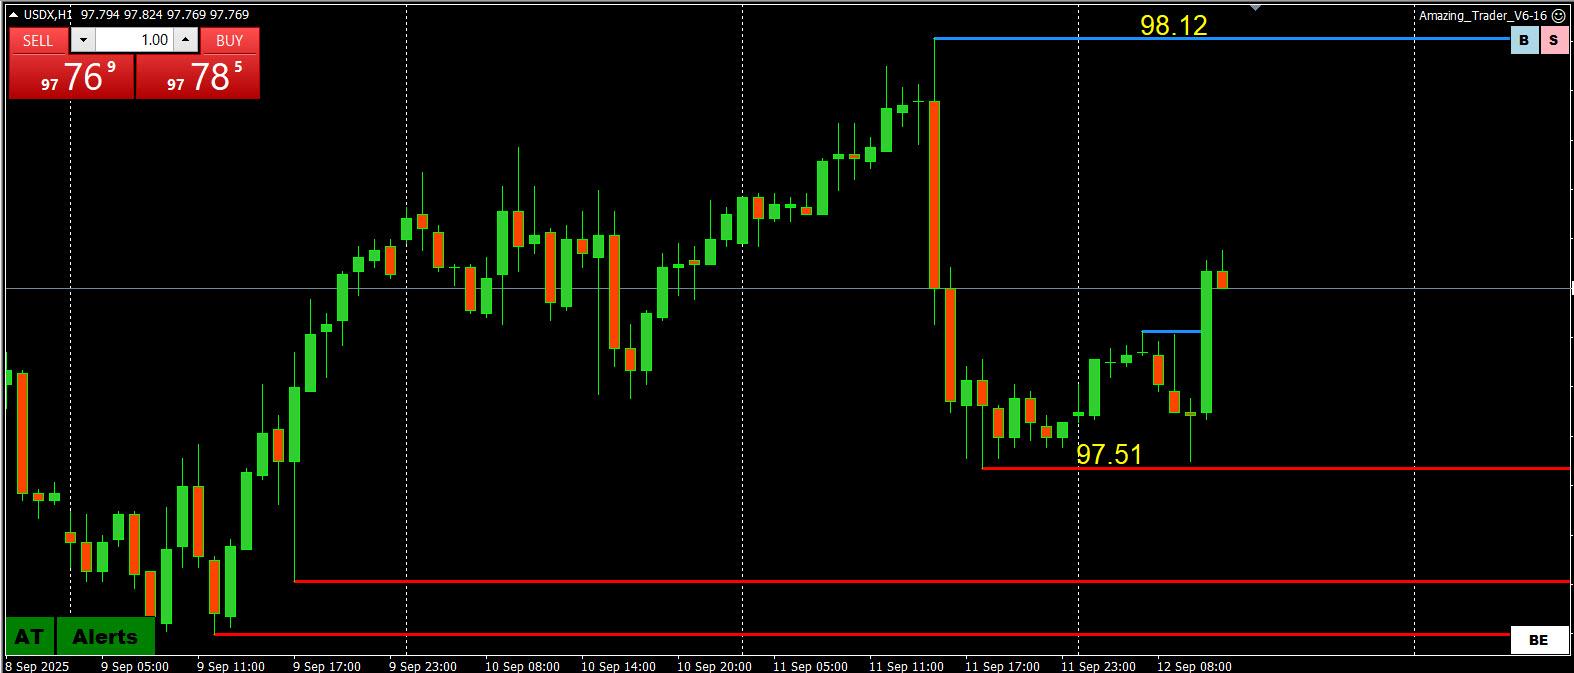
Dollar fis up on the day but off highs
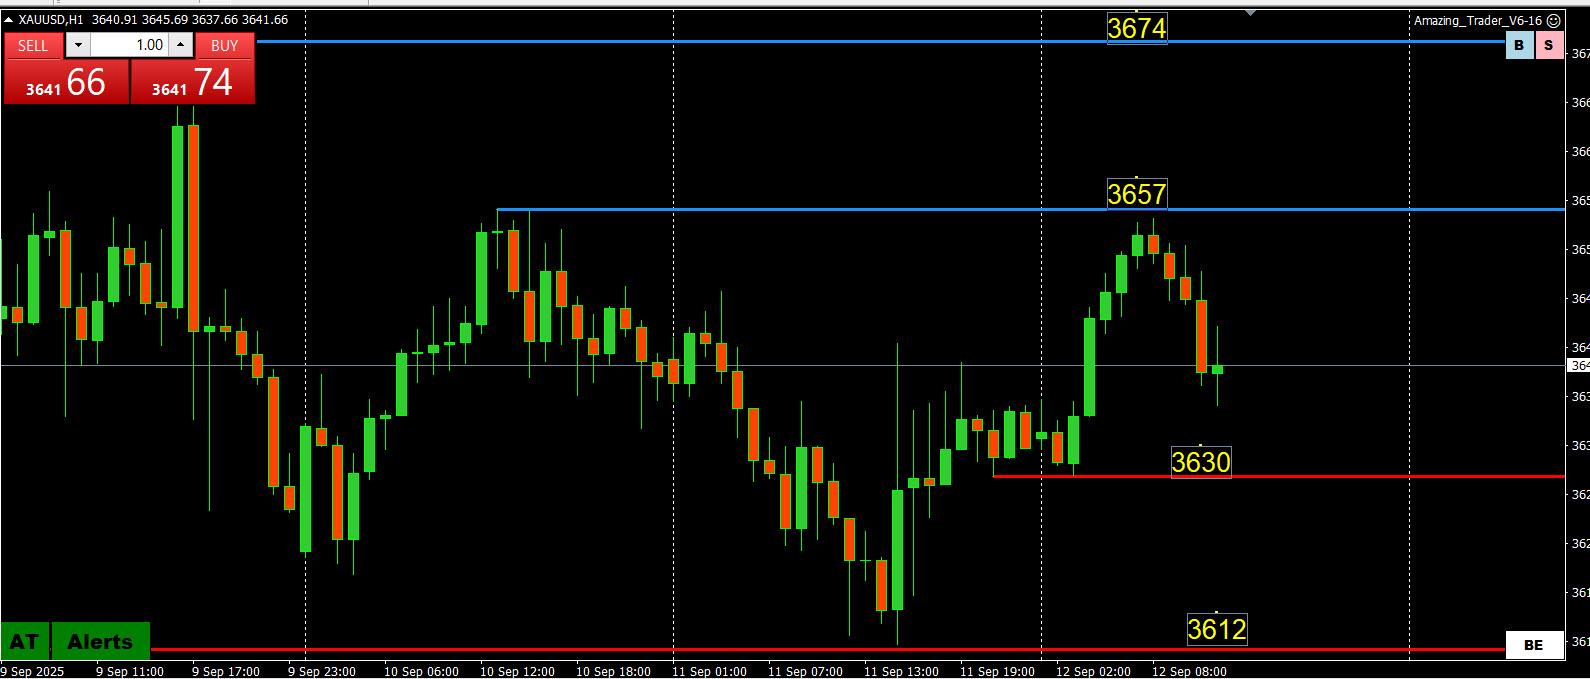
Gold is up but still consolidating
Crude oil is up
What’s not?
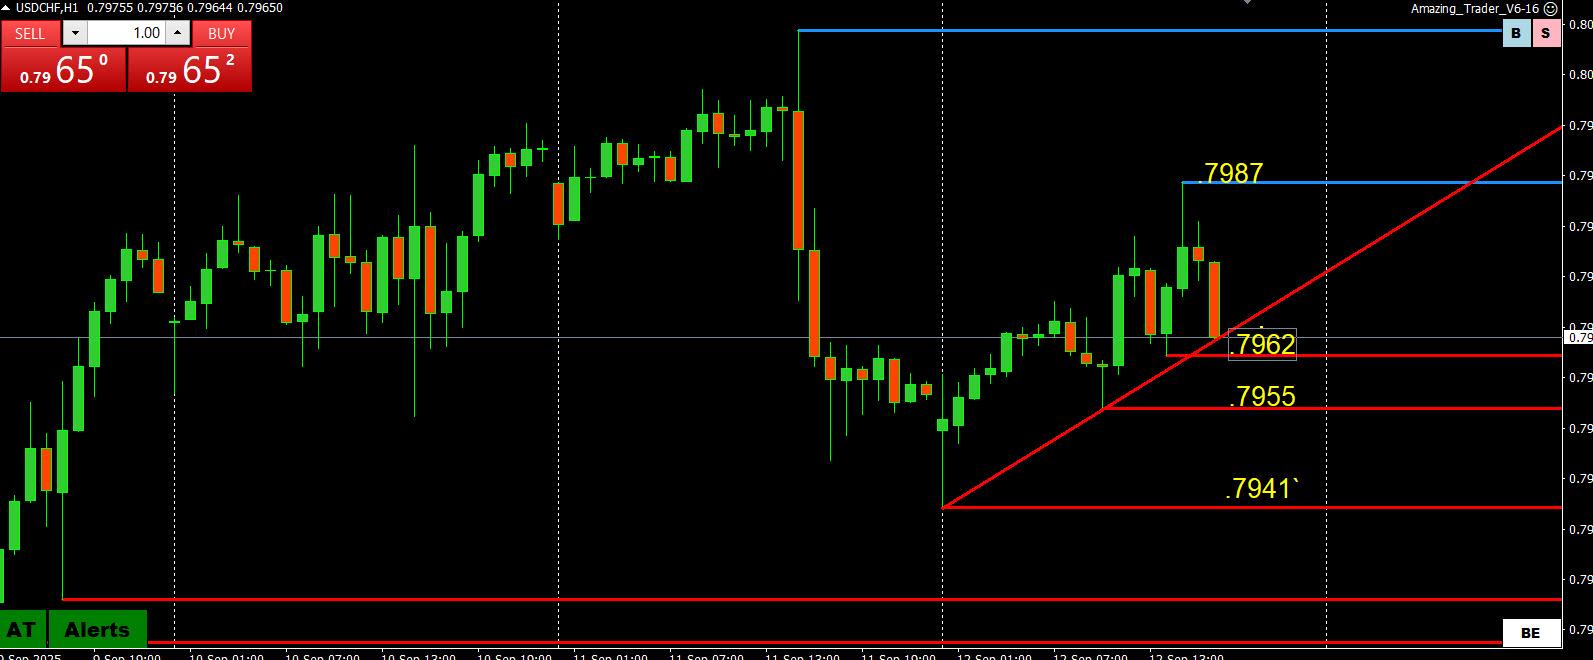
Currencies are weaker on the day vs. the USD but off the lows
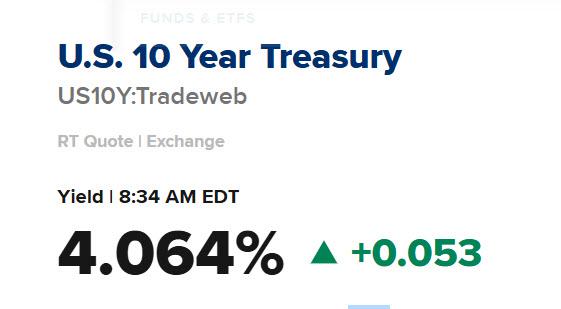
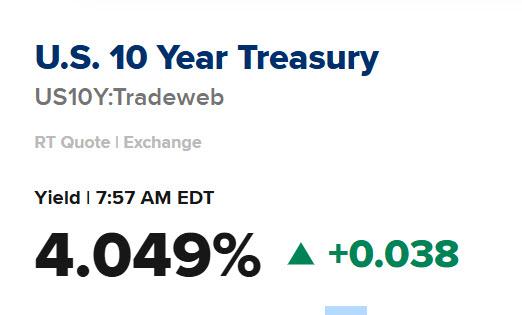
Bonds are down (yields are up)
What’s hot/not?
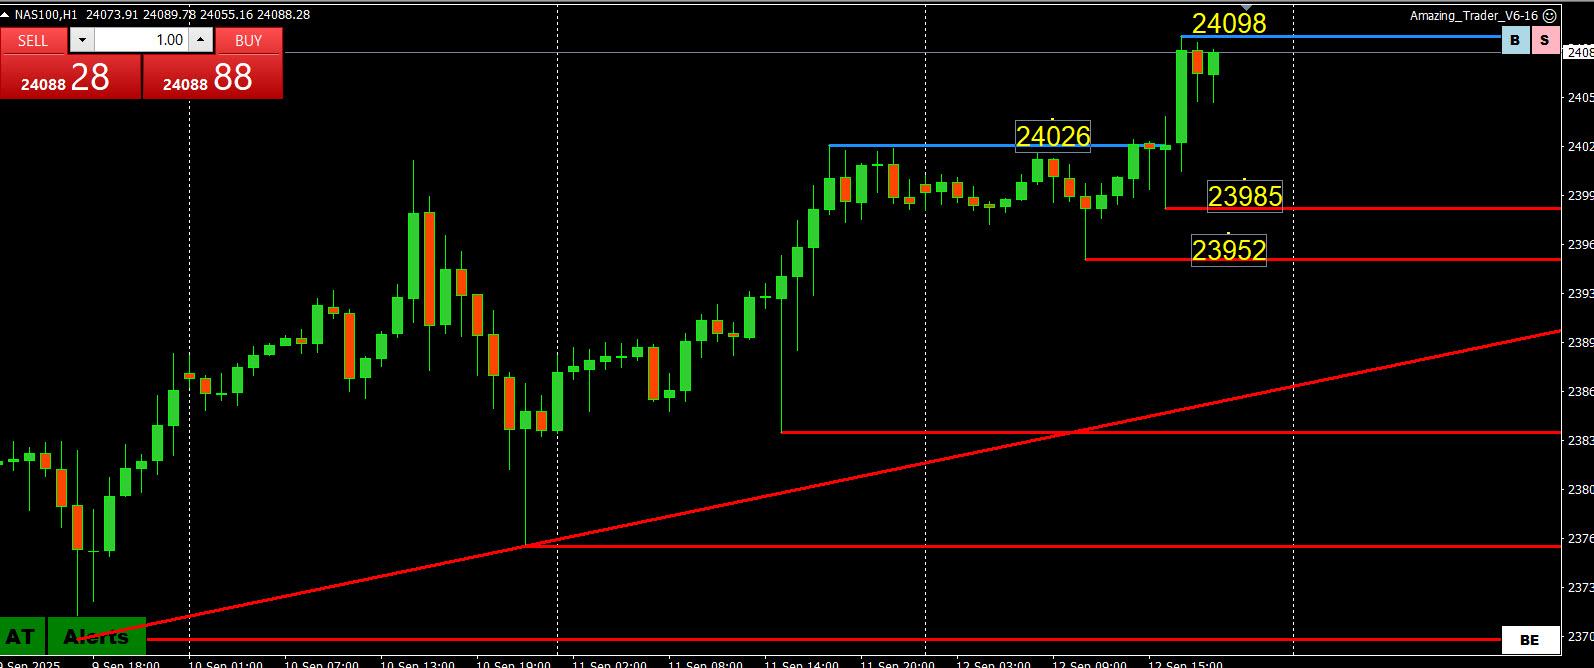
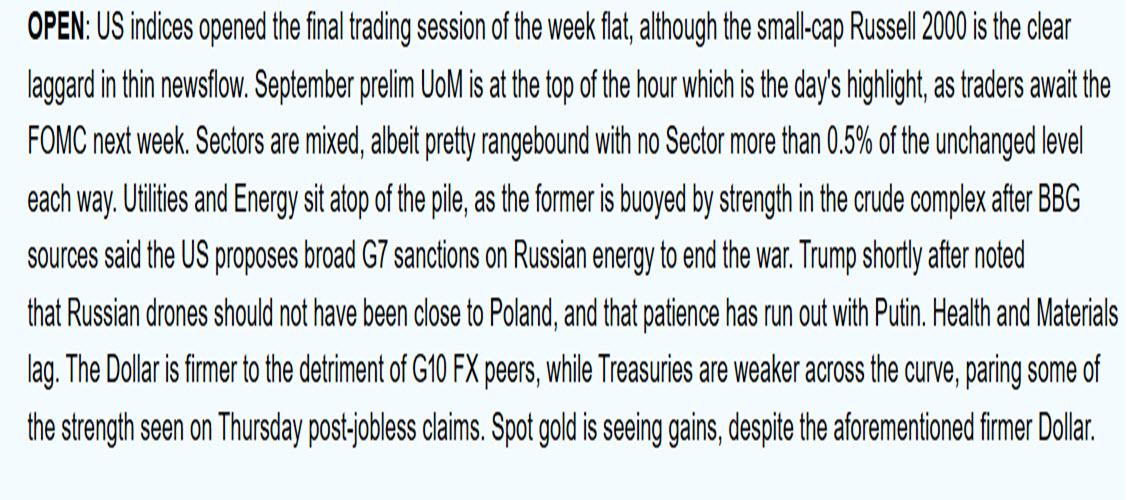
Stocks are mixed: NASDAQ up, DJIA down, SP500 about flat
 September 12, 2025 at 3:18 pm #30666September 12, 2025 at 2:52 pm #30662
DLRx 97.716 at 10:45 AM EDT
UofM could have been market mover, it did move some but only insignificantly and now practically back to zero effect
We are being spared FED yakkers’ “wisdom” as they are now in their blackout period ahaead of next week wednesday “decision”
***
When is fitch going to release its potential downgrade of France’s credit rating ?
September 12, 2025 at 2:38 pm #30659September 12, 2025 at 2:20 pm #30656September 12, 2025 at 2:18 pm #30655September 12, 2025 at 2:04 pm #30653U of M sentiment: Big miss on downside, inflation expectations sticdky to higher
 September 12, 2025 at 1:34 pm #30647
Next up is the Univ of Mich consumer sentiment report
Pay attention to inflation expectations as well as the headline #
Click for the consensus forecast
 September 12, 2025 at 1:10 pm #30646September 12, 2025 at 12:50 pm #30645September 12, 2025 at 12:48 pm #30644September 12, 2025 at 12:45 pm #30643September 12, 2025 at 12:36 pm #30642September 12, 2025 at 12:01 pm #30641September 12, 2025 at 11:10 am #30640September 12, 2025 at 10:59 am #30639
Trading TP: When to Fade a Correction
There is not a set rule for this but my experience is that fading a correction (retracement) of a prevailing trend that takes place early in the European or NY session has a good chanve of working out.
Think about it.
A market is better able to absorb retracement flows (i.e. buying or selling) that take place early in the session when there is full liquidity and less able to absorb correction flows that take place late in the NY trading day when liquidity has thinned..
As with any trading pattern, the overall picture needs to be taken into account and whether news, technical levels or indicators being violated, etc. have occurred that would make it more than just a retracement and would change the trend.
Trading
Tip: Identify a trend and then keep in mind it is a better odds trade to fade a correction when a market is at full liquidity than later in the day when flows are harder for a market to absorb flows..
 September 12, 2025 at 10:37 am #30638
The pattern shown in the prior post is called the AT Directional Indicator (EURUSD last at 1.1731
Click for an Amazing Trader 30 day free trial
 September 12, 2025 at 10:12 am #30637
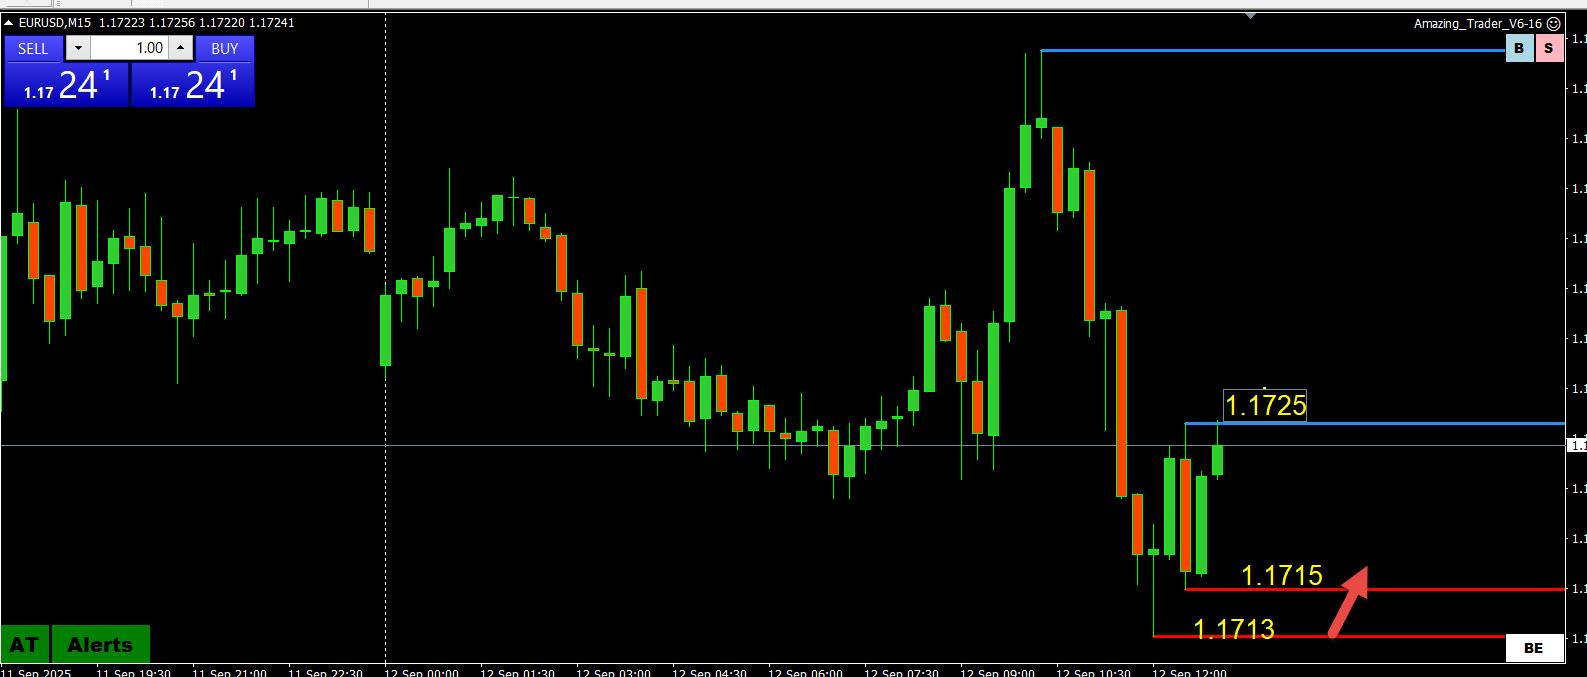
EURUSD
2 RED Amazing Trader lines drawn off the low indicates a potential change in directional risk. that would need a firm move through 1.1725 to build momentum.
EURUSD 15 MINUTE CHART
 September 12, 2025 at 10:00 am #30636September 12, 2025 at 9:56 am #30635
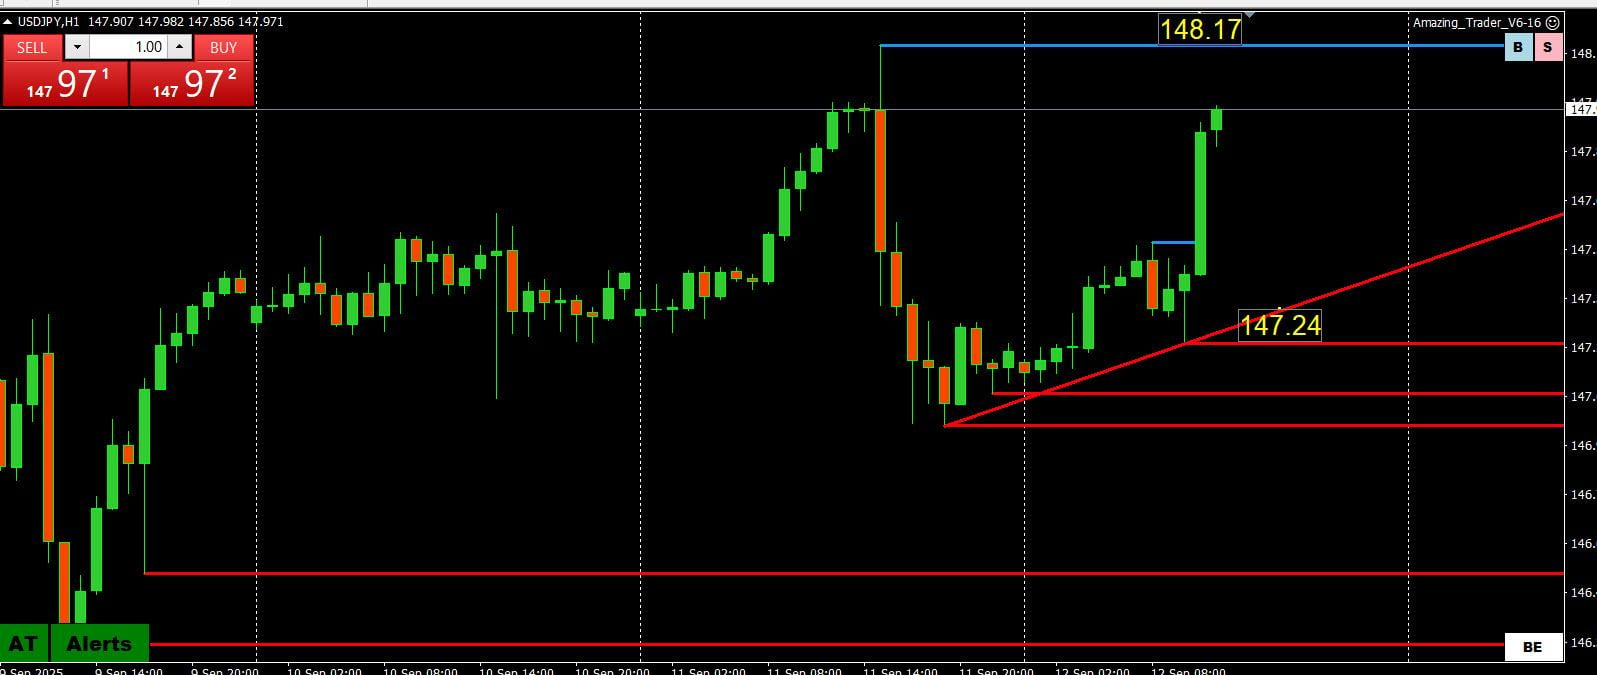
USDJPY
JPY underperforming and confounding as it is generally a beneficiary of lower US interest rates.
It is not clear how much the political instability in Japan is a factor but in any case, it is closest to retracing yesterday’s USD sell off but faces tough obstacles at 148.00 and 148.17
USDJPY 1 HOUR CHART
 September 12, 2025 at 9:45 am #30634
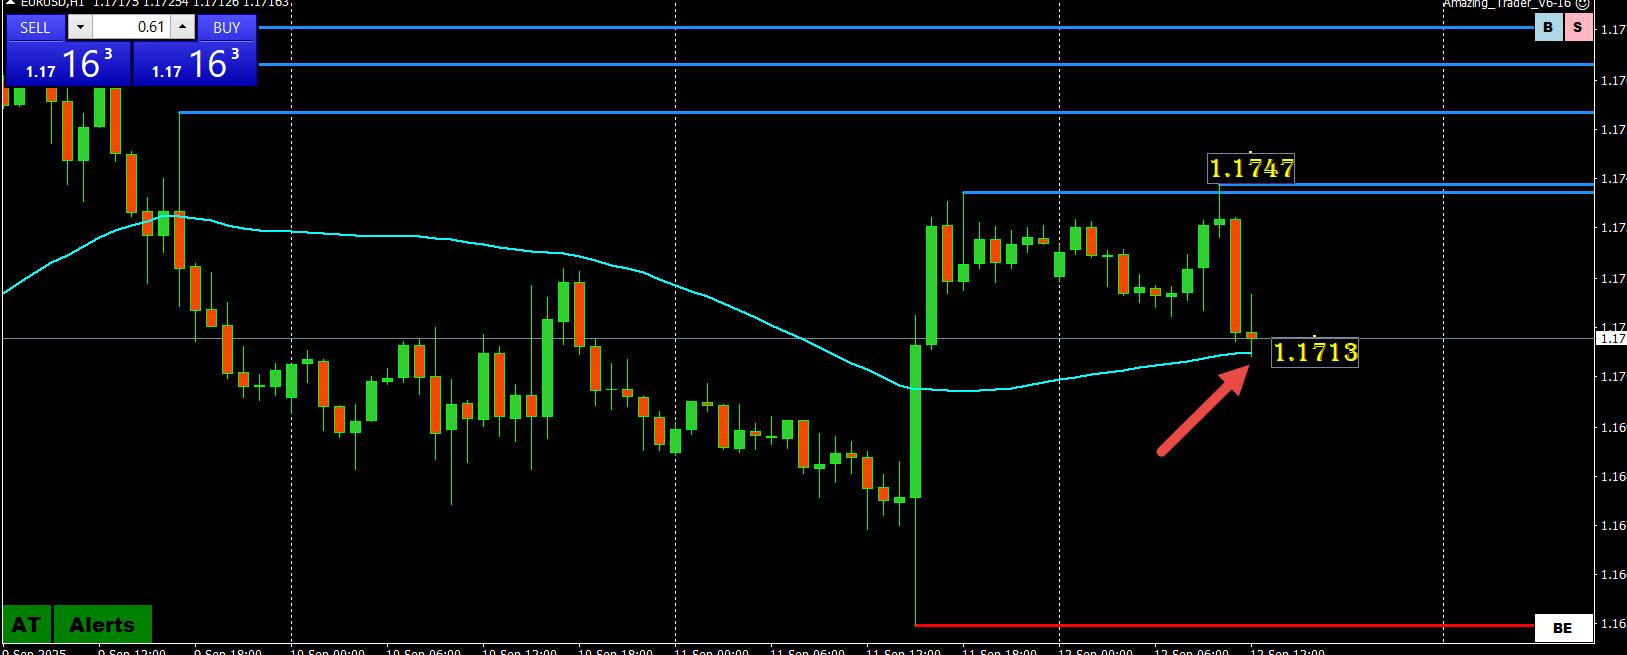
EURUSD
What caught my eye:
Pause below 1.1750 (high 1.1747)
Test of 50 period mva around the low at 1.1713, holding so far
Otherwise, no obvious nearby supports other than the low of the day (and 50 period mva) after the one way move up yesterday, leaving 1.17 needing to hold to keep a bid.
EURUSD 1 HOUR CHART
 September 12, 2025 at 9:36 am #30633September 12, 2025 at 9:22 am #30632September 12, 2025 at 9:13 am #30631
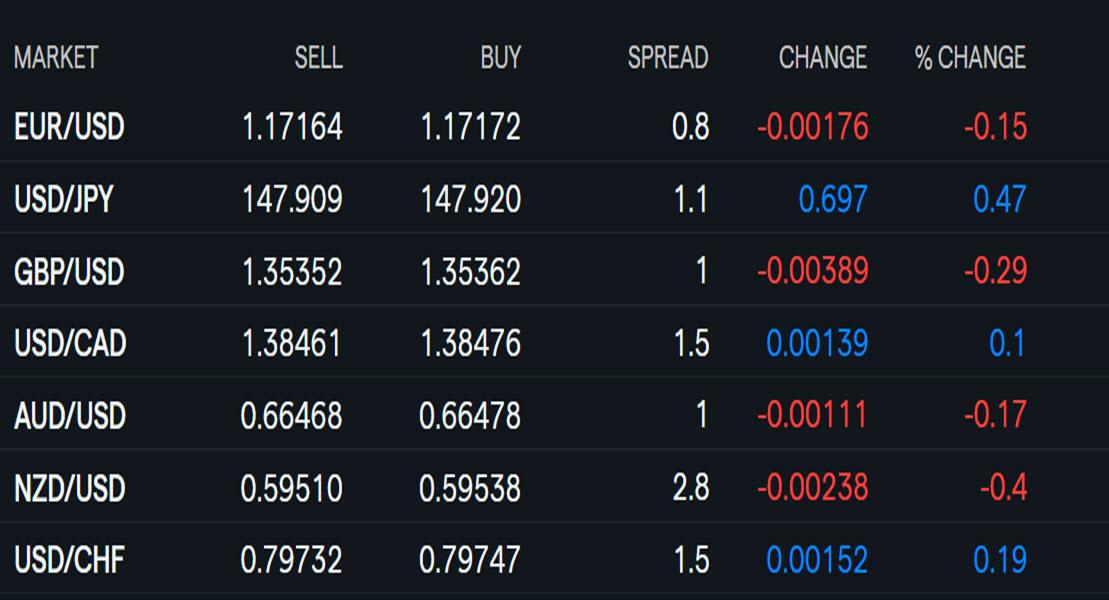
Using my platform as s Heatmap shows…
… the dollar trading firmer after not following through on yesterday’s weaker close.
What caught my eye:
EURUSD pause below 1.1750 (high 1.1747)
USDJPY back in spitting distance of 148
No apparent news behind the firmer USD
On order of relative strength vs the USD*
1. CAD
2. EUR
3. AUD
4. CHF
5. CHF
6. NZD
7. JPY
 September 11, 2025 at 10:57 pm #30630
With the ECB on hold and the Fed expected to cut rates, this article is worth revisiting or for others a must first read about
Interest Rates and Why they Matter to Forex Traders
 September 11, 2025 at 10:26 pm #30629September 11, 2025 at 10:26 pm #30628
-
AuthorPosts






- You must be logged in to reply to this topic.
Search
© 2024 Global View