
- This topic has 28,115 replies, 54 voices, and was last updated 8 hours, 20 minutes ago by Belgrade Bobby.
-
AuthorPosts
-
February 16, 2026 at 10:58 am #36427
USDJPY UPDATE:
- Post-election downtrend showing signs of running out of steam after repeated support (higher lows) in the 152s.
- However, a firm break of 153.75 is what would be needed to confirm USDJPY has lost momentum and shift the risk to 154.65, which guards a return to 155.
- Otherwise, focus stays on 153, a level that has printed 4 days in a row..
USDJPY 4 HOUR CHART
 February 16, 2026 at 10:42 am #36426
XAUUSD UPDATE
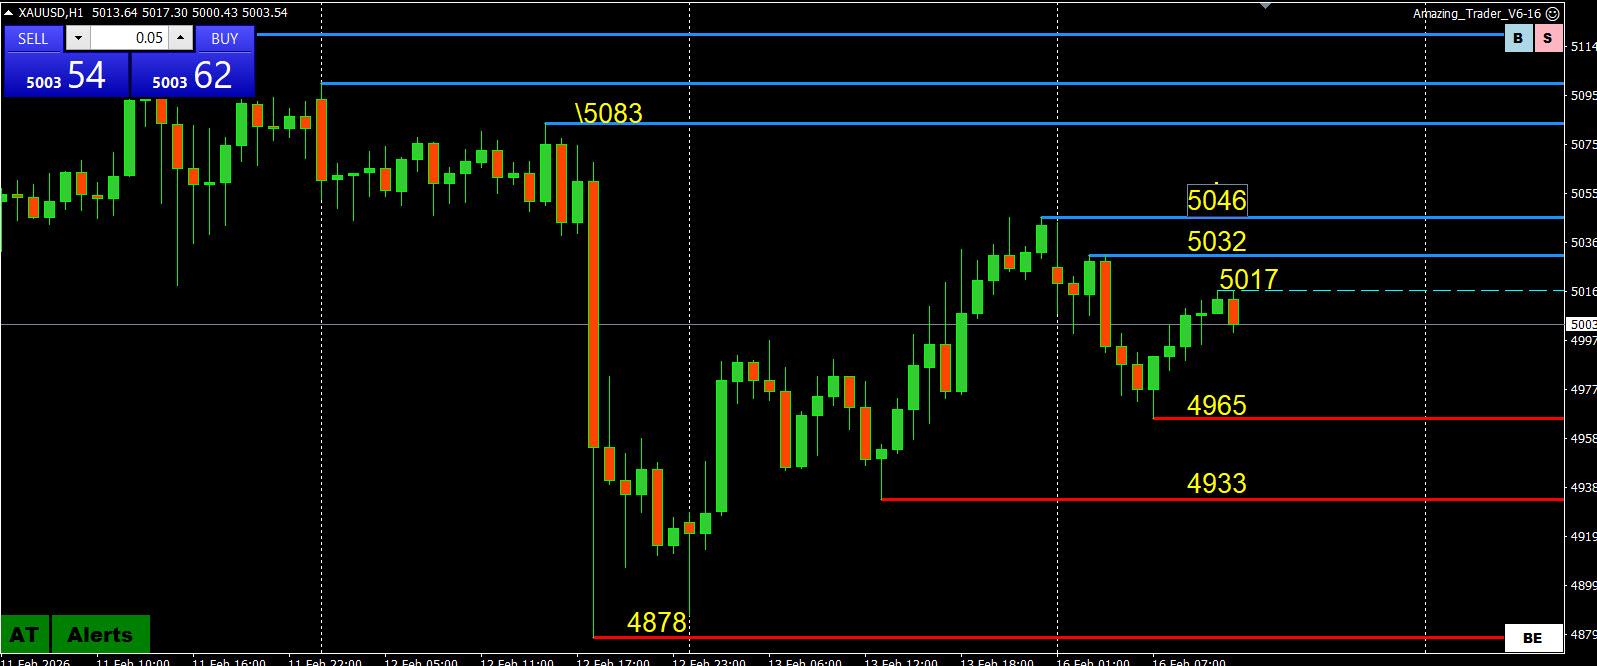
- Unable to shake its focus from $5000, which has traded for the 3rd day in a row (and 6 out of the past 8 days) and will eventually be the level that dictates whether bulls will or will not regain control.
- US holiday, China starting its week long Lunar holiday,US-Iran and Russia-Ukraine talks in Geneva tomorrow may be retraining the market.
- Intra-day range:4965-5043 (see chart)
- Right click on chart to open a full screen in a new tab
XAUUSD 1 HOUR CHART
 February 16, 2026 at 10:20 am #36425
Today’s US Equity News
DAY AHEAD: Today’s docket is thin, on account of President’s Day. In Europe, the ECB will release parts of its economic bulletin, with today’s update on ‘structural barriers to the green transition’. Eurozone industrial production data for December is due. The Eurogroup will hold a meeting to discuss the draft Council recommendation on the economic policy of the Euro area for 2026, with a view to its approval by the Economic and Financial Affairs Council on Tuesday. In the afternoon, Fed’s Bowman (voter, dovish) will speak at a bankers conference.
WEEK AHEAD: Highlights include US PCE and GDP; FOMC minutes, RBNZ policy announcement; flash PMIs; UK, Canadian and Japanese inflation metrics. US-Iran talks are taking place on Tuesday. Notable corporate earnings announcements due this week include: Walmart (WMT), Alibaba (BABA), Deere (DE), Analog Devices (ADI), Booking Holdings (BKNG), Newmont (NEM), Medtronic (MDT), Palo Alto Networks (PANW), Southern Company (SO), CRH (CRH), Cadence Design (CDNS), Quanta (PWR), Carvana (CVNA), Republic Services (RSG), DoorDash (DASH), Moody’s (MCO).
Full report on:
February 16, 2026 at 9:54 am #36424Japan PM Takaichi holds first meeting with BOJ chief Ueda since election win
- Takaichi did not make any request on monetary policy, Ueda says
Ueda declines comment on whether PM consented to rate-hike plan (from Reuters)
More from Japan
Q4 GDP rises annualized 0.2%, sharply below consensus forecast of 1.6%
February 16, 2026 at 2:06 am #36422February 16, 2026 at 2:06 am #36423February 16, 2026 at 12:49 am #36420Holiday closures this week
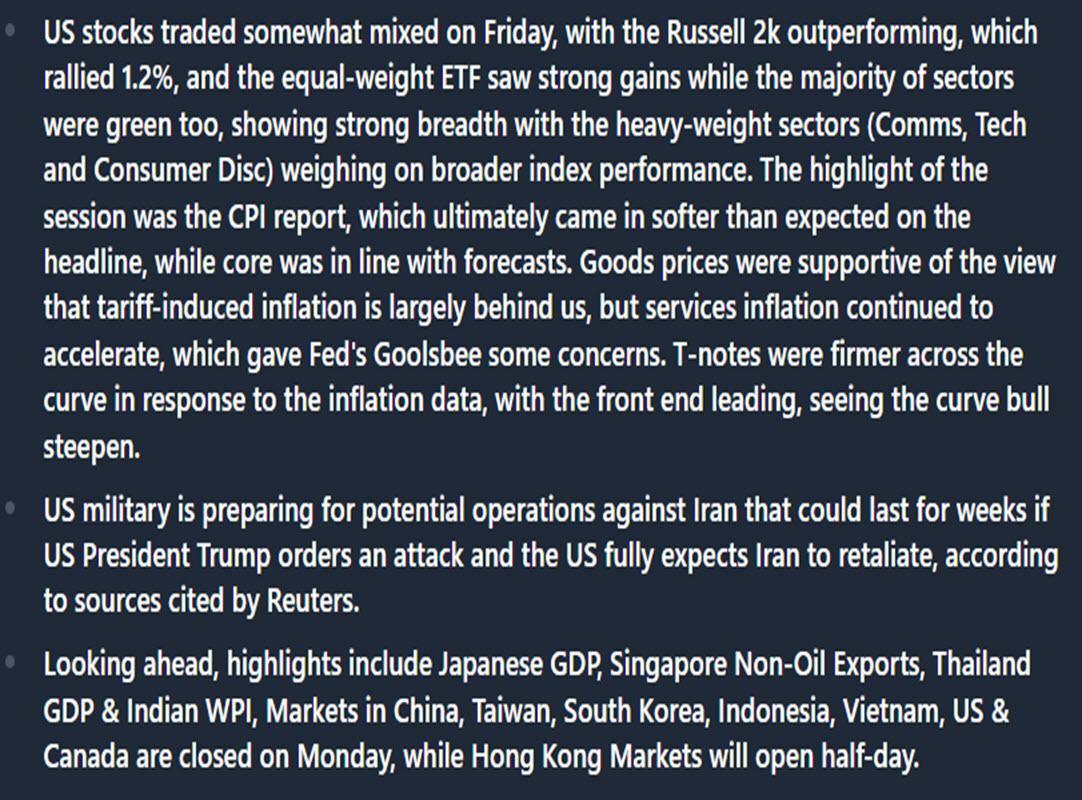
Monday – China, Taiwan, South Korea, Indonesia, Vietnam, US & Canada are closed on
Monday, Hong Kong Markets will open half-day.
Tuesday – China, Hong Kong, Taiwan, South Korea, Indonesia, Vietnam, Singapore & Philippines.
Wednesday – China, Hong Kong, Taiwan, South Korea, Vietnam & Singapore.
Thursday – China, Hong Kong, Taiwan & Vietnam.
Friday – China, Taiwan & Vietnam.
February 15, 2026 at 11:14 pm #36416Newsquawk Daily Asia=Pac Opening New
(Right click on image or any chart to open a full screen in a new tab)
February 15, 2026 at 2:04 pm #36415February 15, 2026 at 11:25 am #36412ETHUSD UPDATE
- Similar to BTCUSD (currently testing 70K+) ETHUSD showing tentative signs of life with higher lows (1741 and 1894) and trading back above 2000
- However, there is a long way to go (3040) before the downtrend would be fully negated.
- In the meantime, 2000 needs to become support followed by a break of 2148 to build upward momentum.
- Otherwise, dependent on 1894 needs to hold as support to keep a bid and thoughts away from the low
ETHUSD DAILY CHART
 February 14, 2026 at 7:31 pm #36409February 14, 2026 at 10:38 am #36404February 14, 2026 at 10:34 am #36403February 14, 2026 at 9:46 am #36402February 13, 2026 at 9:42 pm #36396February 13, 2026 at 9:18 pm #36395
Another US carrier going to the ME

(Right click on any image (or chart) to open a full screen in a new tab)
February 13, 2026 at 9:16 pm #36394Newsquawk US Market Wrap Part 2
(Right click on any image (or chart) to open a full screen in a new tab)
 February 13, 2026 at 9:15 pm #36393
Newsquawk US Market Wrap Part 1
(Right click on any image (or chart) to open a full screen in a new tab)
 February 13, 2026 at 8:37 pm #36392February 13, 2026 at 8:31 pm #36391February 13, 2026 at 5:01 pm #36390February 13, 2026 at 4:58 pm #36389
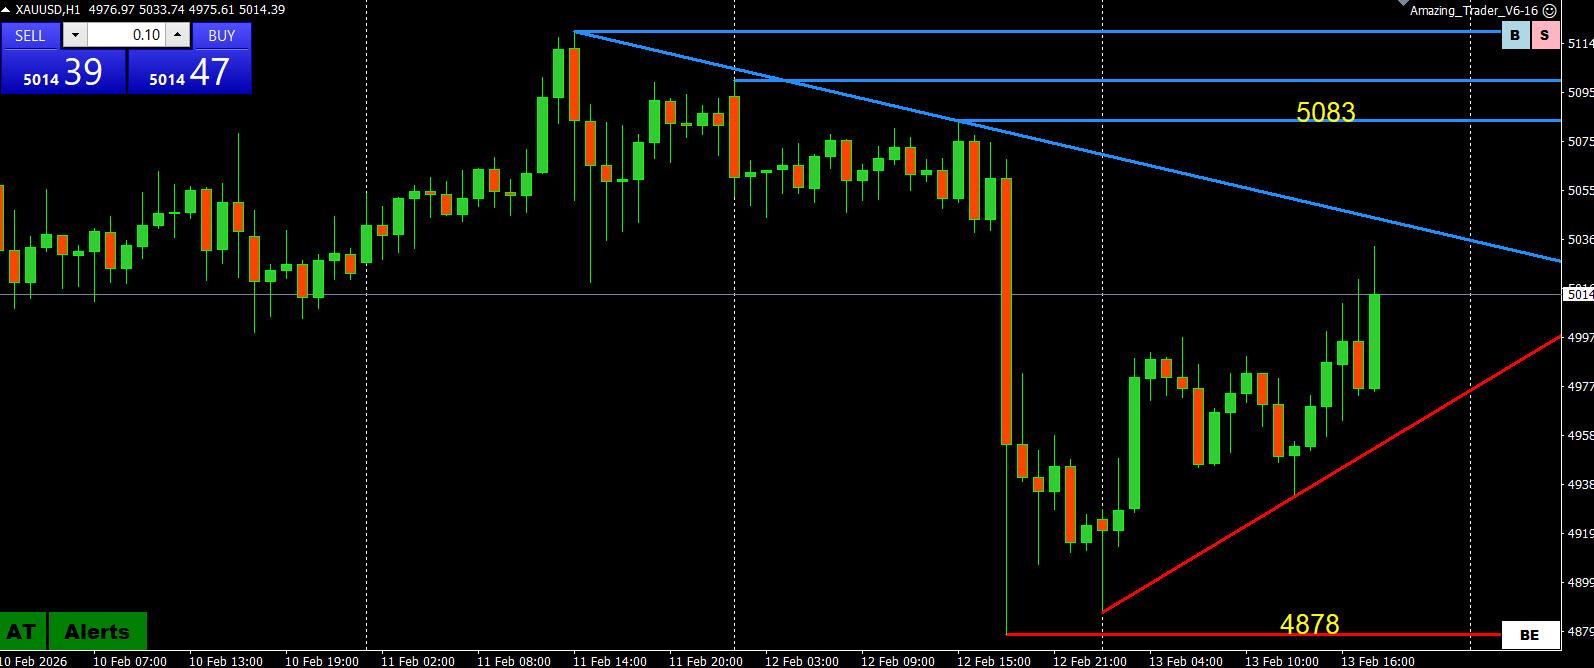
XAUUSD UPDATE
- Trying to regain a footing after yesterday’s sell-off but would need to get through the down trendline to put the bulls back in control.
- Recent history shows sharp retracements followed by new highs so will see if history repeats.
- Meanwhile, 5000 is clearly pivotal in setting the tone.
XAUUSD 1 HOUR CHART
 February 13, 2026 at 4:58 pm #36388
XAUUSD UPDATE
- Trying to regain a footing after yesterday’s sell-off but would need to get through the down trendline to put the bulls back in control.
- Recent history shows sharp retracements followed by new highs so will see if history repeats.
- Meanwhile, 5000 is clearly pivotal in setting the tone.
XAUUSD 1 HOUR CHART
 February 13, 2026 at 4:57 pm #36387
on the other hand …
Randall Denley: Carney’s EV plan benefits Carney, not Canadian carmakers
It’s difficult to imagine a plan more untethered from the economic realities of the real-world auto industry.
February 13, 2026 at 4:47 pm #36386why … why … why
Why Canada hopes China will boost is auto manufacturing industry
– Feb 13 2026, Robert FerrisNot Canada: Carney
and his lackey Joly and a few others in the current gov’tFebruary 13, 2026 at 4:38 pm #36385EURUSD follows Grman bond yields higher on this headline

(Right click on any image (or chart) to open a full screen in a new tab)
February 13, 2026 at 4:24 pm #36384February 13, 2026 at 4:20 pm #36383February 13, 2026 at 4:15 pm #36382Market Update
Defensive trading into the long US holiday weekend
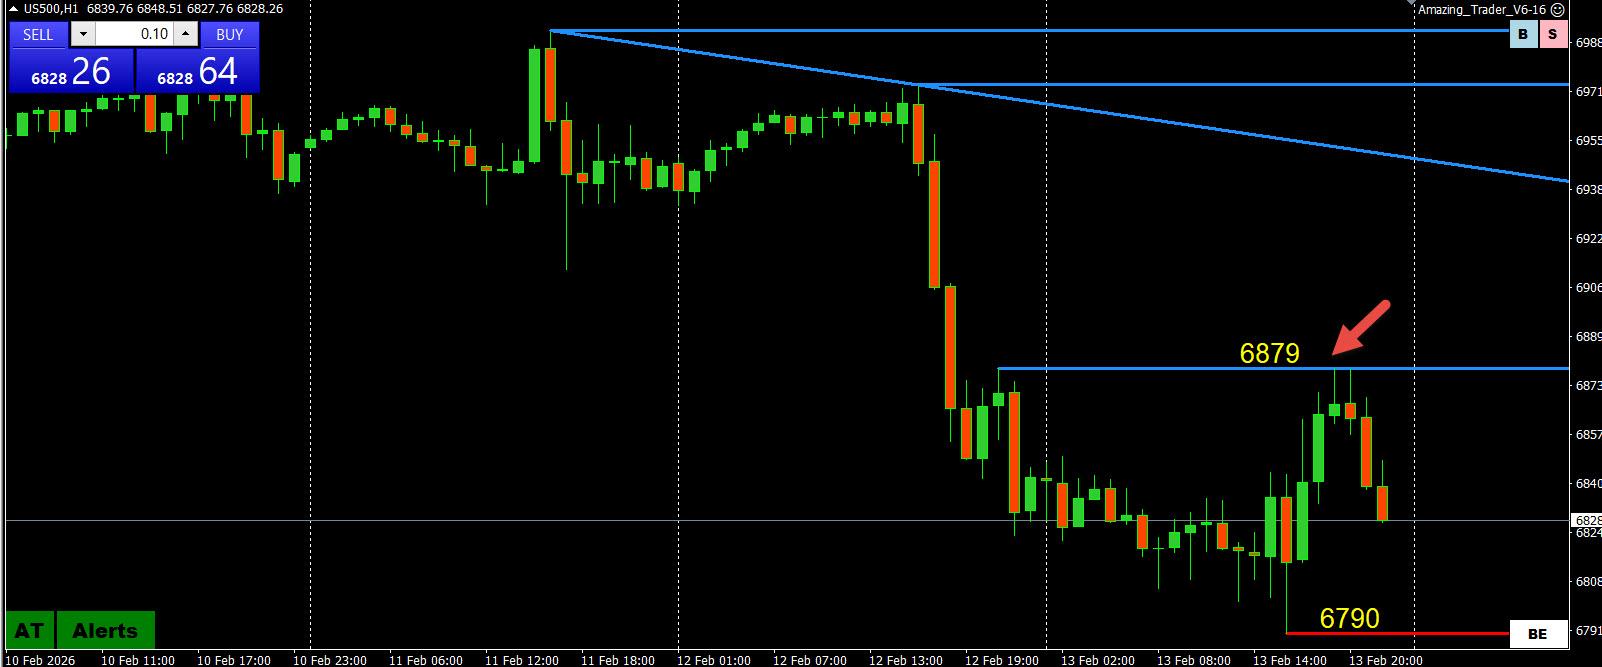
- US stocks trying to recover but so far US500 has failed on first attempt to hold above 6850 following its bounce from sub-6800 test
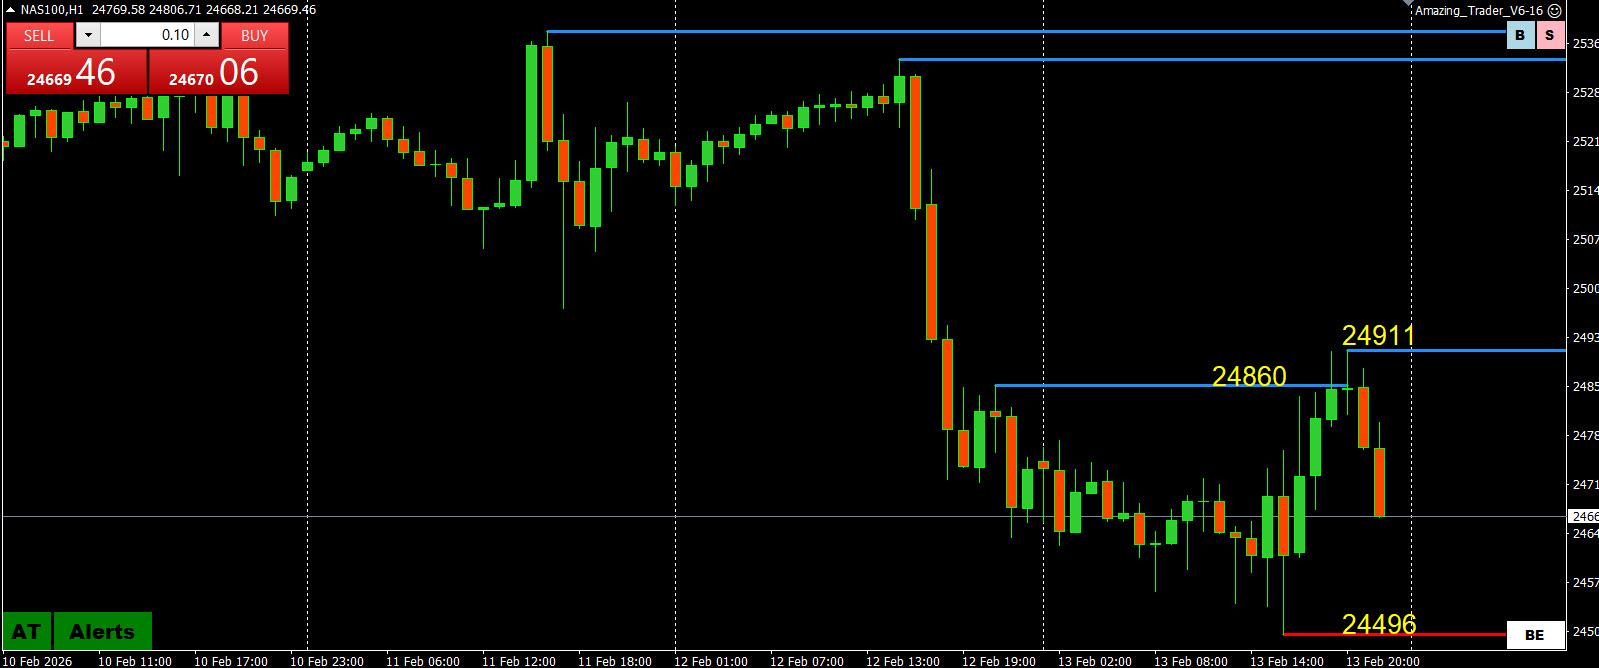
- NAS100 rally attempt paused shy of 24860, to keep it on the defensive but consolidating.
- XAUUSD rebound testing 5000+, which is currently acting like a pivot
- USD is trading cautiously irmer with the JPY lagging after leading overnight. EURUSD 1,.1850 remains pivotal
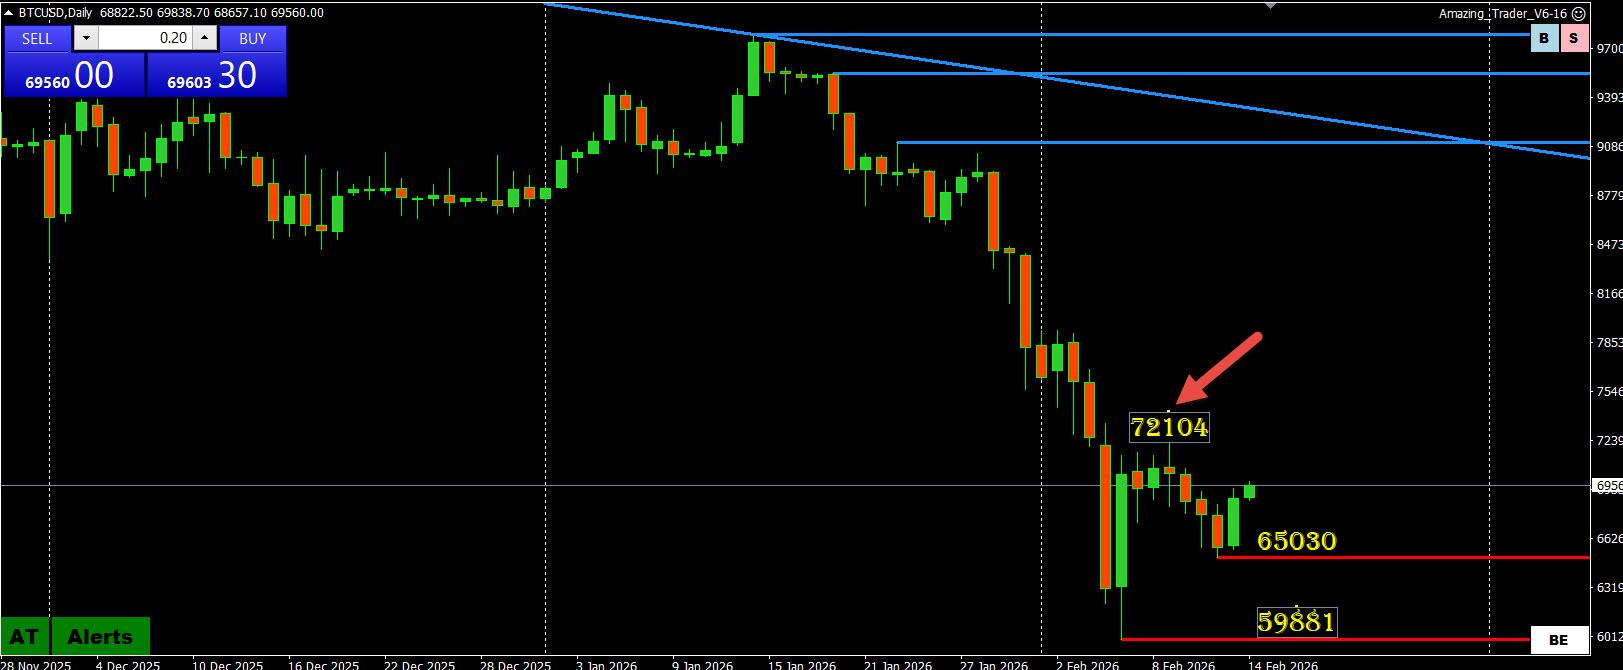
- BITCOIN is trying find some legs after yesterday’s bounce off 65000 yesterday but needs to gewt through 70-72K to break down momentum..
 February 13, 2026 at 4:01 pm #36381
 -
AuthorPosts




- You must be logged in to reply to this topic.
Search
© 2024 Global View