There seems to be an endless supply of technical indicators.
Beyond familiar tools such as moving averages, RSI, and MACD, traders can choose from countless variations, custom calculations, and systems combining several indicators.
The question is not whether there are enough tools available. It is which ones to use and whether adding more actually improves trading decisions.
Should traders keep things simple by using a few familiar indicators? Or should they search for an automated system that can find the optimal combination?
Artificial intelligence adds another dimension to that search. It offers the ability to examine large amounts of information and identify relationships that might escape a human observer.
But does greater analytical power bring traders closer to the elusive holy grail?
How Many Technical Indicators Do You Really Need?
An indicator should earn its place on the chart by answering a the question, how many indicators do you really need?
It might help assess direction, momentum, volatility, or trading activity.
The number of indicators matters less than the information each one contributes.
A chart filled with signals can appear sophisticated while making decisions more difficult. If several tools describe essentially the same feature of price, they may add clutter without adding much understanding.
Start With the Trading Decision
Before choosing an indicator, identify the decision it is supposed to support.
Are you trying to establish the side to trade? Identify a potential entry? Judge whether a move is unusually large? Define an appropriate risk level?
Different questions may require different tools.
An indicator that helps identify direction may offer little guidance about position size. A volatility indicator may help with risk planning without saying whether to buy or sell.
A useful approach gives each tool a clear role.
The Main Indicator Categories and Their Roles
An exhaustive list would turn this article into a technical directory. A shorter overview is more useful for understanding what the principal categories contribute.
Trend Indicators
Trend indicators help assess the direction or persistence of price movement.
Common examples include:
- Simple Moving Average (SMA): Smooths prices by calculating an average over a selected period.
- Exponential Moving Average (EMA): Gives greater weight to recent prices.
- MACD: Uses the relationship between moving averages to assess aspects of trend and momentum.
- Average Directional Index (ADX): Measures trend strength rather than direction.
These tools can help organize market behavior. However, they respond to existing data and can struggle when prices repeatedly reverse in a sideways market.
How to Use MACD to Spot Trading Trends Before They Fade
Momentum Indicators
Momentum indicators help assess aspects of the strength or speed of a move.
Two familiar examples are:
- Relative Strength Index (RSI).
- Stochastic Oscillator.
Traders often use them to identify overbought or oversold conditions.
The danger is assuming that an extreme reading means a reversal must follow. A strong market can remain overbought while continuing higher. A weak market can remain oversold while continuing lower.
Momentum readings need context.
Volatility Indicators
Volatility indicators describe the extent of price movement.
Common examples include:
- Average True Range (ATR).
- Bollinger Bands.
ATR can help put trading ranges into perspective and inform risk planning. Bollinger Bands show price relative to an average and a measure of dispersion.
Neither tool makes a large move automatically unsustainable. Volatility can expand as a new directional move develops.
Volume and Price-Level Tools
Volume tools include volume itself, On-Balance Volume, VWAP, and Volume Profile.
Their interpretation depends on the available data. For example, spot forex has no single consolidated volume record covering the entire global market.
Price-level tools include support and resistance, previous highs and lows, pivot points, and Fibonacci retracements.
These references can help traders identify areas where a reaction may occur and define what holding or breaking an area would mean for the trading plan.
Some of these are charting tools rather than indicators in the strict sense. Their practical value lies in the decisions they support.
Why More Signals Do Not Always Mean Better Information
Most technical indicators draw from a limited set of underlying inputs, particularly price and volume.
This creates substantial overlap.
A trader might use several moving averages, MACD, and multiple momentum oscillators. Each has a different calculation, but many signals may reflect the same recent price movement.
Five indicators agreeing does not necessarily represent five independent pieces of evidence.
Avoid Counting the Same Evidence Repeatedly
Suppose price rises sharply.
A moving average turns upward. MACD strengthens. RSI rises. Another momentum oscillator also improves.
The agreement may be useful, but much of it comes from the same event: price has risen.
Treating each signal as independent confirmation can create more confidence than the information warrants.
The aim should be to add different perspectives where they improve the decision.
Avoid Choosing the Signal You Want to Believe
Too many indicators can also make it easy to justify almost any position.
A trader who wants to buy may focus on the bullish signal. A trader who wants to sell may emphasize the bearish one.
The chart becomes a collection of possible excuses rather than a consistent decision process.
A smaller set of tools, used according to established rules, can make that behavior easier to recognize and control.
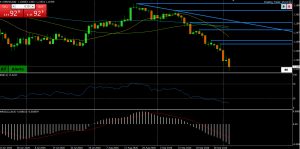
EURUSD DAILY CHART: Downtrend (Moving Averages, MACD, RSI)
What Simple Trading Indicators Can and Cannot Do
Simple trading indicators can help organize analysis and make decisions more repeatable.
Familiar reference points may also be useful because other participants watch them. Their reactions when a level holds or breaks can help clarify which side of the market has the advantage.
However, simplicity alone does not establish a profitable method.
A basic system can lose money. A complex system can have value. Both need to be assessed against their purpose and actual performance.
The objective is to use enough information to make a sound decision while understanding what each input contributes.
Can AI Find the Perfect Indicator Combination?
AI can test combinations, examine large datasets, and search for relationships at a scale that would be difficult to reproduce manually.
It is reasonable to ask whether it can discover a combination of technical inputs that consistently improves trading results.
The comparison with AI searching for effective drug combinations to treat an ailment or disease is tempting to explore to determine whether it will work the same way in trading. Perhaps the right combination of indicators can produce a better outcome than any individual tool.
However, markets present a particular challenge. Participants respond to changing conditions and to one another. A profitable relationship can weaken as behavior changes or more traders attempt to exploit it. Markets tend to move sharply when there is a surprise.
Finding a pattern is one task. Establishing that it remains useful is another.
Historical Success Can Be Misleading
If enough indicator combinations and settings are tested, some will produce impressive historical results.
The danger is overfitting: selecting a system that captures peculiarities of the historical sample rather than a relationship likely to persist.
A backtest may therefore look excellent while future performance disappoints.
Testing should include data that was not used to design or select the strategy. It should also reflect spreads, transaction costs, slippage, and realistic execution. It should also go beyond net results and include drawdowns.
Even then, testing reduces uncertainty; it does not remove it.
Automation Still Needs Risk Controls
An automated system can execute rules consistently. That can be valuable, particularly when human traders struggle with hesitation or emotional decisions.
However, consistent execution is only useful if the underlying rules and risk limits are appropriate.
A system needs to address position size, losses, changing volatility, execution problems, and conditions under which trading should stop.
Automation does not eliminate the need to define where a strategy can fail.
Why Market Surprises Challenge Trading Systems
Anyone who has survived the trading wars knows that markets do not always follow textbook expectations.
An apparently bullish report can produce a decline. Weak economic data can trigger a rally. A central-bank decision can generate an initial move that later reverses. A surprise result or news event can see a sharp reaction and reverse a market’s direction.
The reaction depends on expectations, positioning, liquidity, and interpretation.
A system built only around technical indicators may observe the price response without directly accounting for all the forces causing it.
More advanced models may incorporate news and other data. However, they still face uncertainty about surprise outcomes or news events and how participants will respond when events unfold as expected.
The Reaction May Matter More Than the Event
A trader can correctly interpret an announcement and still be wrong about the market’s direction.
If the news was already priced in, the reaction may be limited. If participants were positioned heavily for that outcome, the market may move the other way as positions are unwound.
This is why observing the response remains valuable.
Does the initial move continue? Does it stall? Does it reverse? Are widely watched levels holding or breaking?
Those questions connect analysis to actual market behavior.
Can a Logical System Trade a Seemingly Illogical Market?
It would be too broad to argue that automated systems cannot succeed because markets sometimes appear illogical.
A system does not need to understand every move or win every trade. It needs a useful advantage, disciplined execution, and controlled losses.
Human traders face the same requirement.
My skepticism is directed at the promise of a system that consistently outsmarts every type of market.
AI may improve specific tasks and strategies. Whether it can deliver anything resembling the holy grail remains an open question.
Keep the Focus on the Trade
For most traders, the practical starting point is clear, identify the side to trade with the odds in your favor.
Then find a suitable entry, establish where the trade is wrong, and assess whether the potential reward justifies the risk.
Indicators and automated systems should support those decisions.
If adding a tool makes the process harder to understand without improving results, its value deserves questioning. If a system produces impressive historical returns but cannot withstand realistic trading conditions, its complexity offers little comfort.
The search for better methods will continue, and AI will be part of it. Meanwhile, a manageable set of tools and a disciplined trading process remain a sensible foundation.
For anyone still searching for the perfect system, remember the old trading adage:
Markets can remain irrational longer than you can remain solvent.