

Forum Replies Created
-
AuthorPosts
-
Anonymous
USDJPY: Stuck in Limbo – Uptrend Consolidation or Downturn Signal?
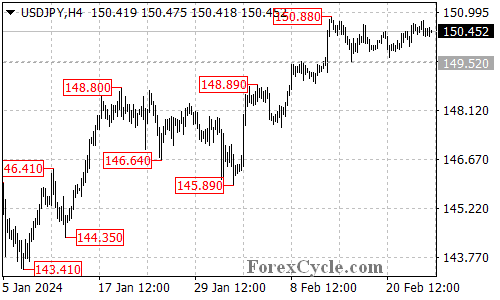
USDJPY has been stuck in neutral territory, oscillating within a trading range between 149.52 and 150.88. This sideways movement leaves the near-term direction unclear, prompting questions about whether it’s a pause within the uptrend or a sign of a potential reversal. Let’s delve into the key support and resistance levels to understand the possible scenarios.
Uptrend on Hold? Sideways Consolidation as a Signal
149.52 Support: The Bullish Anchor: As long as the price remains above this crucial support level, the uptrend initiated at 145.89 remains valid. This suggests the current sideways movement could be a healthy consolidation phase within the ongoing uptrend.
Breakout Potential: If the bulls manage to accumulate enough strength and push the price above the 150.88 resistance level, it could signal a breakout from the range and trigger a further rise towards the 151.90 resistance, potentially solidifying the uptrend.Downturn Signals: Watching the Support Crack
149.52 Breach: A Reversal Indicator: A breakdown below the 149.52 support level would be a significant development, potentially indicating a completion of the uptrend from 145.89. This could lead to a decline towards the next support zone around 148.80, marking a potential trend reversal.
Overall Sentiment:
The current technical picture for USDJPY presents conflicting signals. The sideways movement creates uncertainty, leaving the near-term direction unclear. While holding above 149.52 and breaking above 150.88 suggest potential bullish continuation, a breakdown below support could signal a trend reversal and further decline. Monitoring the price action around the mentioned support and resistance levels will be crucial in determining the pair’s next move.
Disclaimer: This analysis is for informational purposes only and should not be considered as investment advice. Please conduct your own research before making any trading decisions.
Feb 26 (Reuters) – A look at the day ahead in Asian markets.
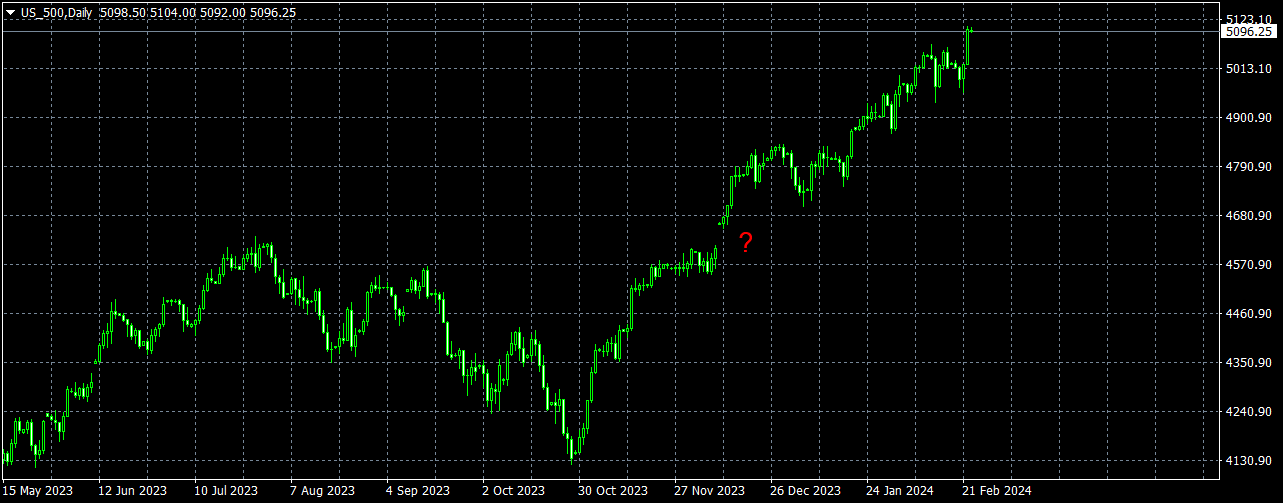
Stock markets in Asia start the week with clear momentum behind them, especially in Japan and China, but may be vulnerable to a spot of profit-taking as investors pause for breath after last week’s tech- and AI-fueled global buying frenzy.
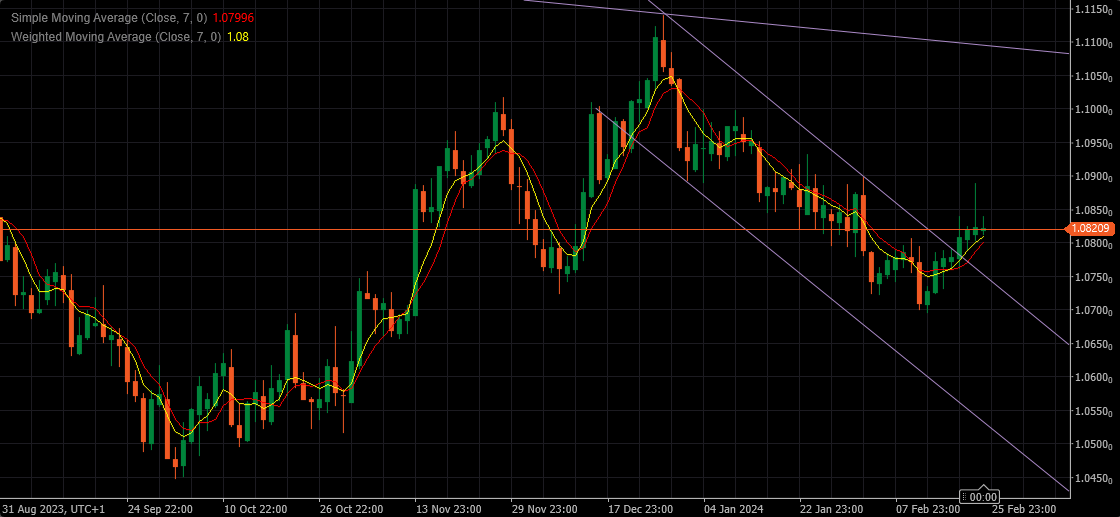
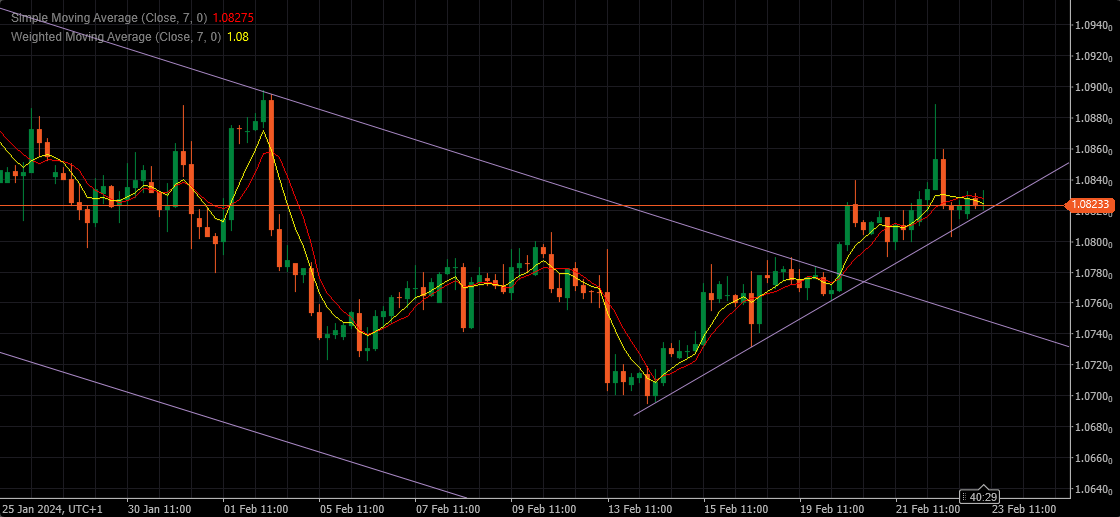
EURUSD – Outlook for tomorrow
Support at 1.08050 and 1.07800 – bellow would open a way for test of 1.07450
Resistance in 1.08800 / 1.09000 area
As much as a correction to down is needed, it still can first try Up tomorrow morning.
This is not a good place for Buying, and still no reason to Sell it.
We’ll go with smaller time frames , and follow as it develops.
Week Ahead: EURGBP
EURGBP Daily Chart
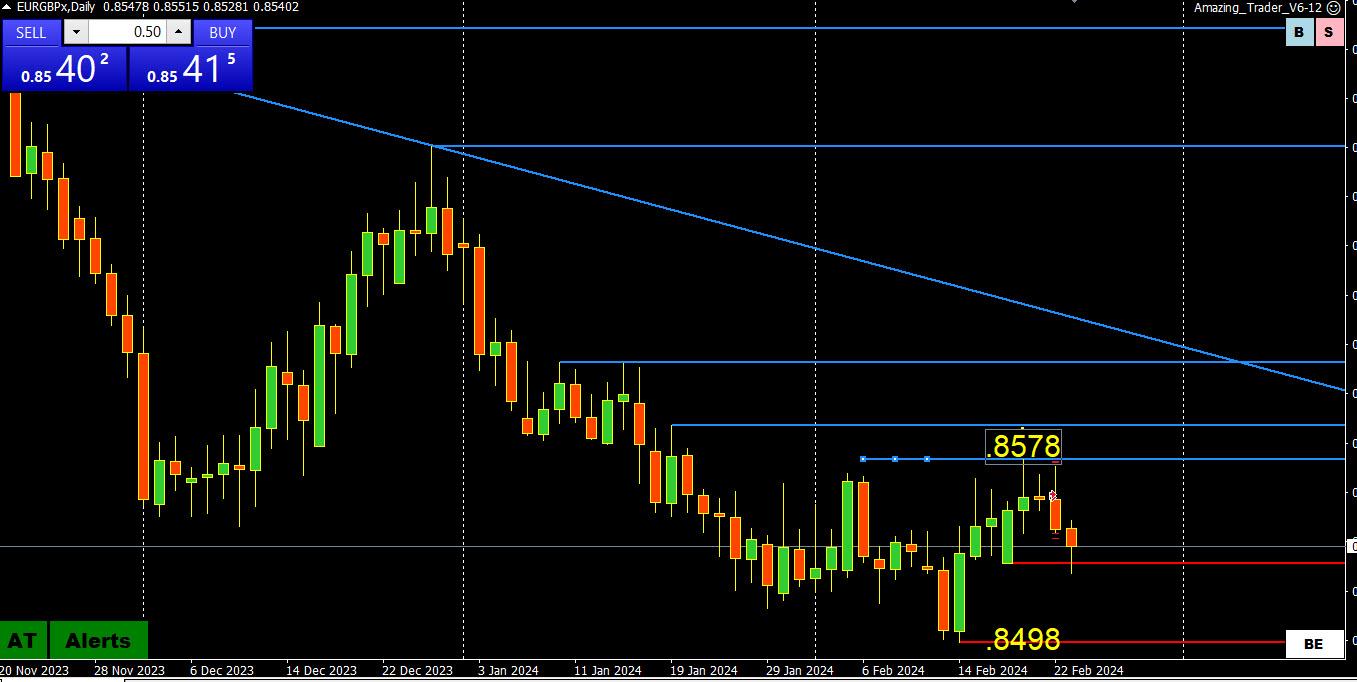
The consolidation range is clear at .8498-.8578
This suggests .8500 will remain pivotal as only a firm break would open the door to another leg down.
On the other hand, only a firm break of .8578 would suggest the low is in for now/
Why am I highlighting EURGBP?
1) If you trade EURUSD and/or GBPUSD, you need to keep an eye on EURGBP as flows involving this cross often have an impact on price moves in EURUSD and GBPUSD
2) Month end (Feb 29): I have observed increased activity in EURGBP at month end, which in turn often sees erratic flows not only in the cross but in EURUSD and GBPUSD. So keep a close eye at month end as it can offer trading opportunities in respective pairs as well as in EURGBP. In this regard, watch price action throughout the day but especially leading up to and around the 4 PM London fixing.
Newsquawk.com Week Ahead 26th February – 1st March
Mon: US New Home Sales (Jan), Dallas Fed
(Feb), Japanese CPI (Jan), UK Nationwide (Feb)Tue: US Democratic Primary – Michigan; German GfK (Mar), US Durable Goods (Jan), Consumer Confidence (Feb), Richmond Fed (Feb)
Wed: RBNZ Policy Announcement, Australian CPI (Jan), Swedish PPI (Jan), EZ Consumer Confidence Final (Feb), US GDP 2nd/PCE Prices Prelim. (Q4), Japanese Retail Sales (Jan)
Thu: Australian Retail Sales (Jan), US PCE (Jan), Canadian GDP (Q4)
Fri: Chinese NBS PMIs (Feb), EZ CPI (Feb), US ISM Manufacturing PMI (Feb).
USDJPY Weekly Outlook
Supports at 149.800 and 148.650
Resistance 152.000
There is not much to say about this pair, except that Pattern wise it is destined to try 152.000 area.
Problem comes from the fact that we have already double top in place, and if rejected for the third time, it will be not only technically visible, but would mean that BOJ decided to put Money where their Mouth is.
We can always see sharp drops in JPY , followed by even sharper ascent . But any possible drop below 145.000 and consequently 143.300 would put the whole Up trend in question.
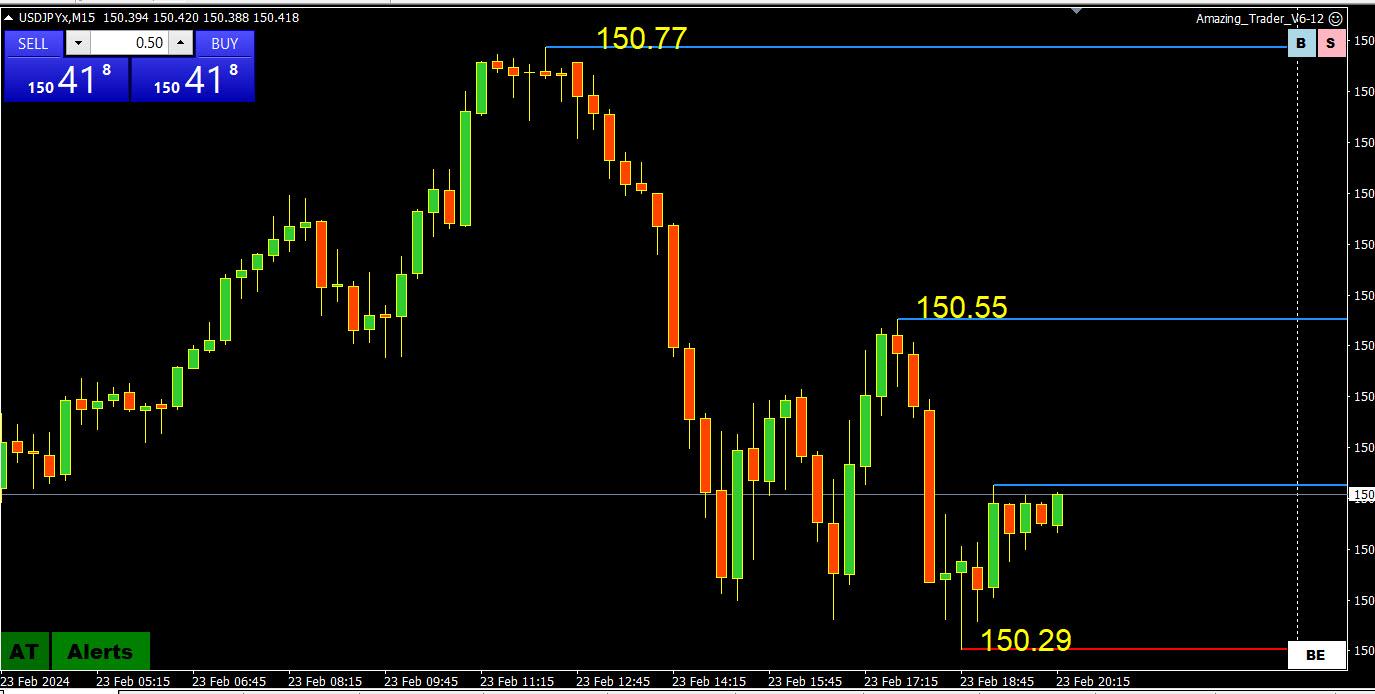
USDJPY 15 minute chart
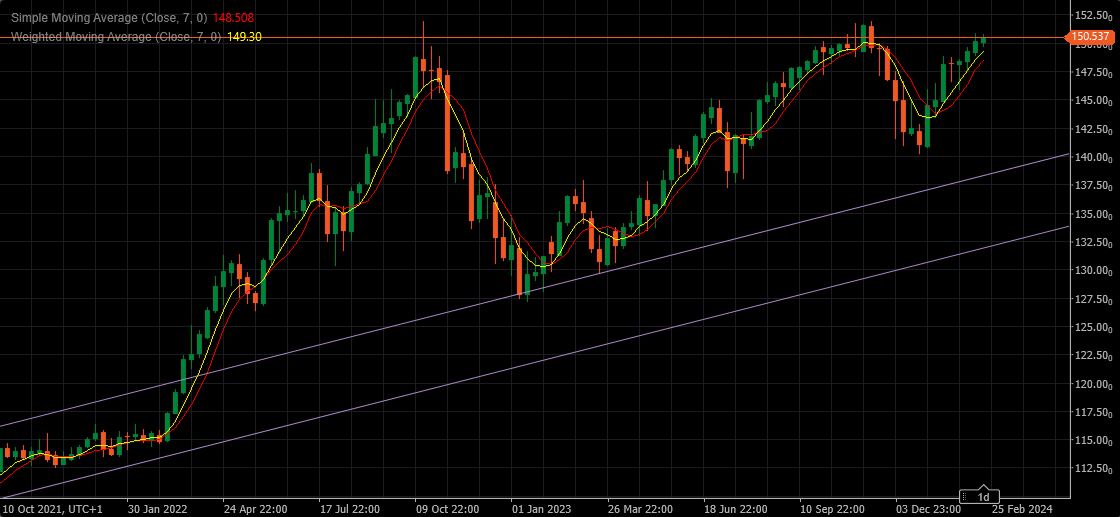
Similar to others, USDJOY is ending the week with a whimper but getting a reprieve from the dip in US bond yields
Wise rRngw `149.53-150.89
I wouldn’t be surprised to learn the BoJ has been covertly intervening as it has been rumored for years to do so via surrogates.
Whatever the case, 150 remains the ultimate bias-setting level
bobby 1:41 / tol game these frothy puppies is replete with risk
–
to mitigate risk to your wallet u d have to be a “whale” with tons of margin (haha) or collusionability with your say 3 selections out of the “7 magnificant”s or … a very intimate insight into money in or out flowsotherwise it is good luck peasant
NVIDIA – Whole planet talks about it….it is Viral…it is Hysterical
Even my wife asking about it ( and she couldn’t give a **** about it ) …my younger daughter asks about it ( at least she is just worried if the price for her next generation graphic card will go up )
Till yesterday it was Gold – half a planet bought it on the top….
Now the other half will buy NVIDIA stocks …on the top
Me….I don’t give a flying ****….EUR goes up, EUR goes down…that makes my day…
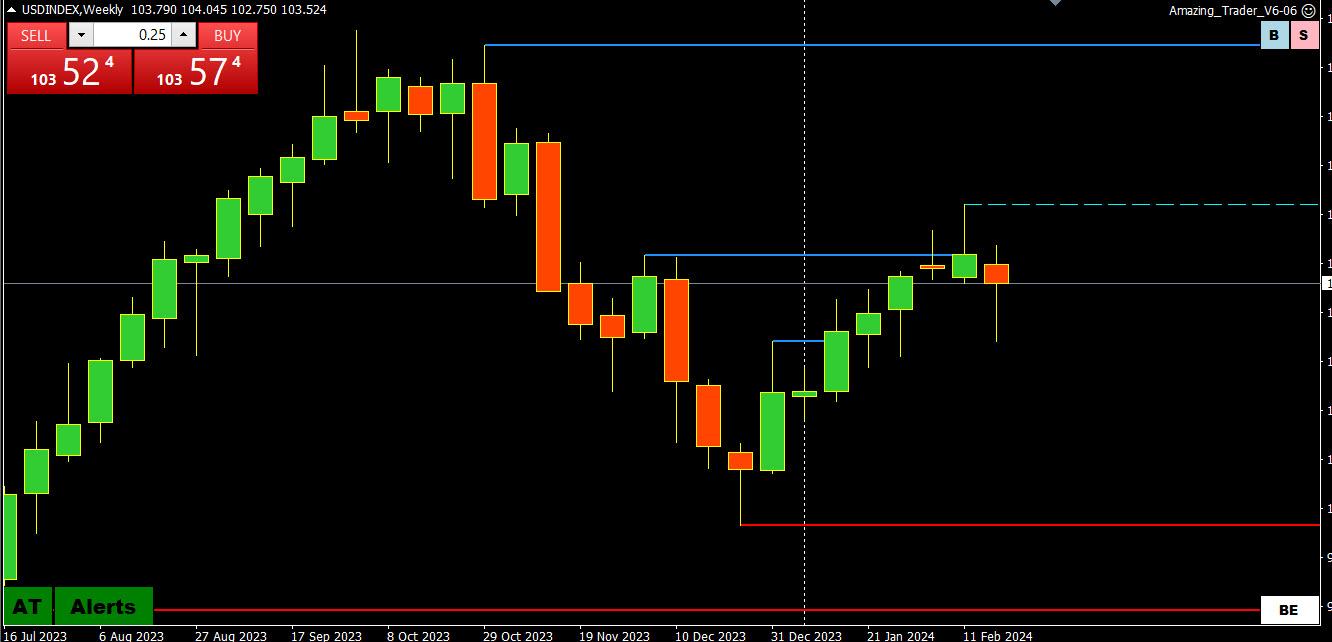
US Dollar Index Weekly Chart
Barring a burst higher, the US Dollar Index looks set for the first down week for the year (and in 8 weeks) although trading well off yesterday’s low.
By itself, this does not mean the dollar is about to reverse but does suggest the dollar has lost some steam.
in any case, those who follow me know I am always on the lookout for patterns and here is one that appears will be broken.
hear ye hear ye peasant
—
Bloomberg.com
Fed’s Harker Cautions Against Cutting Interest Rates Too Soon
Federal Reserve Bank of Philadelphia President Patrick Harker said that it will likely be appropriate to cut interest rates this year,…Federal Reserve Bank of Philadelphia
Economic Outlook: We Are in the Final Mile of the Marathon
Good afternoon! It is a pleasure to be back with you once again, and I thank today’s organizers and sponsors for making it all possible.MarketWatch
Fed’s Harker: Don’t look for any interest-rate cuts ‘right now and right away’
The Federal Reserve is getting close to cutting interest rates but a move in the near-term is unlikely, said Philadelphia Fed President…AUDUSD Breaks Free: Uptrend Resumption or False Dawn?
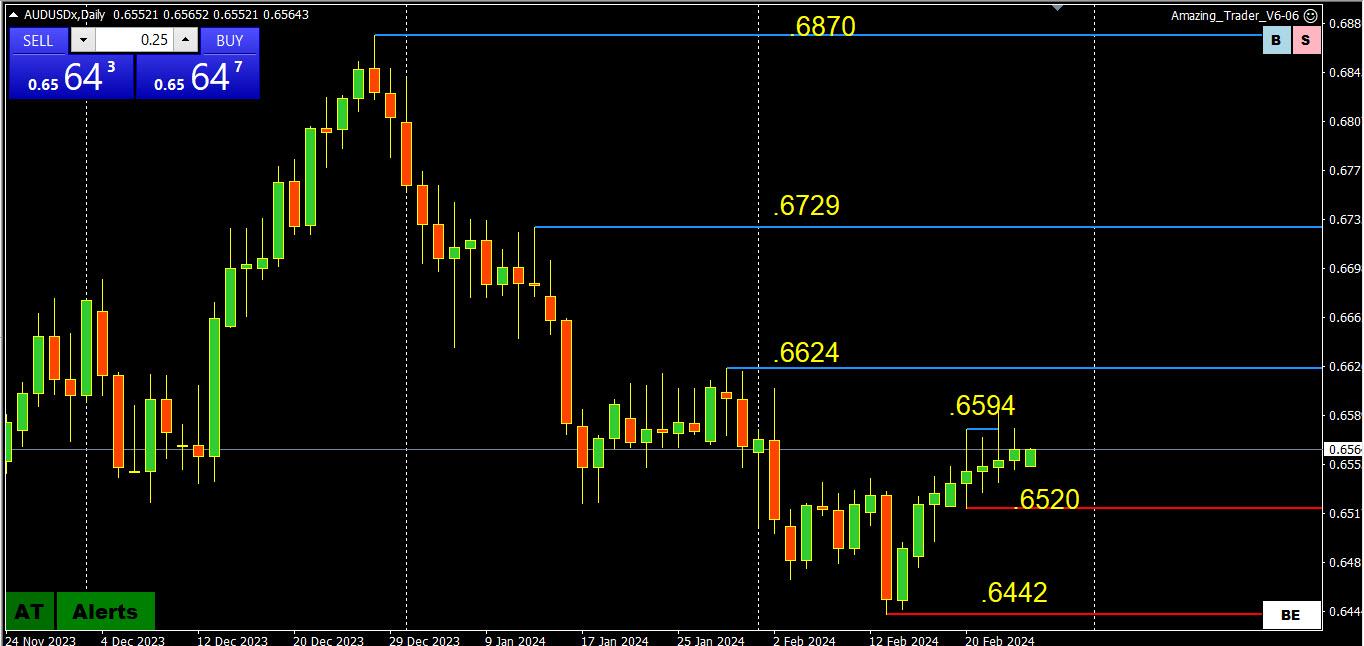
AUDUSD has clawed its way back from recent lows, breaking above the confines of the falling price channel on the 4-hour chart. This bullish breakout raises questions: Has the downtrend truly ended, or is this just a temporary reprieve?
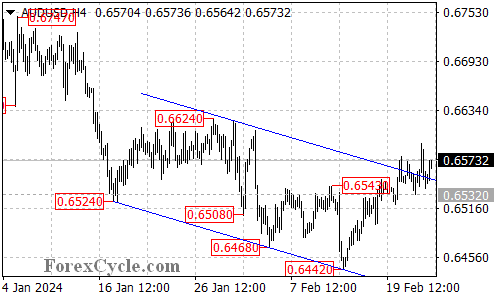
Uptrend Resumed: Channel Breakout as Confirmation?
Channel Breach: The break above the falling channel, established from the 0.6870 high, signifies a potential shift in momentum. This suggests a possible end to the downtrend and the start of a new uptrend from the recent low of 0.6442.
Potential for Continued Rally:
Resistance Levels: If the uptrend continues, the next target for AUDUSD could be the 0.6624 resistance level. Surpassing this hurdle would open the door for further gains towards 0.6700, solidifying the bullish momentum.
Support Levels to Watch for Pullbacks:
Initial Support: The initial support to watch is at 0.6532. A breakdown below this level could indicate a loss of momentum and a potential pullback towards the 0.6500 area.
Key Support: A further breach below 0.6500 could trigger a decline towards the previous low of 0.6442, potentially signaling a resumption of the downtrend.Overall Sentiment:
The technical picture offers a mixed outlook for AUDUSD. The breakout from the channel suggests a potential trend reversal, but confirmation will come from holding above the 0.6532 support and pushing towards the 0.6624 resistance. Monitoring the price action around these key levels will be crucial in determining the pair’s next move.
Disclaimer: This analysis is for informational purposes only and should not be considered as investment advice. Please conduct your own research before making any trading decisions.
Monedge tah would be FED’s no. 2
–
US Fed official warns of inflationary risk of over-consumption
Washington (AFP) – A senior Federal Reserve official said Thursday that the US central bank will likely start cutting interest rates “at some point this year,” but warned against the potentially inflationary effect of over-consumption.Gold
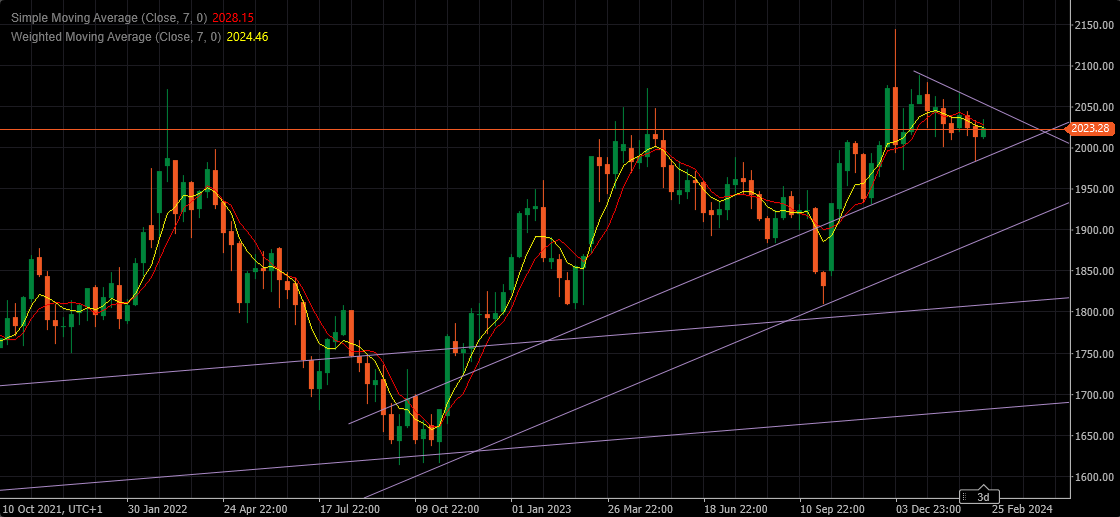
Resistance at 2050.00 and 2070.00
Supports at 1990.00 and 1900.00
There is a chance that 1990.00 might hold for another attempt for Highs, but overall pattern suggests that Gold is destined to go in a correction phase.
It is more likely that we’ll first see 1900.00 then new high.
For those that trade CFD’s this might be an opportunity to go Short.

USDJPY 4-Hour Chart: Key resistance looms
Looking at this chart USDJPY has been in a 149.53-150.89 range for nearly 2 weeks
With rising red lines, momentum is swinging upwards but faces the key resistance level (recent high) at 150.89
A move through 150.89 would leave little until the major 151.90 level
Expect support on dips as long as 150+ trades
Beware as always of verbal intervention with the major level looming above..
Of note – another Fed official stated today that he feels it is too early to cut rates. Also – If I caught this correctly, A company named Abbvie, a pharmaceutical company, just received $80 billion in M&A financing on offer, and was initially only looking for $14 billion. That is what is called a grand slam and speaks to the fact that money is continuing to move and investors are not in as much fear of risk as some might think at present in my view. Something to consider with relation to currencies that tend to ride risk and the climate overall in my view
-
AuthorPosts

Search
© 2024 Global View