

Forum Replies Created
-
AuthorPosts
-
USDCAD 4 Hour Chart
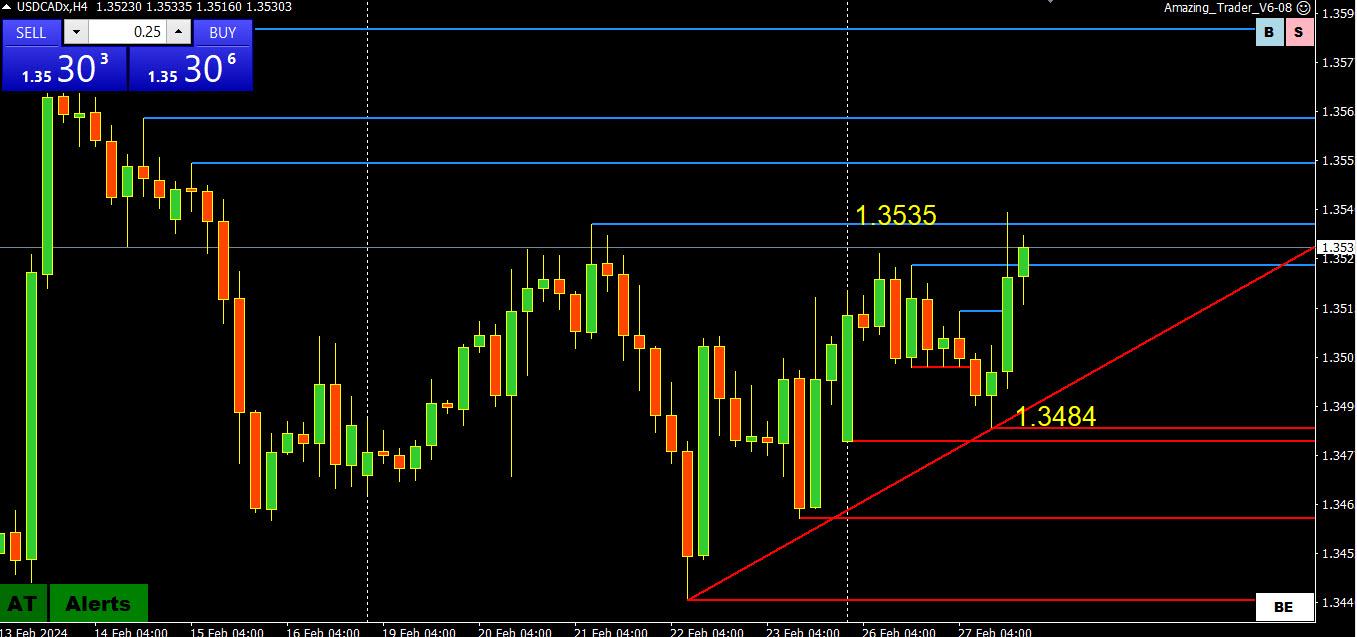
Red lines dominating with a brief blip above last week’s 1.3535 high
The KISS approach is to keep an eye on 1.35, which has traded 6 days in a row to see if this pattern is broken .
If broken and 1.3535 gets taken out, resistance levels (blue lines) are at 1.3552-1.3563-1.3586
If not, Trendline + 1.3484 are key supports.
FX being the dead horse that it is these days…. Not to go into the weeds on stocks but since you brought it up, I really like the long term prospect of gene editing companies. I think they could be the next AI wave. There are a few but 2 I really like LONG TERM are BEAM and CRSP. I am not a stock picker but think these both have something like 10X potential….
BEAM announced earnings today. Thus the big move. Do your own due diligence tho FOR SURE….
eye on yellen
–
AP News
Yellen urging world leaders to ‘unlock’ frozen Russian Central Bank assets and send them to UkraineBloomberg.com
Yellen Sees Moral Case to Use Russian Assets to Aid UkraineBloomberg
Yellen Calls for Way to Use Frozen Russian Assets to Aid UkraineFinancial Post
Yellen Cites Monetary Tightening as Risk in Global OutlookReuters
Yellen says global economy remains resilient, lauds US as growth driverBloomberg
Yellen Cites Monetary Tightening as Risk in Global OutlookHEADS UP
US durable goods are to be reported today
The headline is forecast to fall sharply due to Boeing’s issues
So watch the ex-transport number instead as that is forecast to be up in case the market overreacts to the headlkine drop
See our Economic Calendar
…”Imagine if one of the major currencies had moves like this?”…
–
degenerate traders’ heart rate and bloodpressure needles would be past the red zone in anticipation of “authorities” potential intervention against “rapid” price changes. (i.e. animal sprits gone wild)why would “authorities” take a skewed view of such price moves in one of the majors but not in btc
one might ask …BTC Daily Chart

Bitcoin continues to make its relentless move higher, leaving the record 68915 level as the only one left on the upside.
To be clear, I do not trade cryptos but it is hard to ignore its meteoric rise this year, up over 12% in 2 days and around +35% this year. Imagine if one of the major currencies had moves like this?
So, I will just post the chart and follow up with a monthly chart.
USDJPY 1-Hour Chart

Blue lines dominating, indicating some shift in risk to the downside or more of a two-sided market after another failure to take out 150.89
However, price action remains contained while within 149.53 and 150.89 where 150 should continue to set the bias
Supports on either side of 150: 149.93-150.01-150.12
150.54 needs to hold on top to keep the focus on 150 and away from 150.84-89
Why did USDJPY fall today?
Technicians will cite another failed run at 150.89 and market positioning that is heavily short JPY, both vs. the USD and on its crosses
Those who say news matters will cite the release of a smaller-than-expected fall in annual Japanese inflation in a market that is hypersensitive to any data that might prompt the BoJ to raise interest rates.,
AUDUSD Analysis: Sideways Move Continues, Resistance and Support Levels
The AUDUSD pair has been moving sideways within a trading range between 0.6521 and 0.6594.

As long as the 0.6521 support level holds, the pullback from 0.6594 could be seen as corrective consolidation for the uptrend from 0.6442. Another rise is still possible after the consolidation.
The initial resistance level is located at 0.6555. A breakthrough of this level could trigger another rise to test the 0.6594 resistance level. A breakthrough of this level would aim for the 0.6624 resistance level.
On the downside, a breakdown below the 0.6521 support level would indicate that the upside move has already completed at 0.6594. In this case, another fall towards the 0.6442 previous low could be seen.
NZDUSD: This is an earlier recap
NZD witnesses a quick decline as we approach this week’s central bank decision & press conference.📉
NZD falls 0.50% within the first three hours of trading and 0.65% against GBP. Investors voice concern over the struggling New Zealand economy while inflation remains higher than other regions Economists advise RBNZ to opt for a “harsh” landing scenario to bring inflation down to its 2% target.
28 Feb 2024 Wed 2:00pm. February Monetary Policy Statement and Official Cash Rate (OCR) Details.
See our Economic Calendar
NZDUSD 1-hour chart

Blue lines dominate, indicating risk on the downside.
Key support is clear at .6156-61, which needs to hold to prevent a further push to the downside. Should the support zone give way then .6150 (psychological) and .6128 are next.
On the upside, .6200 is the key resistance, minor at .6185 ahead of it.
Underperformers
NZDUSD and AUDUSD were the underperformers today,
-
AuthorPosts


Search
© 2024 Global View