
- This topic has 224 replies, 24 voices, and was last updated 1 year, 11 months ago by Belgrade Bobby.
-
AuthorPosts
-
July 19, 2024 at 4:22 pm #9379July 19, 2024 at 3:49 pm #9378
When it comes to the bottom line of every trade, Jay and me have identical stance : Go with the Flow – Always keep in mind the Overall Direction , and never try to pick up tops and bottoms.
In reality, even if right ( in picking tops and/or bottoms) , market can be so erratic on these exact levels, that they will pick up your stop easily , unless you go with way too big stop…
You should all watch closely both of us , as we complement each other.
Also, you’ll learn that some expressions that we both use for certain occurrences are sometimes totally different and that we see them very different.
But at the end we do come to the same conclusions.
Like Patterns – Formations : you all probably came across different examples and explanations ( like Head and Shoulder and similar) , but we both have highly developed systems with very much different “patterns” as we see them , and they are all way beyond widely known stuff you might find around.
For me, for example all the levels that you’ll see me posting are not possible entry levels – they are there for me just to get an idea of the size of the playing field, but the real Trigger is a combination of several factors…we’ll learn that as well.
For Jay , levels that he gets can be Triggers for the trade.
So almost opposite, but at the end of the day we just might take the very same trade, with maybe couple of pips of difference….
July 19, 2024 at 3:32 pm #9376I would like to add is that we all learn by our members posting their trading ideas, charts, etc or asking questions.
In this way we can all benefit and we can make sure we are on the same page.
Remember, this ia a private setting and any question, no matterhow simple or complex, is worth asking.
If yoiu want to contribute in real time, yiou can also post on the Forex Forum.
July 19, 2024 at 1:03 pm #9370July 19, 2024 at 9:57 am #9355July 19, 2024 at 9:49 am #9352Salazar – It is technically correct.
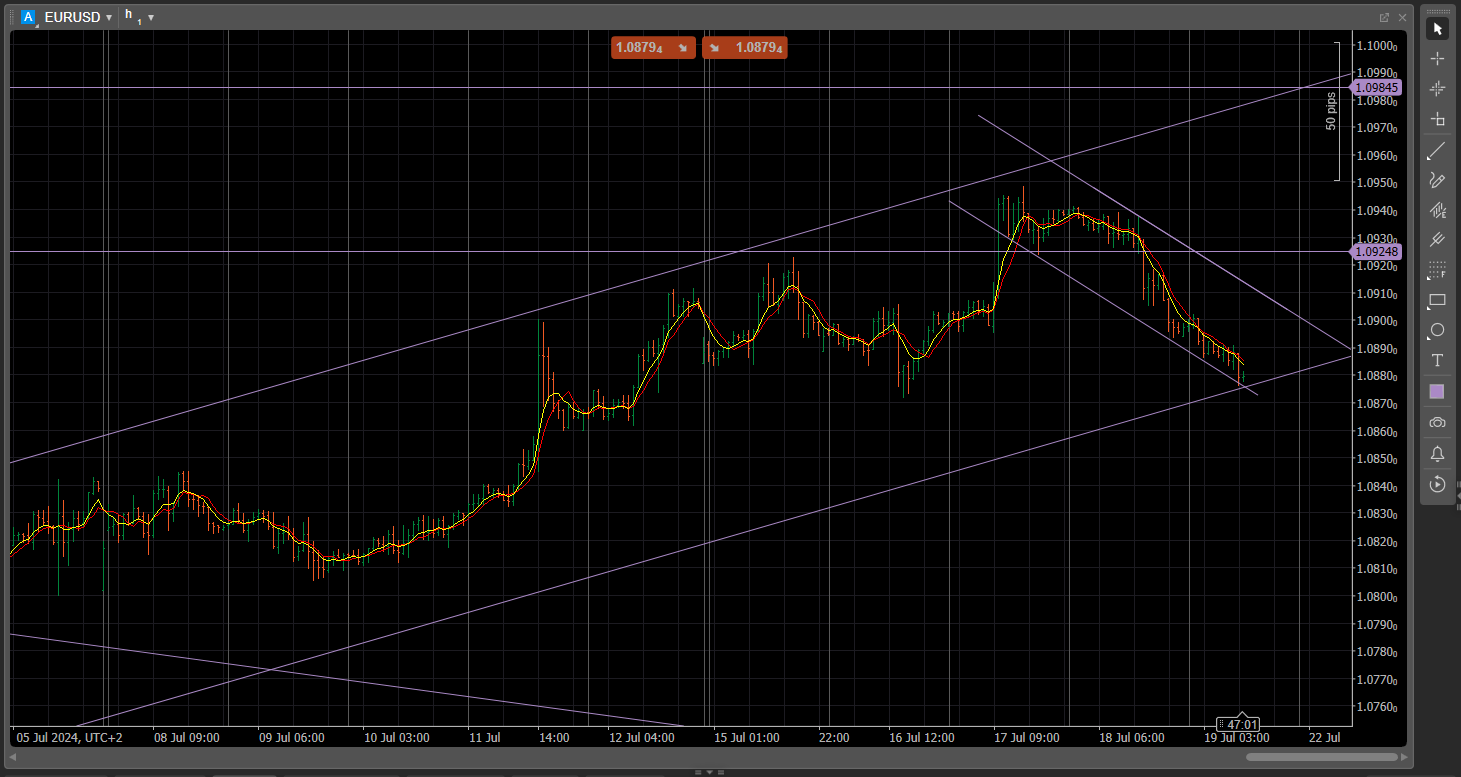
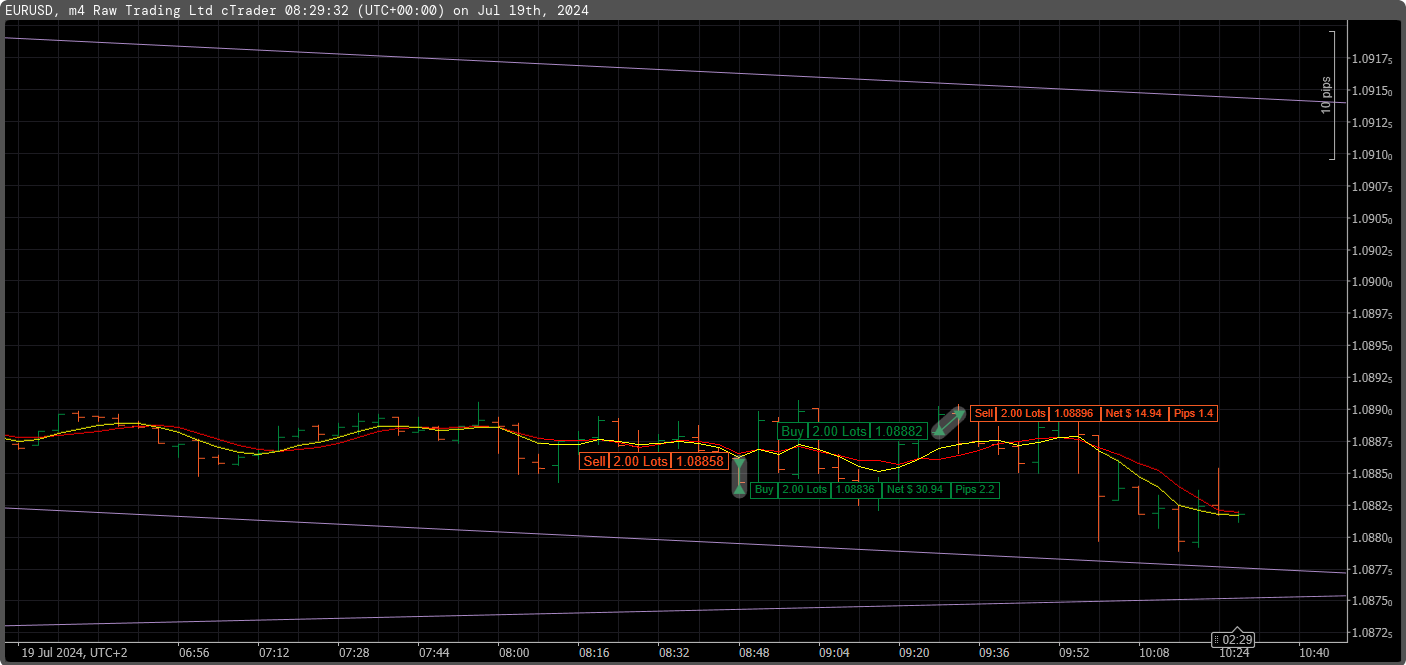
But, as you know how we trade – strictly Directional – that would be like stepping in front of the speeding train.
There are two possible scenarios and both trades can be wrong in reality :
– Buy with a small stop
– Sell on the break of Support line
Problem comes from the fact that market tends to slide a bit when working on bigger time frames.
You need two consecutive Closings to be sure – and your stop is long gone, even if you are fully right.
Now there is another problem – again, technically we should see at least a decent correction to the upside ( so Buying for a controlled profit target is sound strategy ) , but if this is a start of a bigger trend developing , we might see another Leg down , without more than some sideways correction.
Now the right approach would be to wait and see if we break bellow trend line, attempt to come back up and if failed go Short following the directional signal ( so one of the Patterns)
July 19, 2024 at 9:39 am #9351July 19, 2024 at 8:45 am #9348July 19, 2024 at 8:34 am #9347July 18, 2024 at 9:15 pm #9344July 18, 2024 at 9:00 pm #9342July 18, 2024 at 8:56 pm #9341Well Robinson this is now Way better !
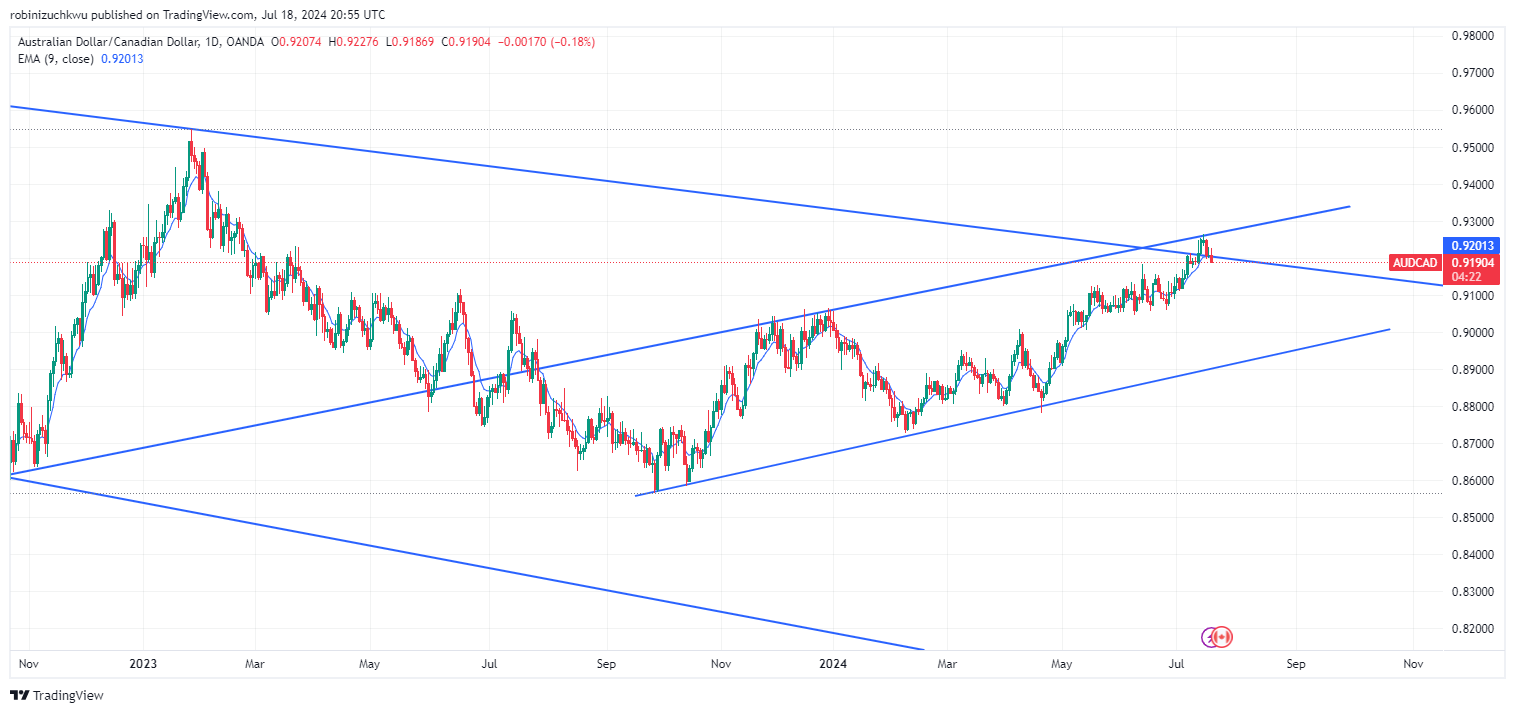
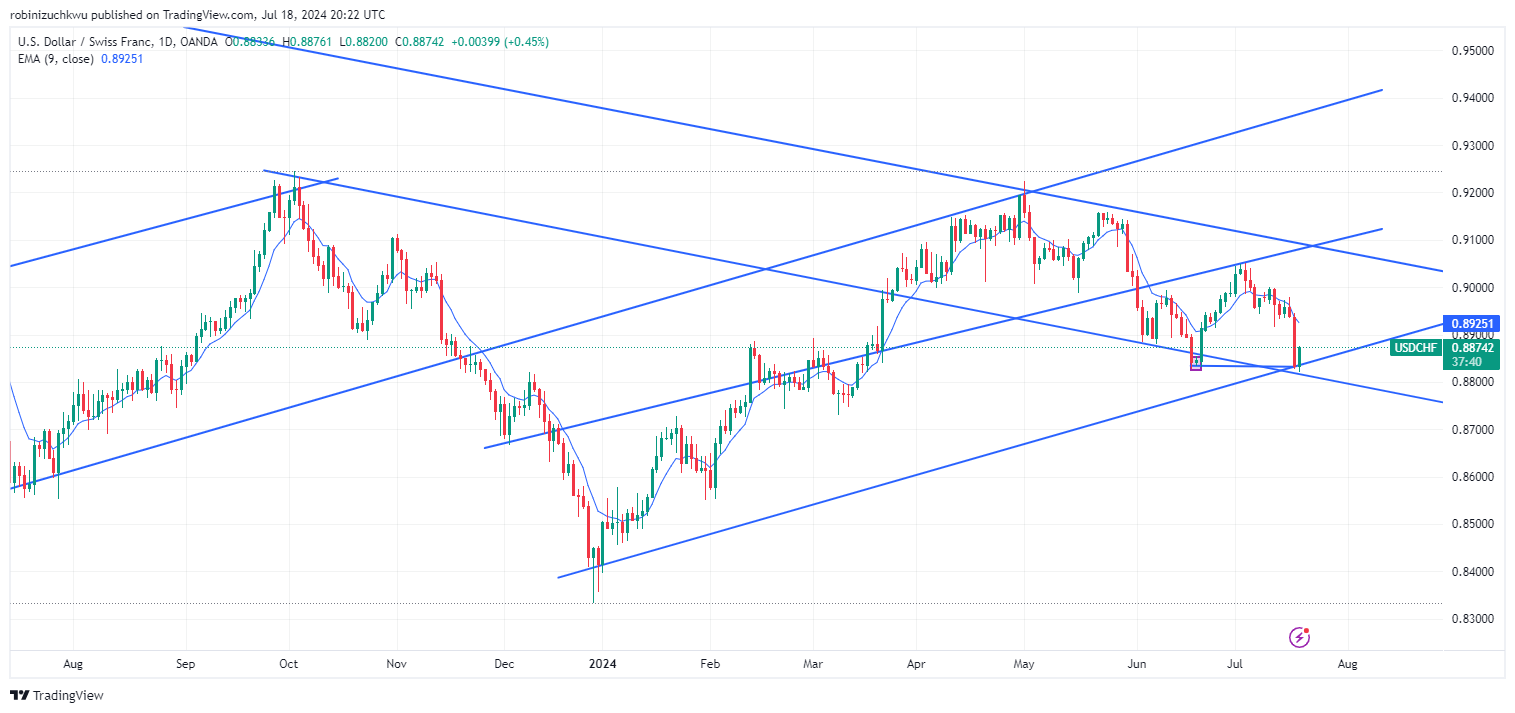
Two things :
– If they break below that trend line that was a resistance before – now support , they will negate the whole Up move
– Add another parallel trend line on that absolute low that we see on this chart
– To me this looks Bearish right now
But opinions are like underwear – you change them every now and then J
Now professional advice : If you Buy it, be sure that your Stop loss is locked in – it is not a problem when you are wrong, but it is a disaster if you are wrong and don’t have a Stop.
July 18, 2024 at 8:28 pm #9339July 17, 2024 at 10:05 am #9242Salazar, we use them for as long as they are not broken.
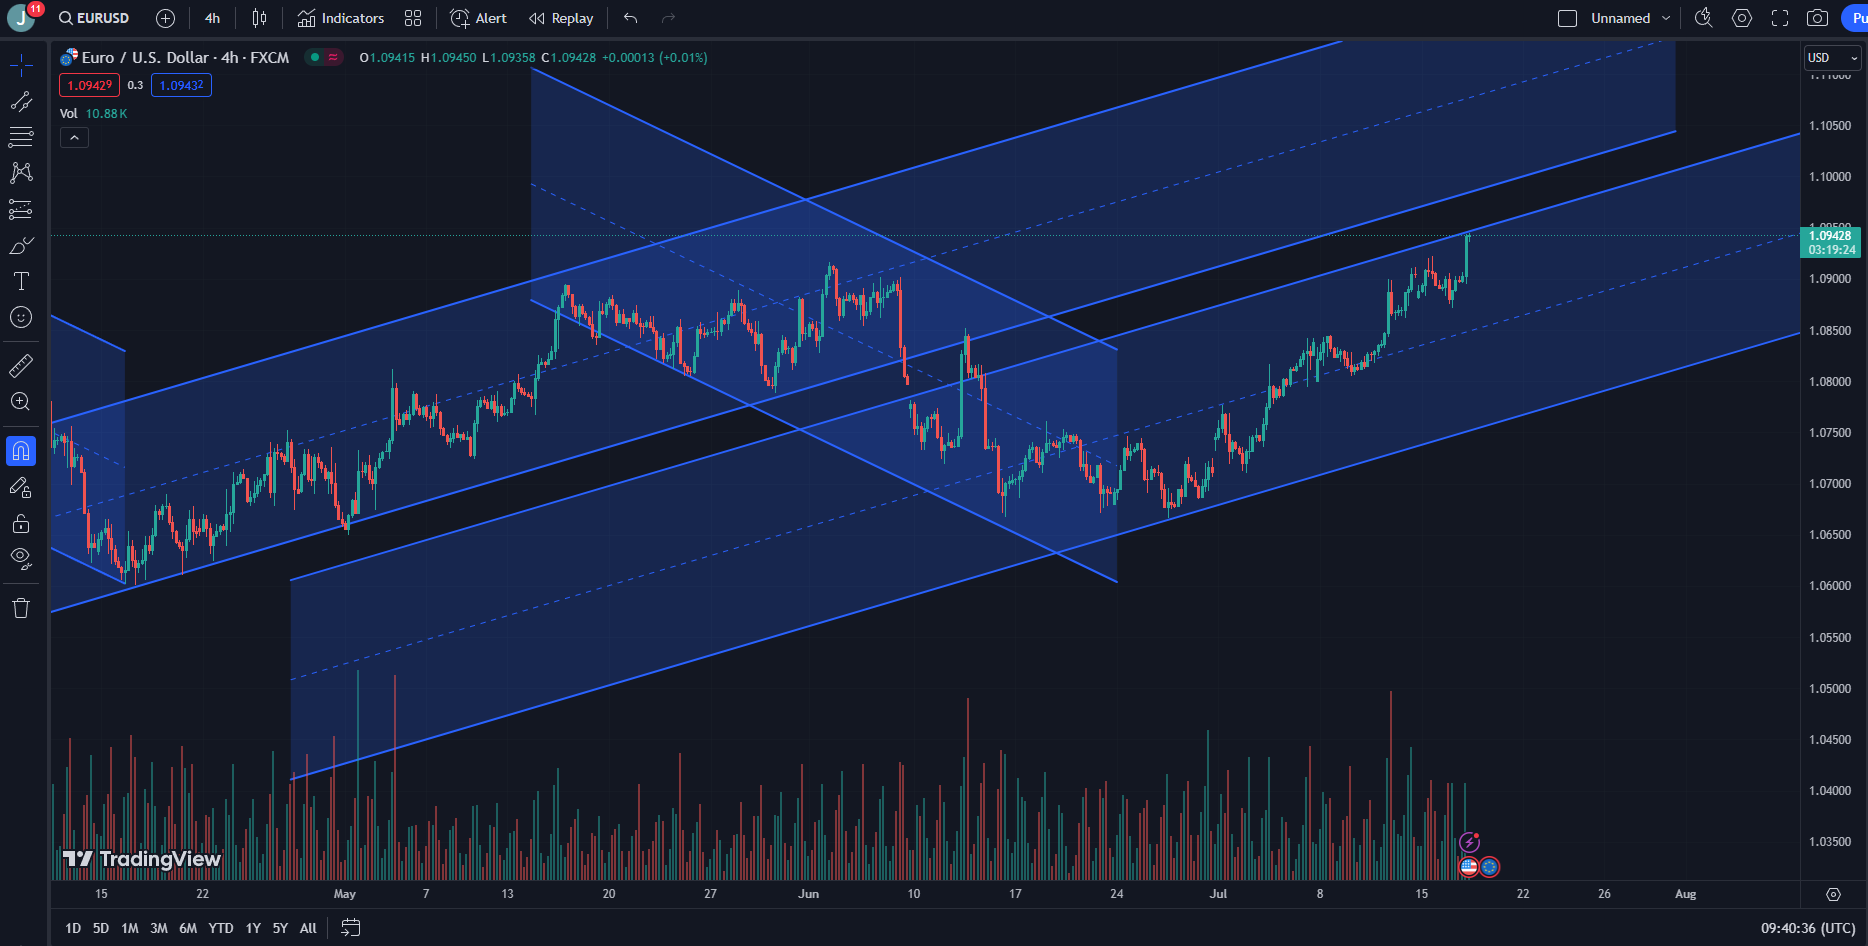
You draw this chart professionally mate.
Now look at that “Empty” space between Upper and Lower Channel – This is what I named The Banana Slide – and believe it or not it exists at least 30 years – I have found it out on old USDDEM charts , and when EUR was born , I didn’t expect to see it again…but there it was…and still is 😀
July 17, 2024 at 9:41 am #9233Im looking at weekly charts right now and I notice from previous week that trendline that we draw before which we use for resistance and support isnt not always the same. I’ve got a question?. How long does the trendline from before stay true. How long do we keep using it the lines we made from the past?
 July 17, 2024 at 9:12 am #9232July 16, 2024 at 6:39 am #9172July 15, 2024 at 9:30 pm #9168July 15, 2024 at 8:51 pm #9167July 15, 2024 at 8:42 pm #9166July 15, 2024 at 7:38 pm #9164
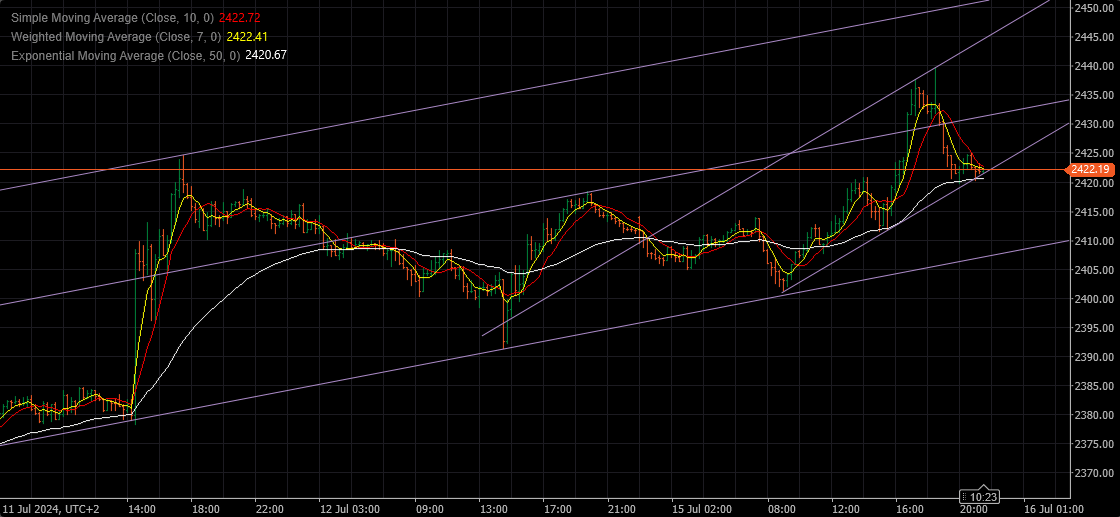
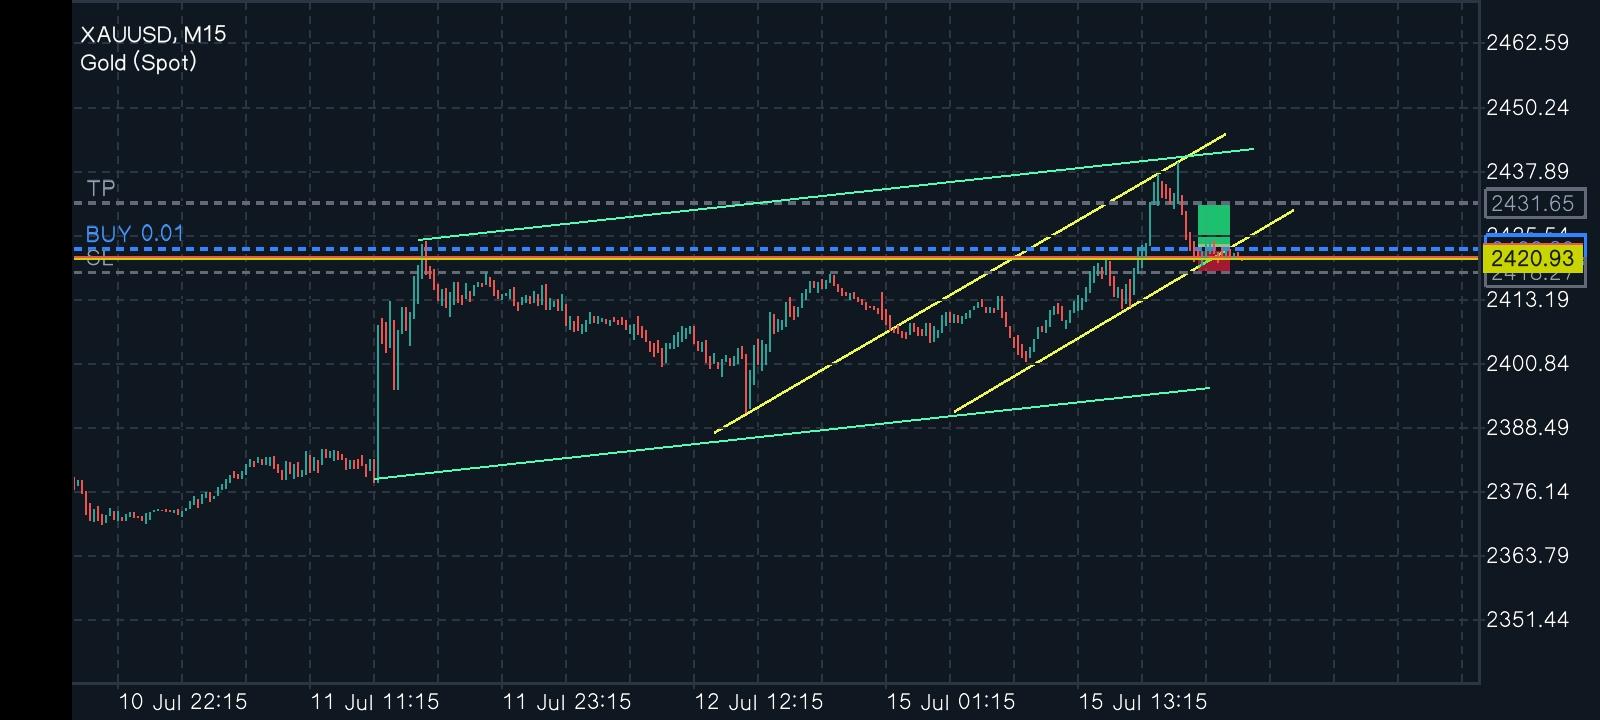
David, look at my charts and you’ll see that I am always drawing Channels – once I draw the trend line, I clone it ( make a parallel line ) based on that trend line.
Then I look for Tops that make sense and place that Parallel line .
Reason for it is to get a “playing field “ – range within which I expect the instrument to move. So that way I get ideas what can I expect the profit targets will be.
Tomorrow I’ll post another lesson, and this one will cover this issue fully – again, if you find something not clear, just ask.
Here is how it should look like:
Gold 15 min
Bigger channel , separated in two levels
Sharper angle trend line – you add a parallel line to the top, and you get a channel within the channel.
If that Support holds, you can expect it to go till the upper line…
 July 15, 2024 at 6:39 pm #9155July 15, 2024 at 8:04 am #9128
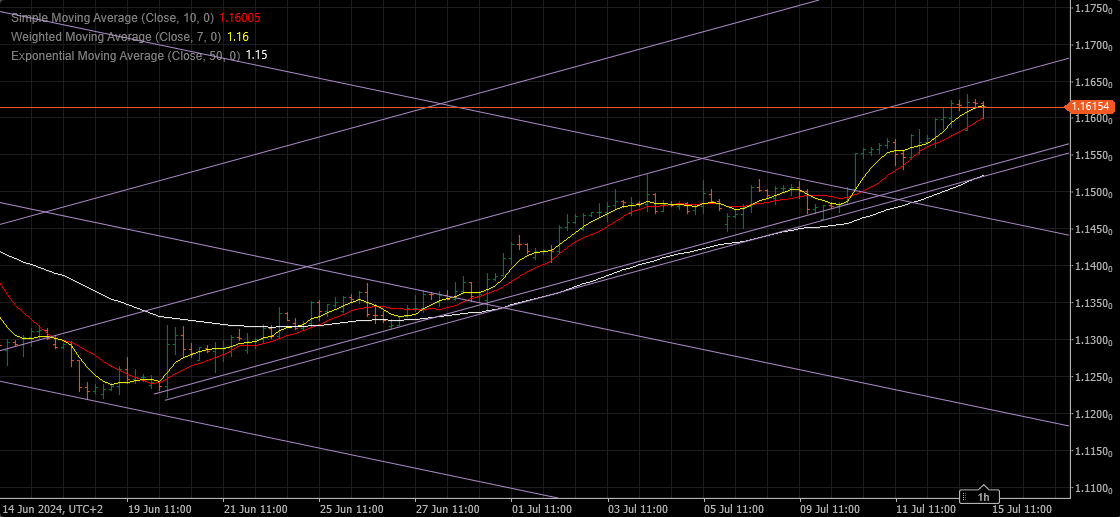
GBPCHF 4h
Supports : 1.15950 , 1.15600 & 1.15250
Resistances : 1.16250 , 1.16350 & 1.16500
Close of this Bar above 1.16200 would call for more Up
Break Above 1.16500 would open a new playing field – Higher channel !
Robinson, where are the trend lines on your chart ?? Playing on hunch or gut feeling ???
Let me be clear – we can all hit the gold once in a while, but we need to be wrong just one time , going in without the stop and the whole margin will be wiped out easily.
Discipline is the Major part of trading .
Rules of engagement .
Please try to copy my trend lines for now…I should know what am I doing …
 July 15, 2024 at 7:53 am #9127
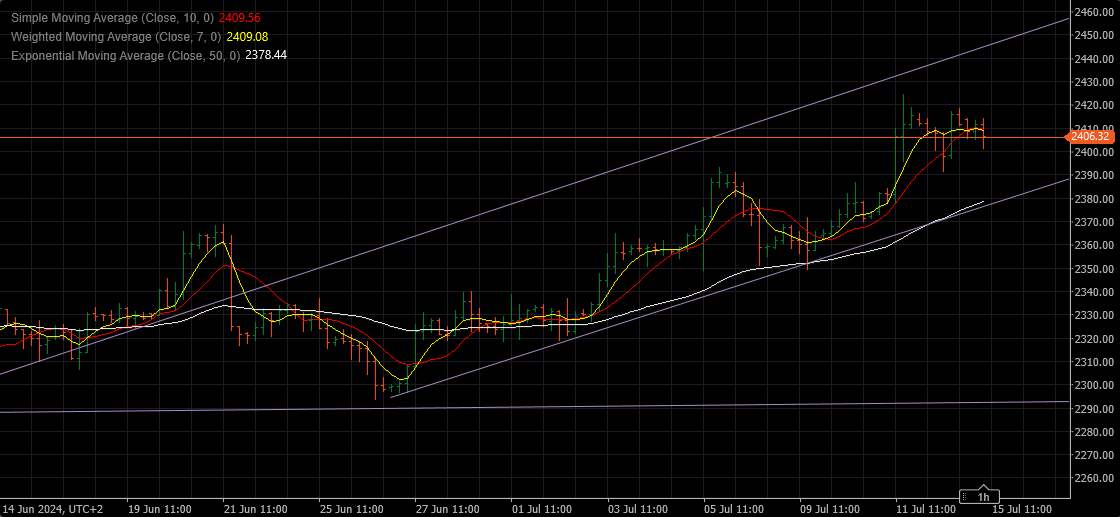
XAUUSD – Gold 4h
This is the current playing field.
Supports : 2400.00 , 2390.00 & 2.375.00
Resistances : 2.415.00 , 2.425.00 & 2.450.00
To continue Up, needs to close this or the next bar above 2.410.00
As long as within this channel , it is in Up trend.
Watch for possible triple Top on Daily !
This is not any more an easy task.
 July 14, 2024 at 11:25 pm #9122July 14, 2024 at 10:27 pm #9119July 12, 2024 at 7:32 pm #9077July 12, 2024 at 3:12 pm #9064July 12, 2024 at 2:49 pm #9063July 12, 2024 at 2:46 pm #9062
-
AuthorPosts
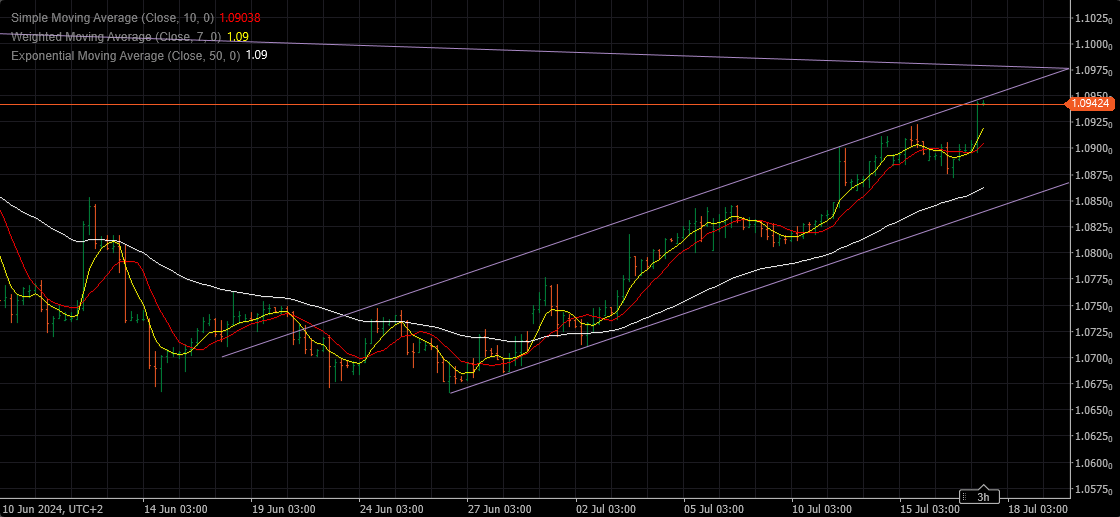
 Ok, now I think I am getting it a little, that why I went to correct myself, and I really appreciate the explanation,
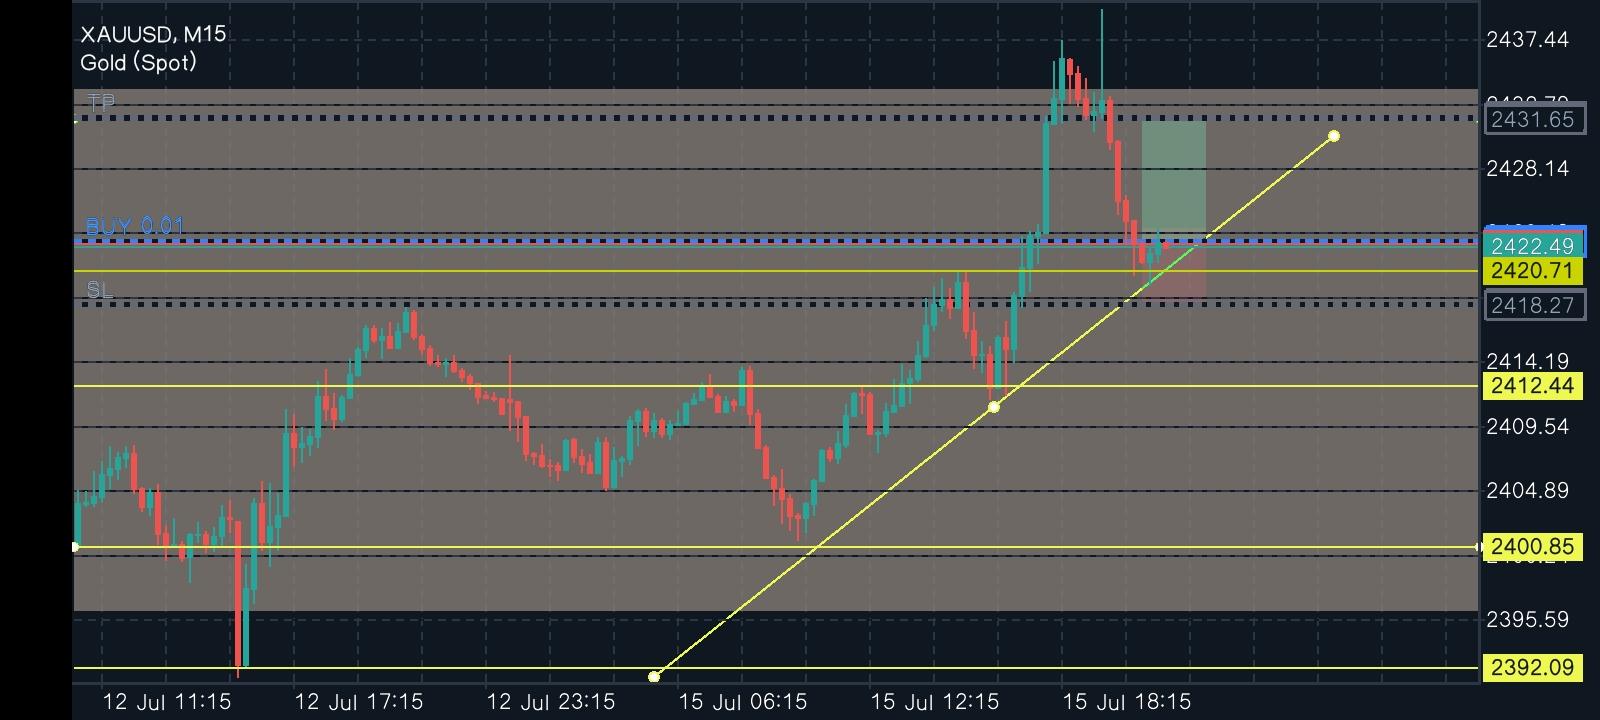 Hello Bobby,
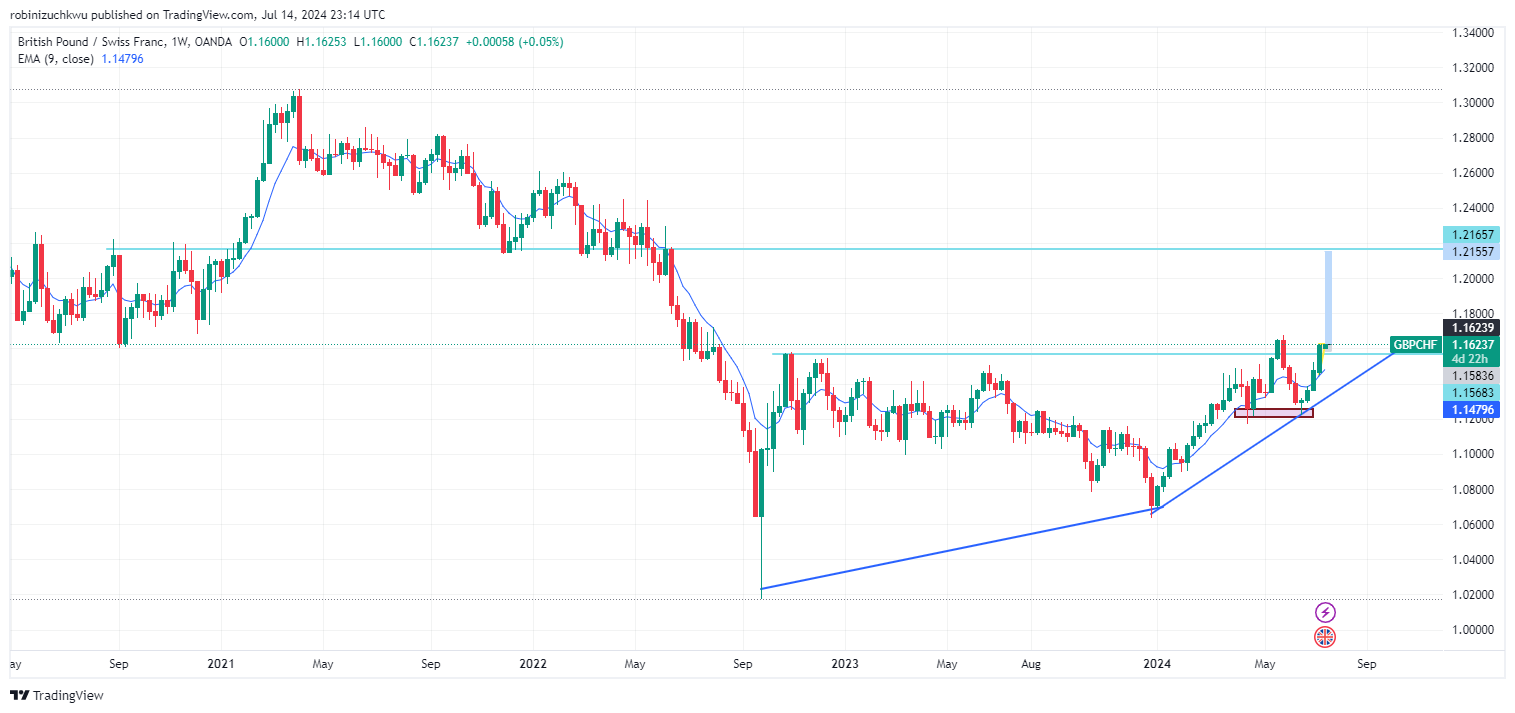
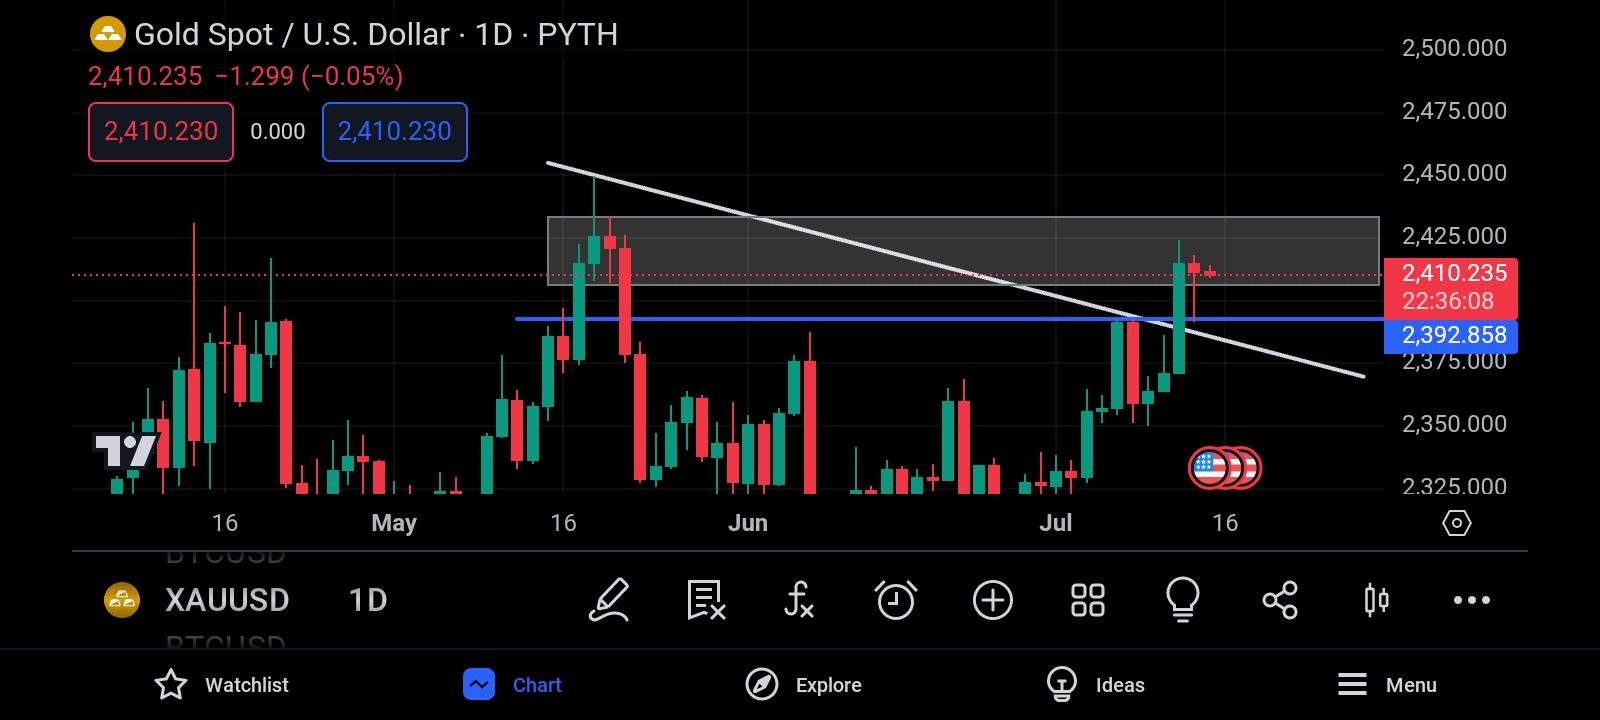
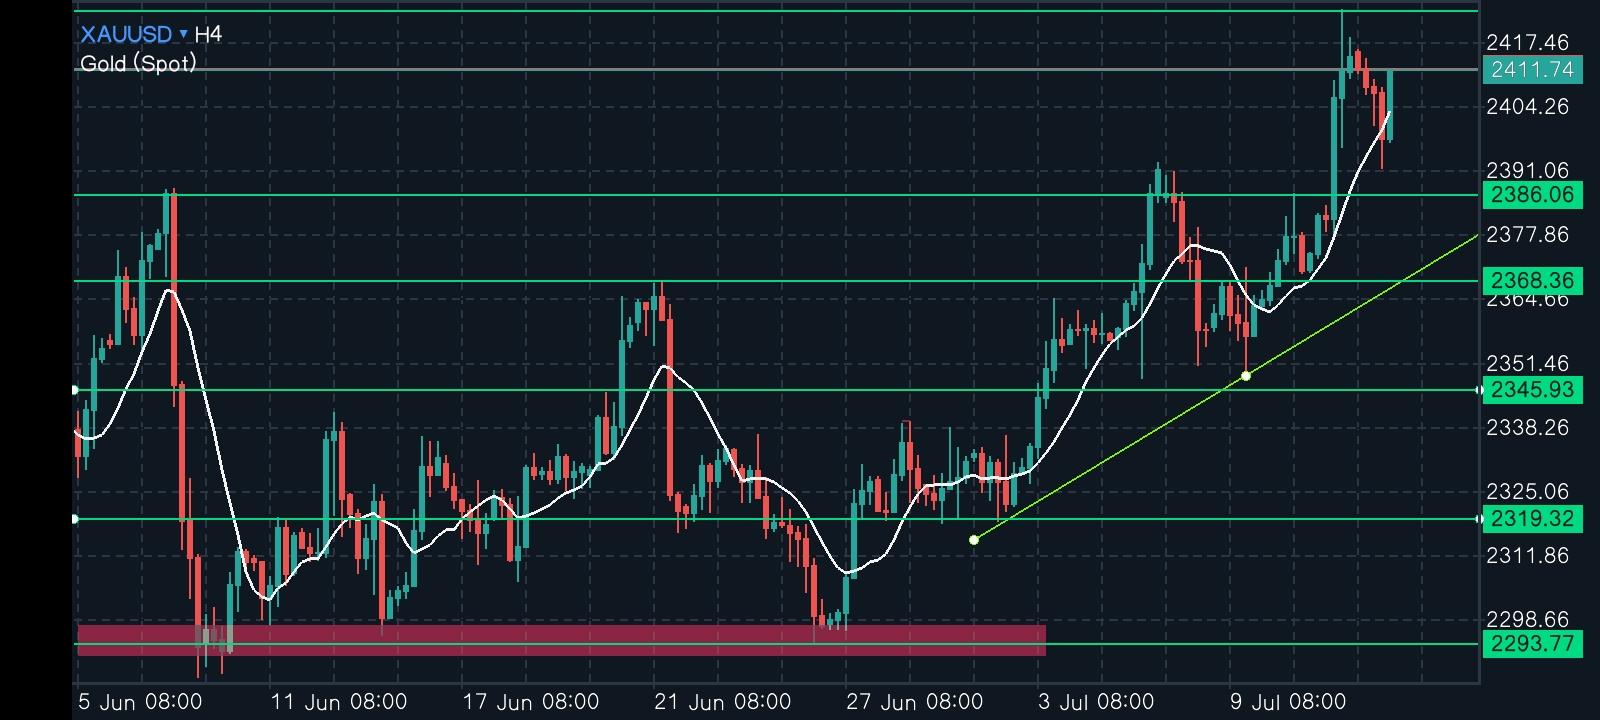
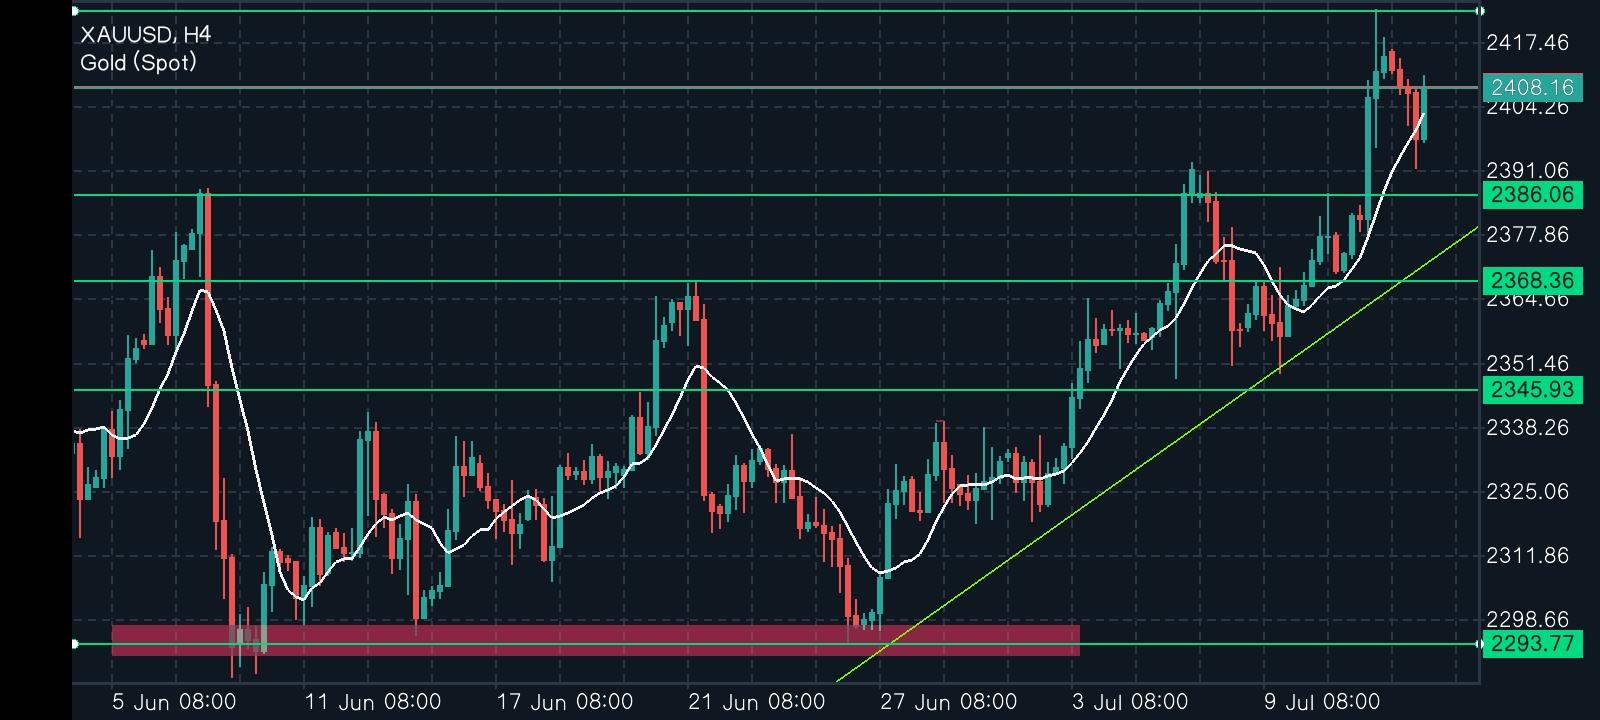 Like this right?
- You must be logged in to reply to this topic.
Search
© 2024 Global View