
- This topic has 28,429 replies, 54 voices, and was last updated 8 minutes ago by GVI Forex 2.
-
AuthorPosts
-
May 9, 2024 at 6:10 pm #6020
THERE ARE SOME TIMELY ARTICLES DUE OUT NEXT WEEK, MAKING THIS A TIMELY ARTICLE WORTH READING
News that Moves the Forex Market
 May 9, 2024 at 5:57 pm #6018May 9, 2024 at 5:46 pm #6017
BoE stays pat at 5.25%
—
Paris Olympics defence system mistakes air conditioners for dronesConcern for the 500,000 Britons expected to attend the Paris Olympics has risen amid claims that France’s new €350 million anti-drone system cannot distinguish between unmanned terrorist and air conditioners.
personally … am not sure this was a smart idea to make it public, geezus
May 9, 2024 at 5:30 pm #6016USDCAD 1 HOUR CHART – LOONIE TUNES

Sometimes the CAD is referred to as the Loonie and for good reason but not this time USDCAD was trading soft even when the USD moved higher earlier today. So it should be no surprise to see it trade down when the USD turned soft.
As this chart shows, there are layers of support between 1.3620-80 that needs to break for the move down to pick up steam.
Look for a limited upside if it stays below 1.3713.
Note the key Canadian jobs report is released on Friday.
May 9, 2024 at 4:43 pm #6015May 9, 2024 at 4:41 pm #6014May 9, 2024 at 4:09 pm #6013May 9, 2024 at 2:28 pm #6010May 9, 2024 at 2:24 pm #6009May 9, 2024 at 2:22 pm #6008Vix futures have been sideways for 12 hours with a slight undertow in volume (short side). Dow covered calls fell off of a cliff around at session end yesterday, since there was zero impetus the odds were stacked that stocks would catch a bid today. That said there is already an increase in underlying puts to a slight extent which could assist in putting a cap in the gains. I like your 106 DXY notation earlier Jay. Result with consideration to many other things could end up being some bit of a continuation in risk appetite only to be followed by an offered scenario in risk coming up I think. Hence why I am already scaling in the long side of USD from below.
If the mood changes I switch, that simple.
May 9, 2024 at 2:14 pm #6007XAUUSD 4 HOUR CHART –

I was not even looking at gold until I saw commodity currencies rallying and this chart tells it all.
The failure to establish below 2300 has seen a pop that faces a resistance at 2332, If broken then 2352 becomes the target.
On the downside, XAUUSD keeps a bid as long as it stays above 2323.
May 9, 2024 at 2:04 pm #6006May 9, 2024 at 1:56 pm #6005May 9, 2024 at 1:35 pm #6004USDJPY 4 HOUR CHART – WARY OF THE BOJ
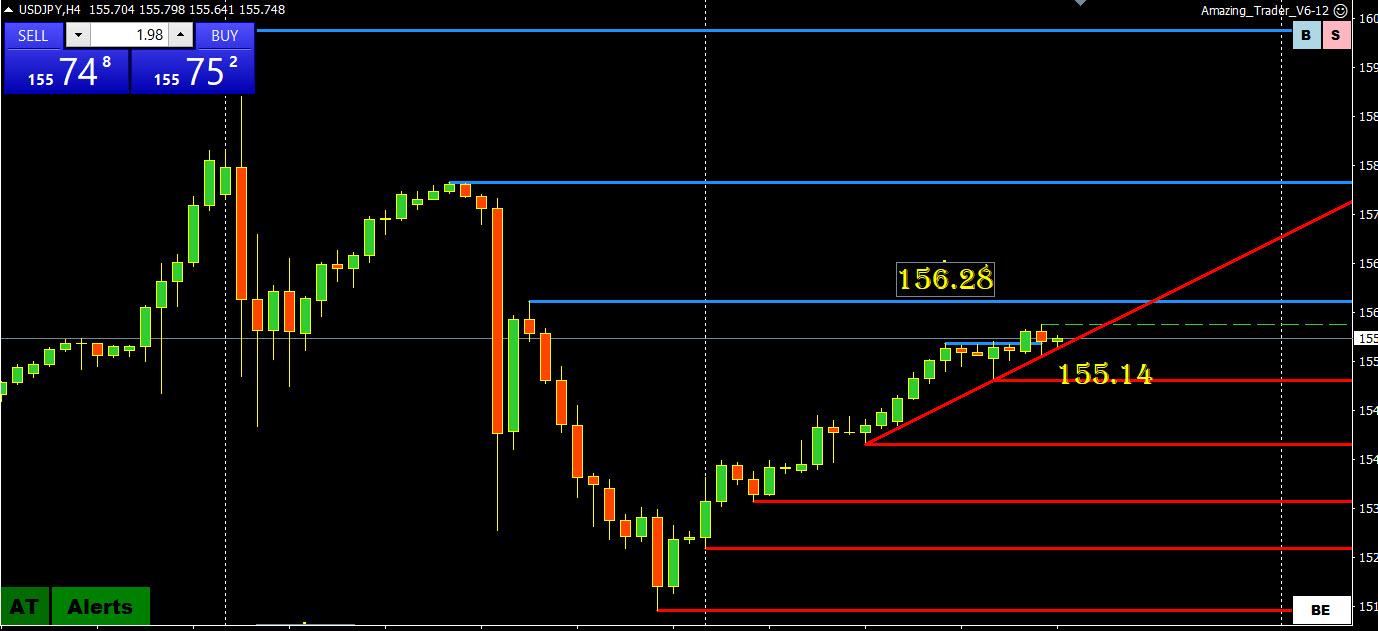
USDJPY has slipped into the background as the market seems wary of provoking the BoJ.
As I noted, the BoJ pays attention to the same technicals we do and in this regard will try to keep USDJPY below 156.28.
On the upside, USDJOY trades with a better bid while above 155 so currently trapped between 155.00-156.28.
Word of caution… be wary of an intervention surprise on a thin Friday but if I was the BoJ I would not be in a rush to intervene again with USDJ
May 9, 2024 at 1:29 pm #6003May 9, 2024 at 1:21 pm #6002May 9, 2024 at 1:16 pm #6001May 9, 2024 at 1:04 pm #6000May 9, 2024 at 1:01 pm #5999May 9, 2024 at 12:47 pm #5998May 9, 2024 at 12:40 pm #5997US weekly jobless claims rise more than expected
Yields dip, USD dips, stocks pop
Note this is not the BLS survey week
May 9, 2024 at 12:18 pm #5996EURGBP 4 HOUR CHART – Watch .8600
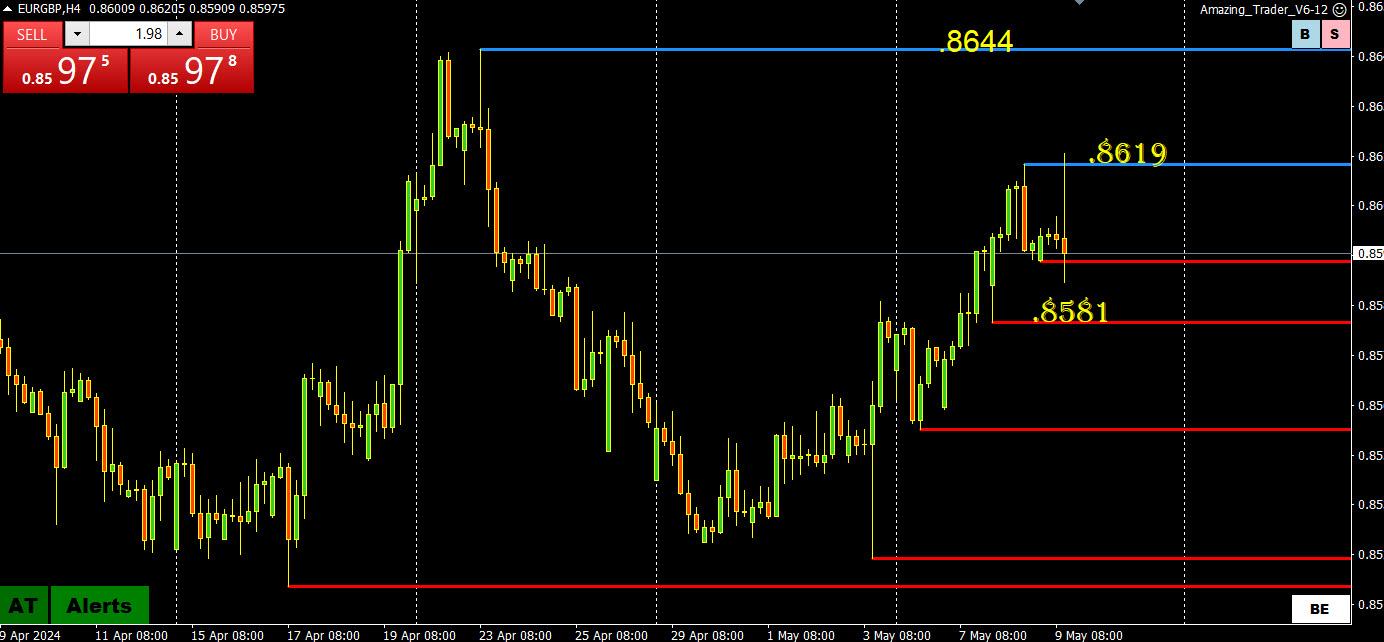
Looking at this chart, technicals are still pointed up but the range is .8581-.8619, with .8600 as the midpoint.
For me this suggests using .8600 as a barometer of GBP strength (relative term) or weakness.On the upside, a firm break above .8620 would put the major,8744 level in play.
On the downside, a firm break of .8580 would suggest the high is in for now and cooling pressure on GBPUSD.
Likely see support on dips while above .8581.
May 9, 2024 at 12:07 pm #5995GBPUSD 4 HIUR CHART
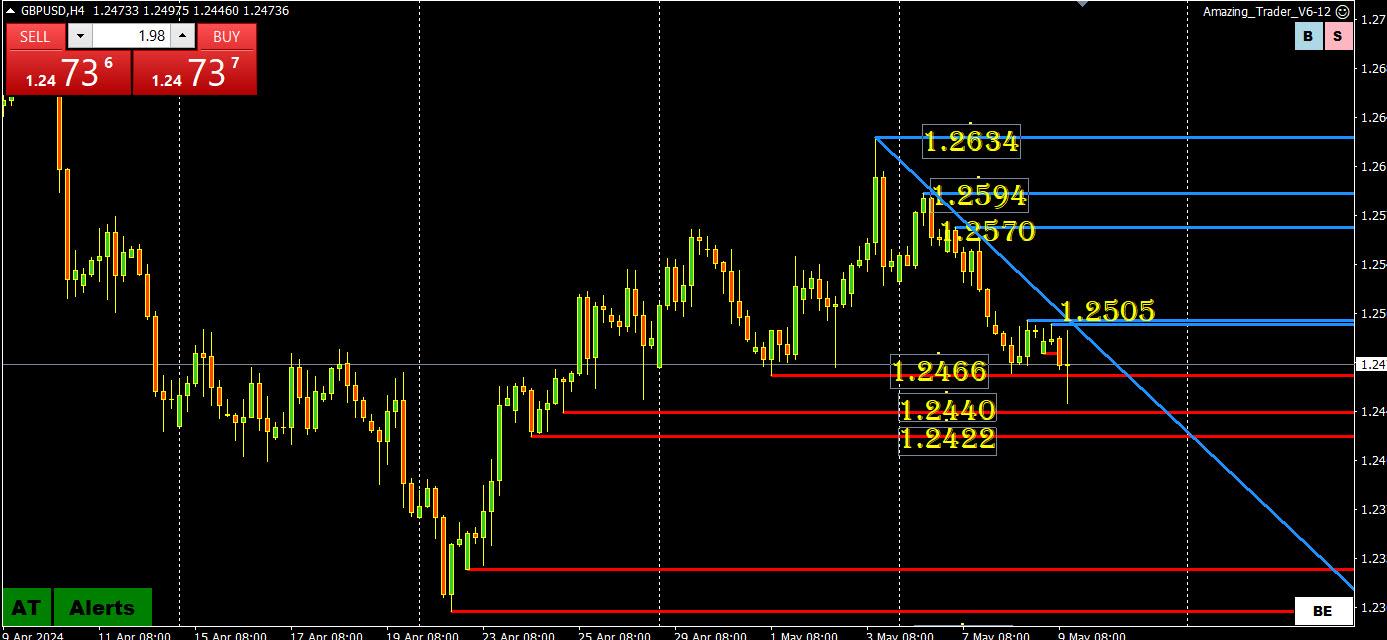
Break off 1.2466 has so far been unable to reach 1.2422-40. The significance of these levels is below it would open the floodgates on the downside (major support is at 1.2298).
Otherwise, there are two pivotal levels
1.2500-05 on top
and
1.2450 (Power of 50 level) for intra-day trading bias (currently back above it)
As I noted, also loom at EURGBP as an indicator of GBP weakness or noit.
May 9, 2024 at 11:10 am #5994May 9, 2024 at 10:20 am #5993Learning To Read The Sign(s)
Keywords: greed, greed, greed, naivety, greed
–
Binance Pledged to Thwart Suspicious Trading—Until It Involved a Lamborghini-Loving High Roller
Former company insiders say the firing of an internal investigator showed that the crypto exchange neglected evidence of market manipulation.May 9, 2024 at 10:10 am #5992May 9, 2024 at 10:10 am #5991May 9, 2024 at 10:00 am #5990EURUSD Daily
Trendline’s Supports and Resistances
Supports :
1.06650 , 1.04950 & 1.04700
Resistances :
1.08150 , 1.08250 , 1.10500 & 1.11500
Currently in a Buy Mode – as long as we are above 1.06650 we have to treat it as Bullish.Moving Average’s Supports and Resistances:
Supports :
None
Resistances:
1.07300, 1.07450 & 1.07650
Currently in a Sell Mode – as long as bellow 1.07650 it is Bearish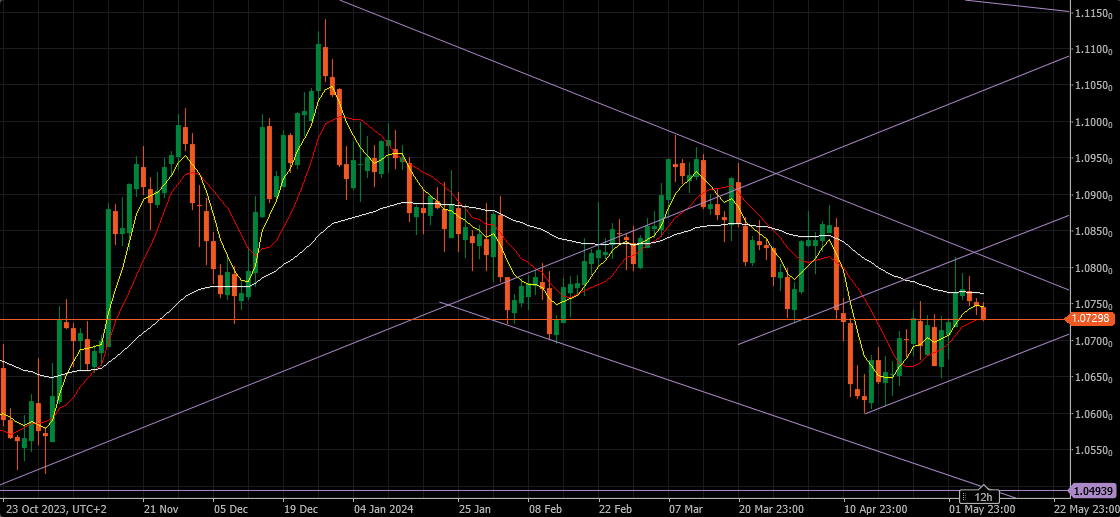 May 9, 2024 at 9:50 am #5988
Summary
BoE expected to keep Bank Rate at 5.25%
Investors watching for hints of a rate cut in June
ECB expected to move next month, Fed going more slowly
UK inflation heading for 2% target but wage growth strong
LONDON, May 9 (Reuters) – The Bank of England is likely to take another step towards its first interest rate cut in four years on Thursday as inflation falls, but will probably be cautious about signalling that a move is imminent.
Bank of England likely to move closer to first rate cut since 2020
May 9, 2024 at 9:48 am #5985USDX 4 HOUR CHART – Why I look at USDX
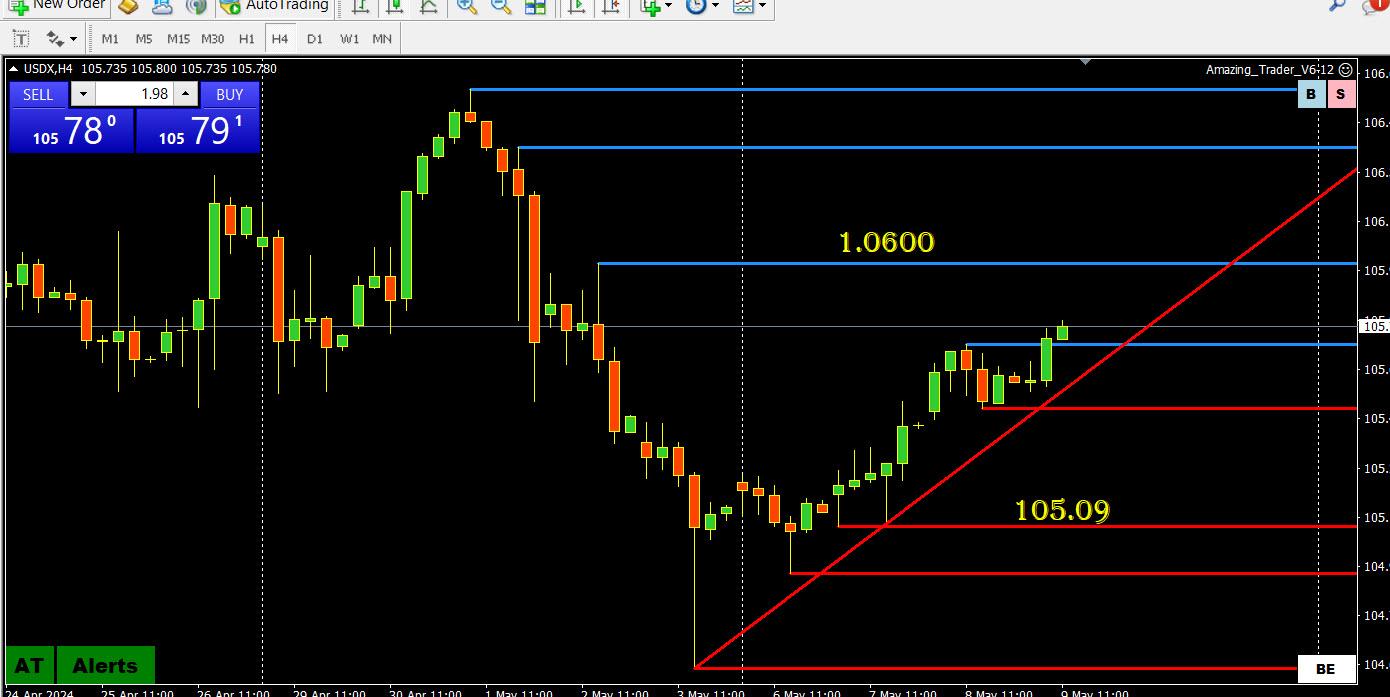
Why am I looking at USDX if I don’t trade it?
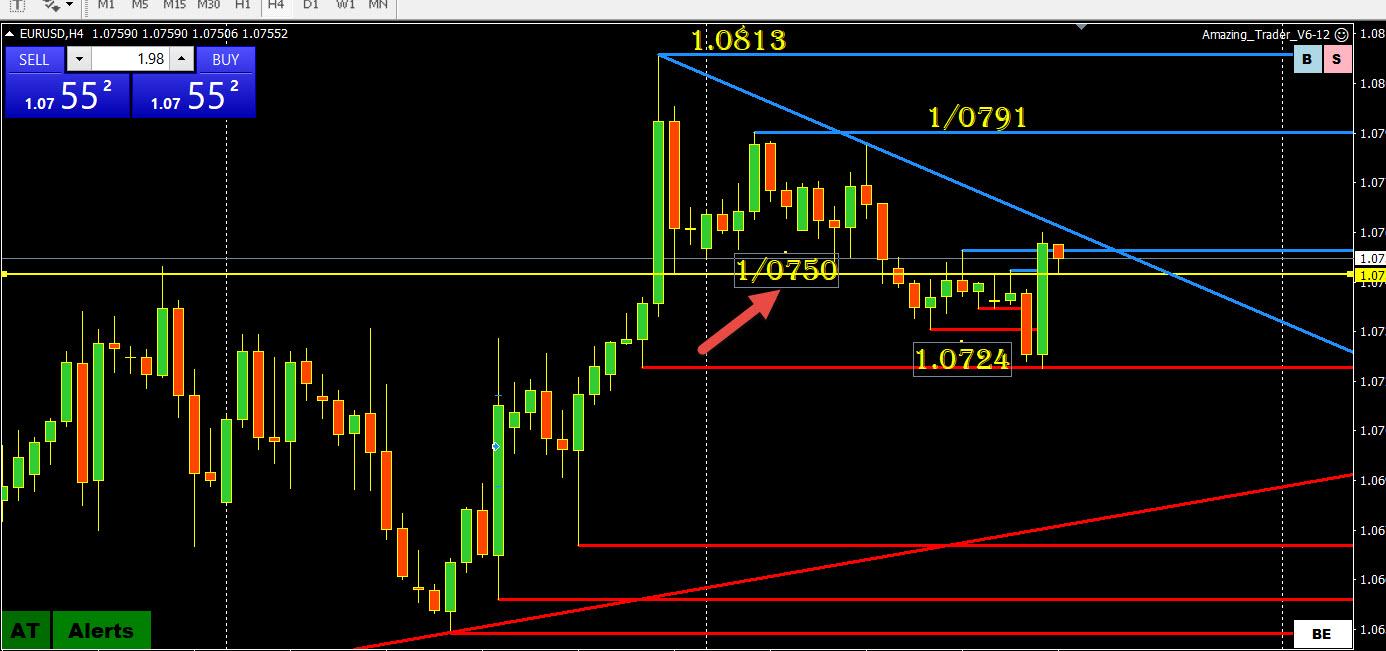
I take a look at USDX as part of my daily routine. With EURUSD representing 57.6% of the index, it often acts as a proxy for this currency.
More than half the battle is to identify the side to trade and this index helps confirm (or not) what I see on a EURUSD chart.
Looking at this chart. USDX continues to recover from last week’s post-US jobs report fall.
It is trying to build momentum to the upside but still faces a key resistance at 106.00. It would likely need EURUSD to extend its retreat to challenge this level.
-
AuthorPosts
- You must be logged in to reply to this topic.
Search
© 2024 Global View